Today I review 2021 Swap Execution Facility (SEF) volumes and market share for both Credit Derivatives and Foreign Exchange Derivatives, in a similar format to my 2020 SEF Market Share Statistics article.
Summary:
- CRD
- Index, Option and Tranche products
- Volume in USD of $7 trillion, down 8% from the prior year
- Volume in EUR of $4.3 tillion, up 48%, Brexit causing an MTF to SEF move
- Bloomberg dominates with 81% share in USD and 76% in EUR
- D2D SEFs with 10% in USD and 17% in EUR
- Tullet the largest D2D SEF
- Option volume in USD of $47 billion and in EUR $7.5 billion
- Tranche volume in USD of $1.6 billion and in EUR of $0.9 billion
- FXD
- FX NDF and FX Options
- FX NDF volumes at $8.6 trillion are up 12%
- FX Opt volumes at $6.8 trillion same as prior year
- FX NDF, BRL, TWD, INR, the three largest currencies
- FX NDF, D2D for LatAm is led by TP with 66.6% share
- FX NDF, D2D for Asia is led by BGC with 35.5% share
- FX NDF, D2C is led by Bloomberg with 50% share
- FX Opt, EURUSD, USDJPY, USDCAD, AUDUSD, the four largest pairs
- FX Opt, Tradition top in 9 out of 13 pairs
- FX Opt, BGC top in 3 and GFI in 1 pair
Clarus SEFView has daily volume data published by each SEF, which is filtered, normalised and aggregated to allow meaningful comparison of volumes and market share statistics.
Onto the charts, data and details.
CRD Volumes and Share
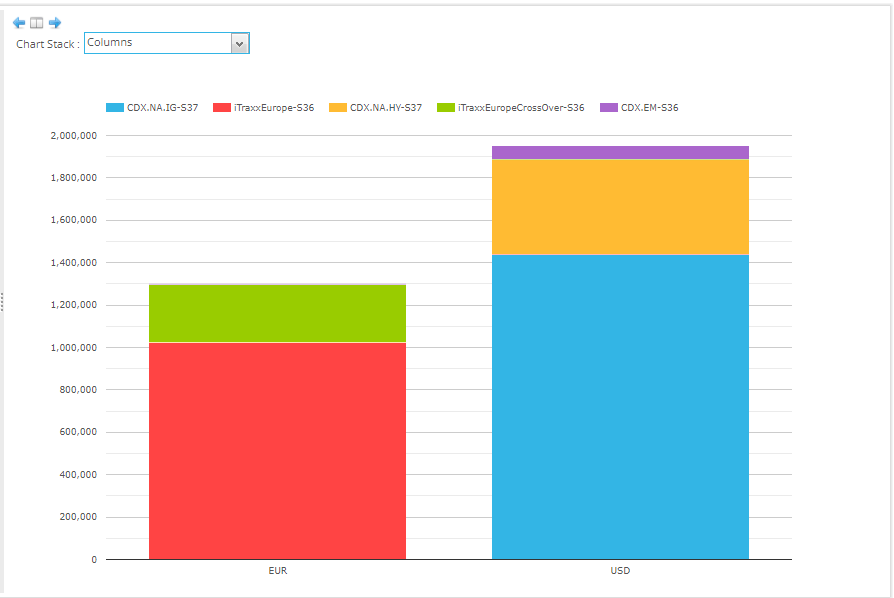
Starting with Credit volumes by currency for each month.
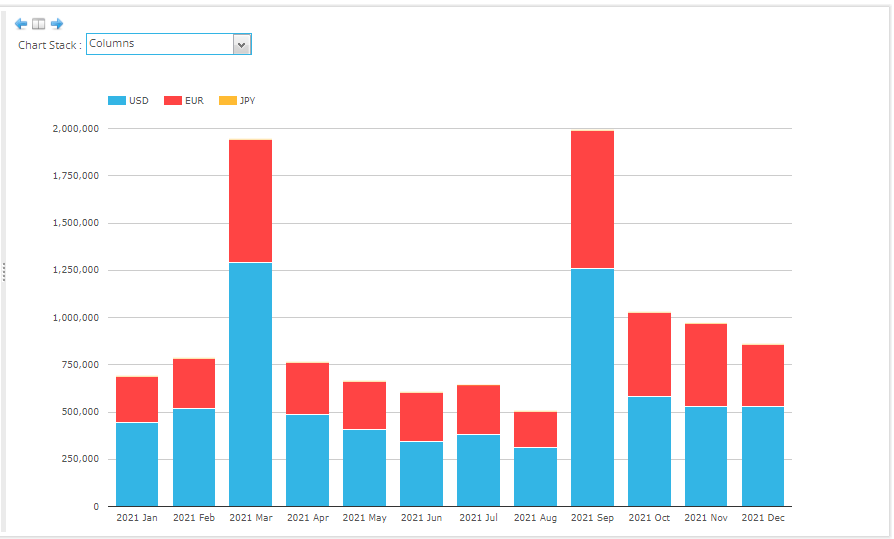
- USD is the largest (CDX.NA.IG, CDX.NA.HY, CDX.EM)
- EUR is next ( iTraxxEurope and iTraxxEuropeCrossOver)
- (Recall CFTC SEF rules govern CDS Index not Single-name, so the latter are not included)
- USD volume in 2021 was $7.1 trillion, down 8% from $7.7 trillion in 2020.
- EUR volume in 2021 was $4.3 trillion, up 48% from $2.9 trillion in 2020!
- (The huge EUR increase is from the migration of volume from UK/EU MTFs to US SEFs, see here and here)
- March and September 2021 are the series roll months with consquently higher volumes
In USD, D2C SEFs represent 90% of the volume and D2D have 10%.
While in EUR D2C SEFs have 83% and D2D 17%. (The higher share D2D share also a result of EUR CDX volumes moving from MTFs to SEFs).
Let’s look at a chart of market share for D2C SEFs.
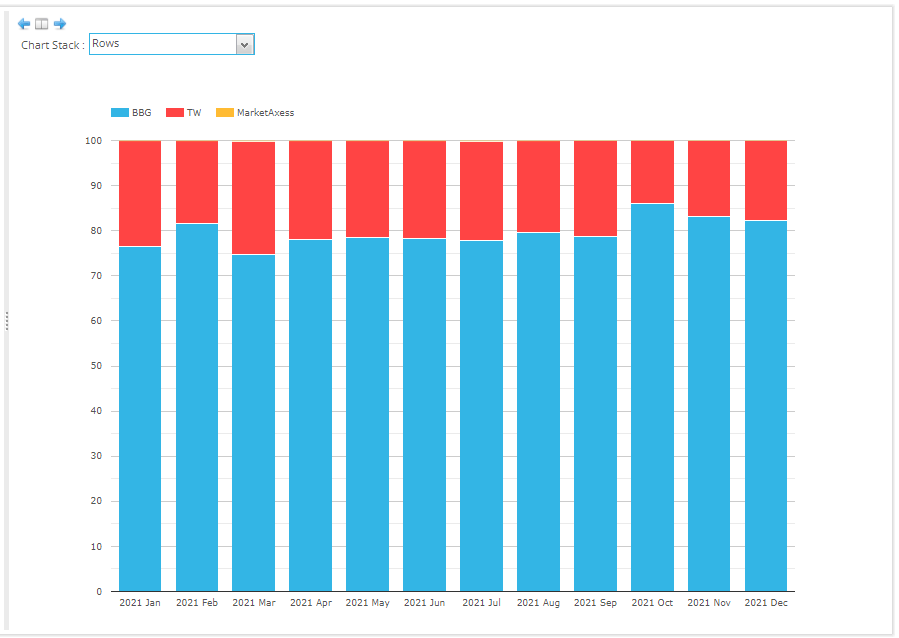
- Bloomberg with a commanding overall share of 79.2%, Tradeweb with 20.7%
- In USD this is Bloomberg 80.9%, Tradweb 19% and MarektAcess 0.1%
- In EUR it is Bloomberg 76.3% and Tradeweb 23.7%
- Some variability month to month, with Tradeweb slightly higher share in series roll months
Gross notional volume in 2021 at these D2C SEFs was $6.4 trillion in USD and $3.6 trillion in EUR.
Next let’s look at a chart of market share for D2D SEFs.
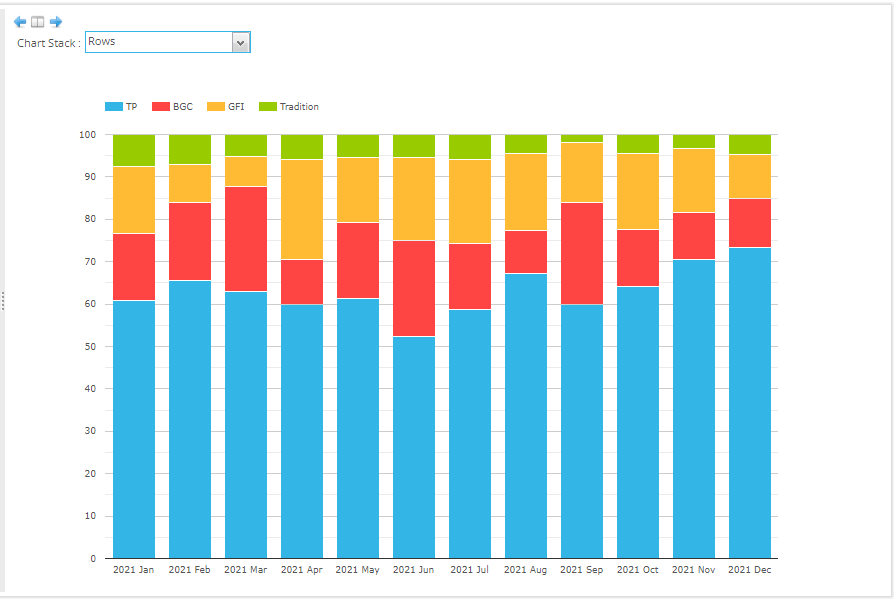
- Tullet the largest with an overall 63.5% share, with 88.6% in USD and 40.2% in EUR
- BGC next with an overall 16.9% share and with 32.3% in EUR and 0.4% in USD
- GFI with an overall 14.6%, wth 27.5% in EUR and 0.7% in USD
- Tradition with an overall 4.9%, 10.2% in USD and 100% in JPY.
- EUR market share split three ways with TP, BGC, GFI in a 40%, 32% and 27% split.
- USD pre-dominately at Tullet and JPY all at Tradition
Volume in 2021 at these D2D SEFs was $684 billion in USD, $735 billion in EUR and $18 million in JPY.
Next a chart of Currency and Product Type for 2021.
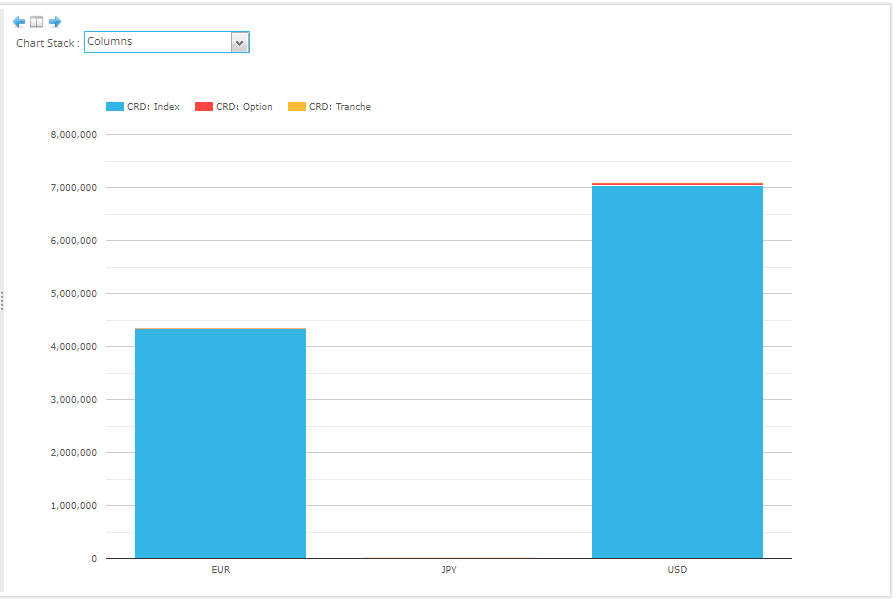
- EUR Index volume is $4.3 trillion, Option is $7.5 billion and Tranche is $930 million
- (compared to 2020 volumes of $2.9 trillion, $8.6 billion and $720 million respectively)
- All the Option and Tranche volume at GFI
- USD Index volume is $7 trillion, Option is $47 billion and Tranche is $1.6 billion,
- (compared to 2020 volumes of $7.7 trillion, $31 billion and $1.9 billion respectively)
- In USD, Tullets with $45.7 billion of Option and Tradition with $1 billion
And finally for Credit, a chart of volume by Index for the current on the run series.
- CDX NA IG S37 the largest with $1.4 trillion in 2021, up from $1 trillion in 2020 and 2019 (current series)
- iTraxx Europe S36 with $1 trillion up from $418 billion in 2021 and $375 billion in 2019
- (the increases due to Brexit and migration of volume from MTFs to SEFs)
- CDX NA HY S37 with $450 billion, up from $320 billion in 2020 and $306 billion in 2019
- iTraxx EuropeCrossOver S36 with $274 billion up from $117 billion in 2020 and $103 billion in 2019
- CDX EM S36 with $65 billion, up from $32 billion in 2020 and $27 billion in 2019
That’s it for CRD.
FXD Volumes and Share
Lets now look at FXD volumes.
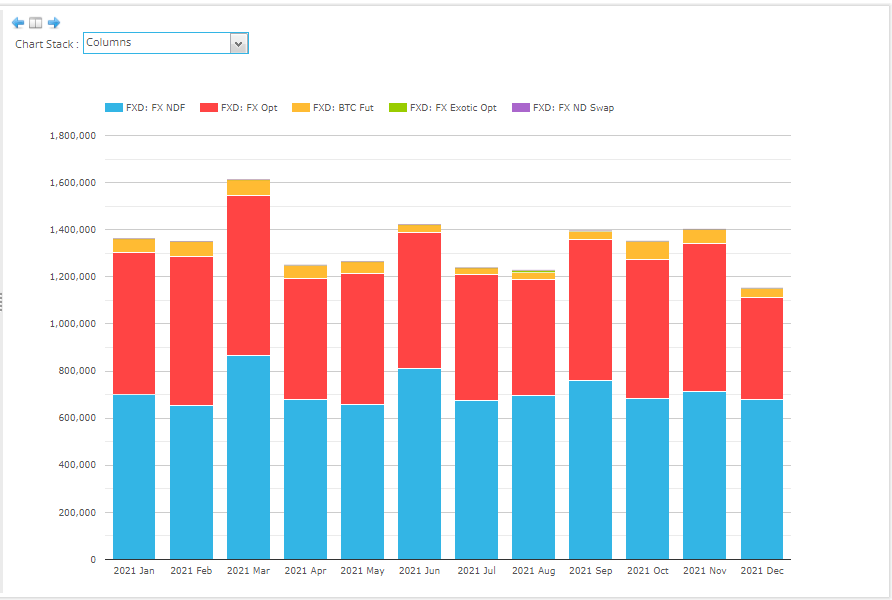
- Non-Deliverable Forwards (NDF) with $8.6 trillion, up 12% from $7.7 trillion in 2020
- FX Options with $6.8 trillion, similar to the $6.9 trillion in 2020
- Bitcoin Futures with $600 billion, up from $142 billion in 2020
- Exotic Options with $18 billion, up from $10 billion
- March 2021, the highest volume month with $1.6 trillion (same as March 2020)
- Other months are in the $1.2 trillion to $1.4 trillion range
Next FX NDF volumes by currency pair.
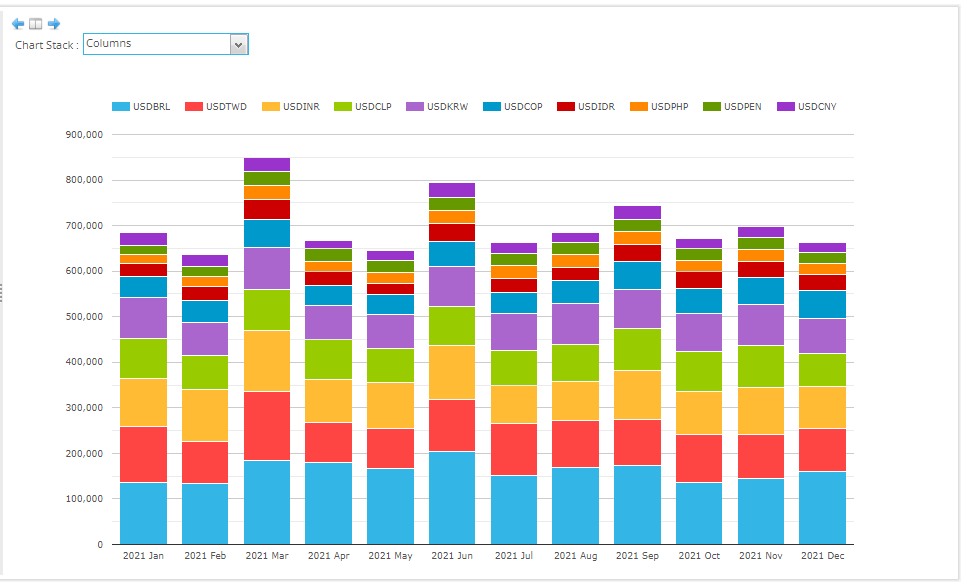
- The largest 10 currencies are BRL, TWD, INR, CLP, KRW, COP, IDR, PHP, PEN, CNY
- The changes in order from 2020 are that CLP is now above KRW and PHP above PEN & CNY
- These 10 currency pairs with $8.4 trillion out of the total $8.6 trillion
- BRL by far the largest with $1.95 trillion, up from $1.6 trillion in 2020 and down from $2.2 trillion in 2019
- TWD next with $1.26 trillion, up from $1.1 trillion in 2020 and $860 billion in 2019
- INR with $1.24 trillion, up from $1.06 trillion and $1 trillion in prior years
- CLP with $1 trillion, up from $910 billion and $860 billion
- KRW with $1 trillion, same as 2020 and slightly up from $974 billion in 2019
- Then a big gap to COP with$628 billion, up from $560 billion and $414 billion
- IDR with $401 billion, PHP $314 billion, PEN $309 billion and CNY $302 billion
NDF volume in the 10 largest currencies is dominated by D2D SEFs with 86% vs 14% for D2C, a material increase in D2C from 2020 and 2019 with 92% D2D vs 8% for D2C. A sign of more client trading (or even clearing) of NDFs?
Next NDF percent market share for D2D SEFs by month.
First for LatAm currency pairs (BRL, CLP, COP, PEN).
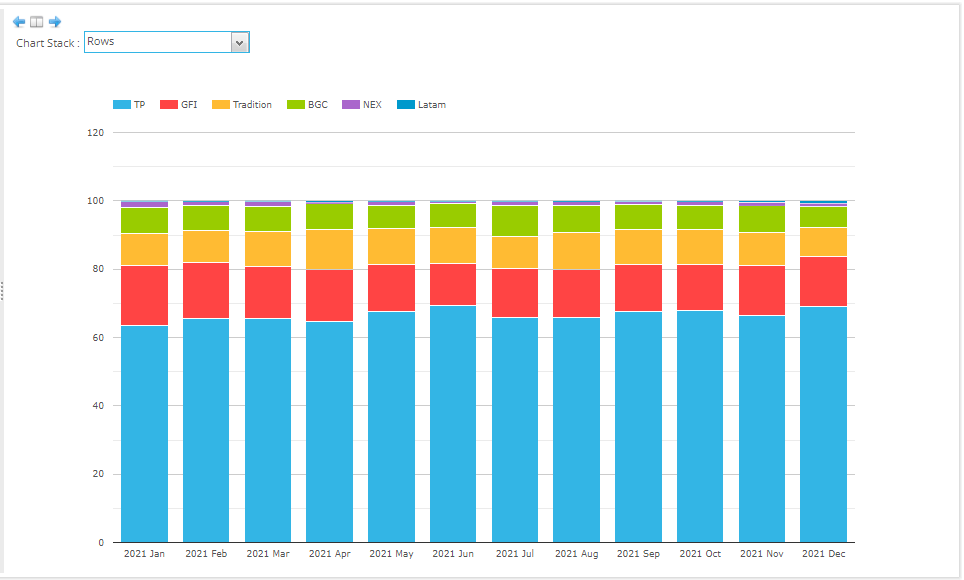
- TP the largest with 66.6% share up from 62.8% in 2020 and 62% in 2019
- GFI next with $14.6%, down from 15.1% and 15.2% in prior years
- Tradition with 10.1%, same as 2020 and up from 6.7% in 2019
- BGC with 7.4%, down from 9.9% and 13.2% in prior years
- NEX with 1%, down from 1.7% and 2.3%
- Latam with 0.3%,down from 0.4% and 0.6% in prior years
Next D2D SEF Asian currency pairs (CNY, IDR, INR, KRW, PHP, TWD)

- BGC the largest with $35.5%, similar to 35.9% in 2020, up from 29.6% in 2019
- TP next with 29.5%, similar to 29.4% in 2020 , up from 26.8% in 2019
- NEX with 22.2%, down from 23.8% and 31% in prior years
- Tradition with 12.3%, up from 8.3% and 6.7% in prior years
- GFI with 0.1%, down from 2.6% and 6% in prior years
Next the D2C SEFs (the 10 largest ccy pairs).
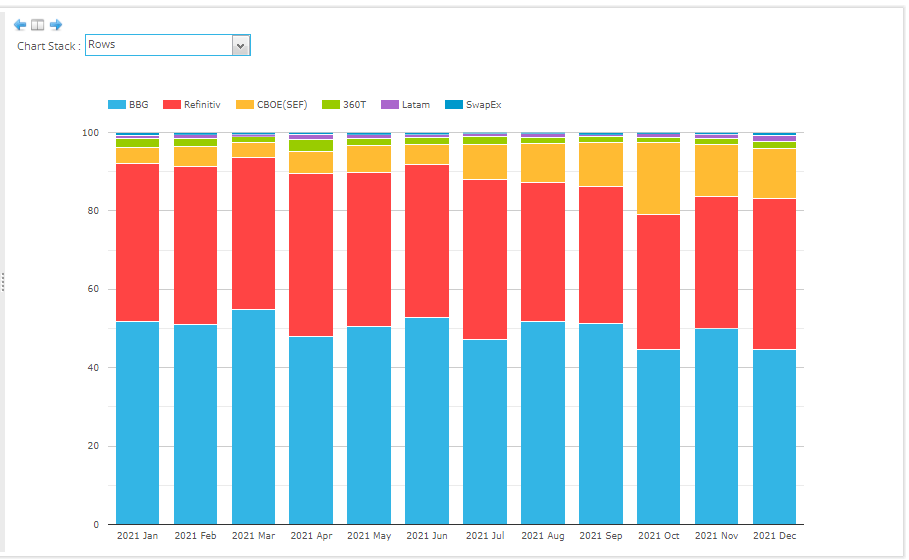
- Bloomberg the largest with 49.9% share, similar to 49.6% in 2020, a high of 63.5% in BRL
- Refinitiv close with 37.9%, down from 43.6% in 2020, a high of 68.8% in CNY
- CBOE with 8.9%, up from 3.2% in 2020 (with IDR, INR, TWD each at 12% or higher)
- 360T with 1.8%, down from 2.6% in 2020, a high in CNY of 7.4%
- Latam with 0.9%, a high of 9.1% in CLP
- SwapEx with 0.5%, down from 1%
Next FX Option volumes by currency pair.
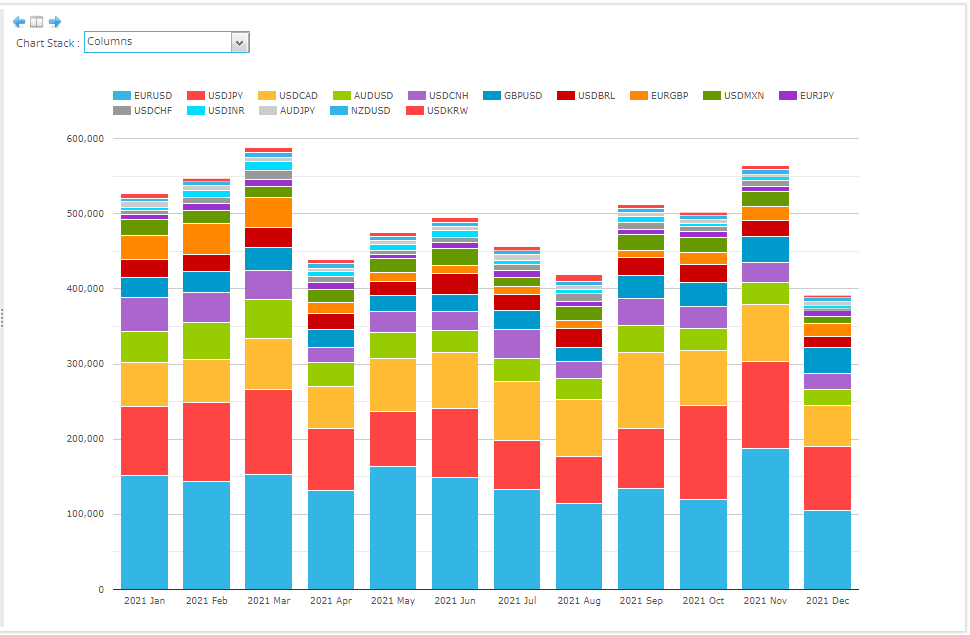
- The largest 15 currency pairs are shown above (in order top left to bottom right)
- EURUSD by far the largest with $1.7 trillion, down from $2 trillion in 2020 and $1.8 trillion in 2019
- USDJPY next with $1.1 trillion down from $1.34 trillion and $1.35 trillion in prior years
- USDCAD with $840 billion, up from $610 billion and $470 billion
- AUDUSD with $415 billion, up from $304 billion and $340 billion (and now above GBP and CNH)
- USDCNH with $370 billion, up from $312 billion and $352 billion
- GBPUSD with $330 billlion, similar to $335 billion in 2020, but down from $595 billion in 2019
- USDBRL with $273 billion, up from $230 billion but down from $380 billion
- EURGBP with $230 billion, up from $205 billion and down from $238 billion in prior years
FXO volumes are dominated by D2D SEFs with 99% v 1% for D2C, similar to prior years.
Let’s chart 2021 volumes by FXO currency pair and SEF market share.
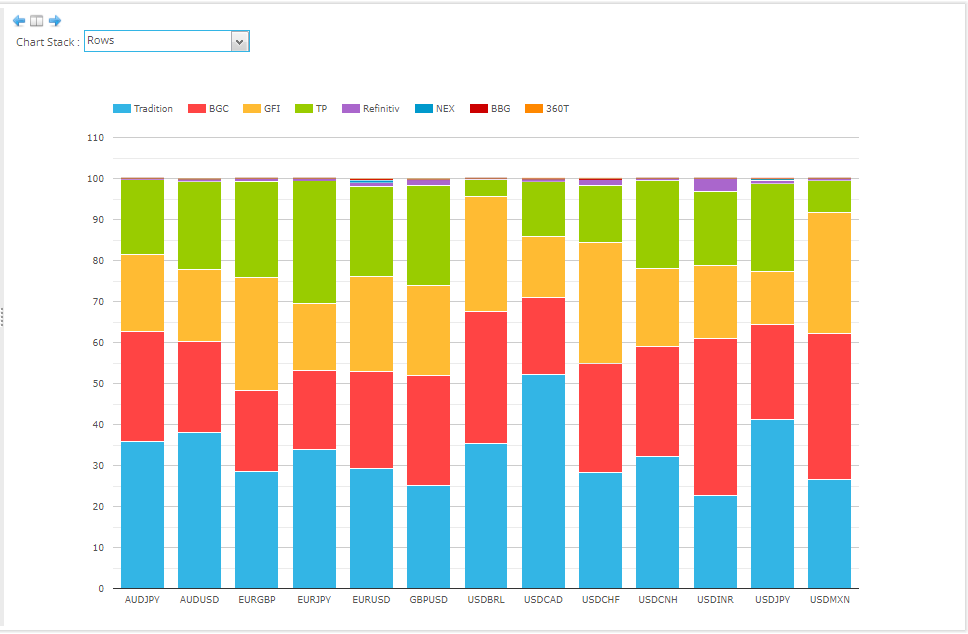
- The cumulatie share for all these pairs is Tradition 35.6%, BGC 24.1%, GFI 19.8% and TP 19.3%
- AUDJPY, Tradition 35.9%, BGC 26.8%
- AUDUSD, Tradition 38%, BGC 22.2%
- EURGBP, Tradition 28.5%, GFI 27.6%, TP 23.4%, BGC 19.8%
- EURJPY, Tradition 34%, TP 30%
- EURUSD, Tradition 29.2%, BGC 23.8%
- GBPUSD, BGC 27%, Tradition 25%, TP 24.5%, GFI 21.9%
- USDBRL, Tradition 35.4%, BGC 32.3%
- USDCAD, Tradition 52.7%
- USDCHF, GFI 29.5%, Tradition 28.2%
- USDCNH, Tradition 32.2%, BGC 27%
- USDINR, BGC 38.4%, Tradition 22.6%
- USDJPY, Tradition 41.3%, BGC 23%
- USDMXN, BGC 35.7%, GFI 29.4%
Thats it for FXD.
(IRD will be covered in separate blog).
The End
That’s it, 12 charts to summarise SEF volumes and market share for CRD & FXD.
There are many more charts I could have created.
I hope you found these useful.
If not, using SEFView you can create your own.
Please contact us for a subscription if you are interested in this data.