We covered EUR iTraxx very briefly in last weeks blog New Brexit Rules Move $4trn of Derivatives to the US, so today I will take a deeper look into these Credit Index Derivatives volumes.
SEF Volumes
Using SEFView we can isolate gross notional volumes in EUR Credit Index Derivatives, meaning the iTraxxEurope family.
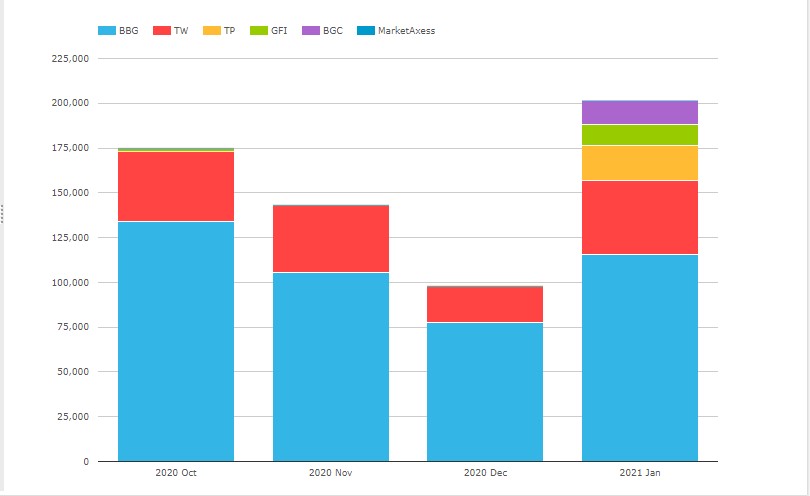
- Showing a sharp jump to €202 billion in Jan 2021
- Prior months €175 billion, €143 billion and €98 billion.
- BGC and TP reporting volume for the first time in Jan 2021
- TP with €19 billion and BGC with €13 billion
- GFI with €12 billion, far higher than the €1.5 billion in Oct 2020
- BBG and Tradeweb with no obviously drastic change in Jan 2021
In summary we would say that three D2D/IDB SEF Venues, (TP, BGC & GFI) have reported volume of €44.5 billion in Jan 2021, up from less €0.5 billion per month before.
Presumably this was volume previously executed on European MTFs or OTFs and (possibly?) reported under MiFiD II regulations. Unfortunately we have yet to obtain any meaningful MiFID II post-trade transparency, but I live in hope at the start of each new year that this will be the year it finally becomes real. It would have been helpful to have this data to hand to provide hard evidence into regulatory policy decisions.
Any change in volume between UK MTF/OTF venues compared to the EU MTF/OTF venues in Amsterdam, Paris, Frankfurt or other locations, would have given us a complete picture.
Global Cleared Volumes
For now, we can only turn to global cleared volumes of EUR Credit Indices, which we have available in CCPView.
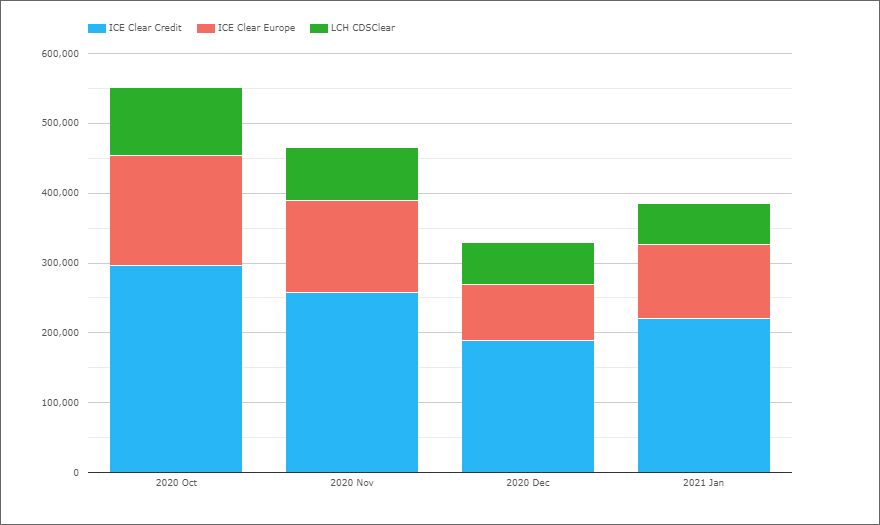
- Showing Jan 2021 with €385 billion
- And no observable change in share between ICE Clear Credit, ICE Clear Europe and LCH CDSClear, which I believe are US, UK and FR registered respectively. Given the CCP equivalence determinations, there has been no observable impact on volumes. For CCPs the risk and margin implications mean that volumes are more stickier than those on trading venues.
As CDS Indices are only really traded as a cleared product (tiny bi-lateral volume), we can create a table of US SEFs share of Global Cleared Volumes in EUR CRD Indices for each of the past 4 months.
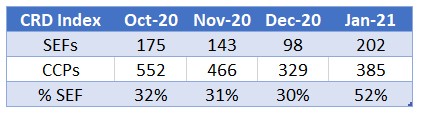
The share of US SEFs jumping to 52% from 31% in the last quarter of 2020, which is a significant change indeed and one that is a direct result of Brexit.
There has been a fair amount of public conjecture as to the reasons why trading has moved to US SEFs. IHS Markit provided some hard figures on IRS, and today we can add hard EUR CRD Indices figures.
Summary
Just over 50% of volume of EUR CRD Indices is now being conducted on US SEFs, up from 30%.
This means that new revenue is being booked in the US, which previously was UK/EU revenue.
A result neither side of the Brexit negotiations would have expected or wanted.
It will be interesting to see if the situation changes in the weeks ahead.
When EU-UK Financial Services negotiations get to the nitty-gritty of Derivatives Trading Obligations.