For a while I have wanted to look into more detail at Interest Rate Basis Swaps, which are an important but little noted product type. So in this article I will look at what the data shows in terms of volume and trends.
First the highlights:
- Basis Swaps are the fifth-largest USD IR product
- $230 billion gross notional was reported in Aug 2015 to US SDRs
- We estimate this is actually $280 billion (allowing for Capped Notionals)
- With 926 trades that is an average trade size of $290 million
- Aug 2015 was the highest month and 35% greater than the 12-month average
- 81% of volume is Cleared and 73% is On SEF
- The are two main types: Libor Tenor Basis and FedFunds
- SEF Market Share shows that Tullet is top with 44% YTD
- Global Cleared Basis volume was $540 billion in Aug 2015
- US SDR Cleared Basis volume represeent 44% of this
Now all the details with charts, data and more.
USD Basis Swaps
Lets start by using SDRView to see the volume traded by US persons in August 2015 compared to other USD Interest Rate products.
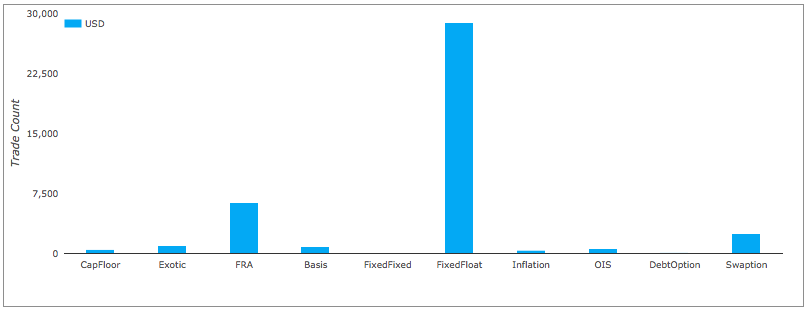
Showing that in Aug 2015:
- 926 IR Basis Swap trades were reported
- Making this the fifth highest Rates product, just behind Exotic
- With only FixedFloat Swaps, FRAs and Swaption higher
- In Gross Notional terms > $230 billion was traded
- Also the fifth highest
- Much higher than Exotic but less than OIS
- And an implied Average Notional of $250 million
Breaking out the August trade counts using SEF and Cleared categories.
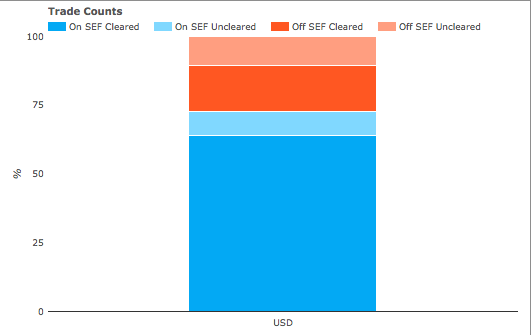
Shows that:
- On SEF Cleared is 64%
- On SEF Uncleared is 9%
- Off SEF Cleared is 17%
- Off SEF Uncleared is 10%
Meaning that 81% is Cleared or 73% is On-SEF.
Volume Trends
Lets now use SDRView to look at monthly volume in the past year, first by trade count.
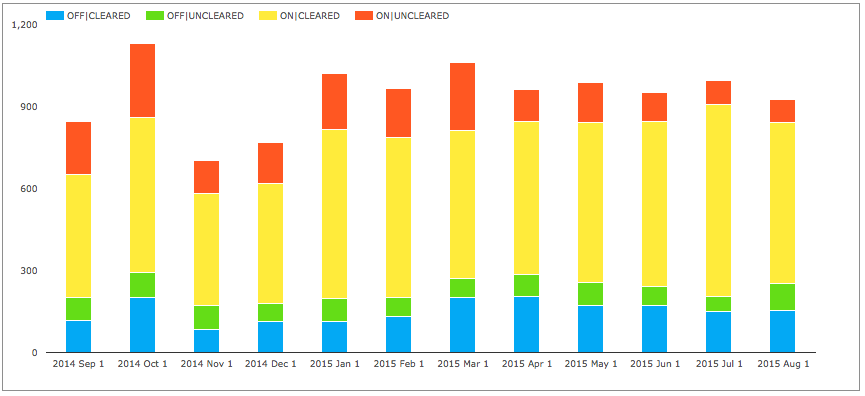
Showing that:
- Oct 2014 was the highest trade volume month, Nov the lowest
- Off SEF Cleared averages 150 trades a month with Mar and Apr higher at 200 trades
- Off SEF Uncleared is 78 trades a month
- On SEF Cleared is 555 trades a month with Nov much lower at 440 and Jul higher at 704
- On SEF Uncleared 158 trades a month with Oct higher at 271 and Jul & Aug lower at 87
And next the same period but by gross notional.
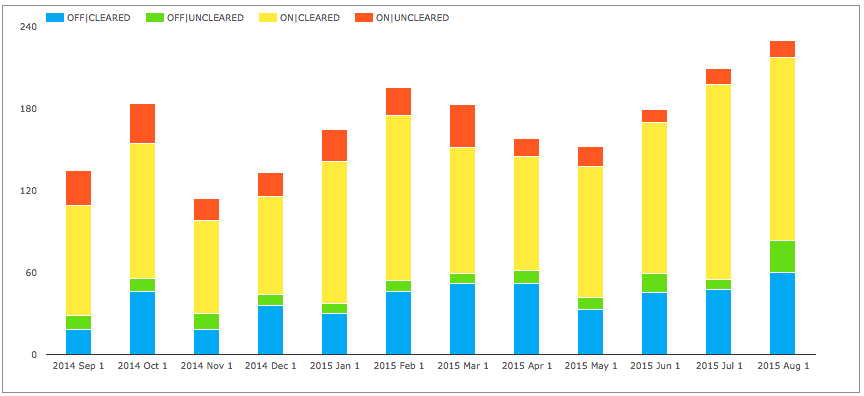
Showing that:
- Increasing volume in the last 3 months
- With a Peak in Aug of > $230 billion
- Low point in Nov with > $114 billion
- Off SEF Cleared averages $40b a month
- Off SEF Uncleared is $10b
- On SEF Cleared is$100b
- On SEF Uncleared is $19b
- Monthly Average over 1Y is $170b
- Making Aug 2015, 35% higher than the average
Actual Volumes
Now we know that Capped Notional rules means that these volumes are under-stated, so lets split the above figures by how much is Standard (Actual Notional) and how much Capped.

Showing that:
- Significant amounts are capped
- Aug 2015 Off SEF has $30b Capped vs $53b Standard
- Aug 2015 On SEF has $30b Capped vs $117b Standard
- The Off SEF Capped portion each month is much higher than the On SEF one
Is it possible for us to get a better estimate of the actual Notional traded?
Yes using SEFView, we know that $172 billion traded On SEF in Aug vs the $147 billion shown in SDR.
This is equivalent to saying that the $30b of Capped Notional was actually $55b of Actual notional.
Using the same percentage for Off SEF, would mean increasing the Off SEF Capped $30b to $55b, meaning that a total of $108 billion traded Off SEF as opposed to $83b.
We can then estimate an overall total of $280 billion in Aug 2015, with $108b Off and $172b On SEF.
As the number of trades was 926 in July, we can say the average trade size was $290 million.
Characteristic size of an inter-dealer market.
Types of Basis Swaps
These figures represent two distinct types of Basis Swaps:
- Libor Tenor Basis, e.g. Libor 3m vs Libor 1m
- Libor vs an Index e.g. FedFunds
In SDRView Pro, we are able to look specifically at each of these and their term structure.
Lets start with Libor vs FedFunds, one of the most common types and key instruments in building a FedFunds curve at the long end (recall from my blog on USD OIS Swaps that those only extend out to 1Y).
Spot trades in the month of Aug 2015.
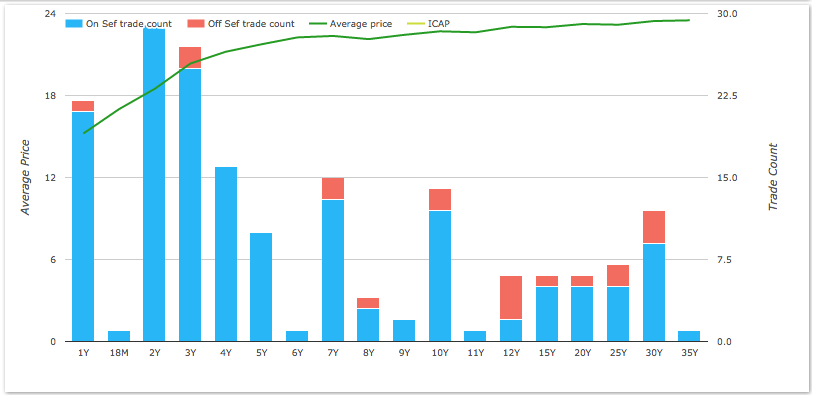
Showing that:
- Many tenors are traded all the way out to 35Y
- 2Y is the most common with 29 trades in the month
- 10Y has 14 and 30Y 12 trades
- So not a daily trading frequency but weekly
- (Note the price range for 30Y is just 23.25bps to 24.25bps over the month)
The overall volume is 180 trades or $30b gross notional in Aug 2015.
Or 20% by trade and 13% by notional of the total USD Basis Swap volume in the month.
Libor Tenor Basis
Next lets look at the Libor tenor basis swaps, of which the two most prevalent are 1m vs 3m and 3m vs 6m, both of which are important curve instruments for building Libor Basis curves.
First spot starting 1m vs 3m.
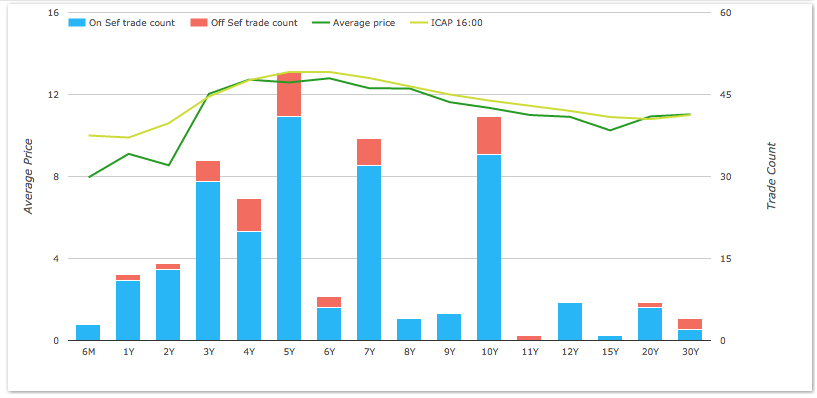
Showing that:
- Many tenors are traded all the way out to 30Y
- 5Y is the most common with 49 trades in the month
- 10Y has 41 trades
- So not quite a daily trading frequency but weekly
- (Note the price range for 10Y is just 10.5bps to 11.625bps over the month)
The overall volume is 252 trades or $39b gross notional in Aug 2015.
Or 27% by trade and 17% by notional of the total USD Basis Swap volume in the month.
Next spot starting 3m vs 6m.
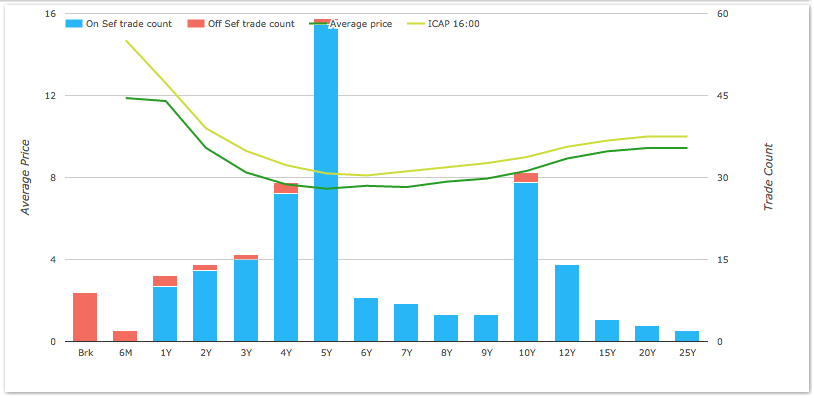
Showing that:
- Many tenors are traded all the way out to 25Y
- 5Y is the most common with 59 trades in the month
- 10Y has 31 trades
- So not quite a daily trading frequency but weekly
The overall volume is 220 trades or $34b gross notional in Aug 2015.
Or 24% by trade and 15% by notional of the total USD Basis Swap volume in the month.
Adding each of these three types of Basis Swaps, we have 652 trades or 70% of the total trade count and 45% of the gross notional.
We could persevere and if we did we would find forward starts e.g. 115 trades on Libor 3m vs 6m and $77b notional.
But while the mind is willing the flesh is weak, so will leave you to do that yourself.
Onward.
SEF Market Share
Lets now use SEFView to see which platform has the most liquidity.
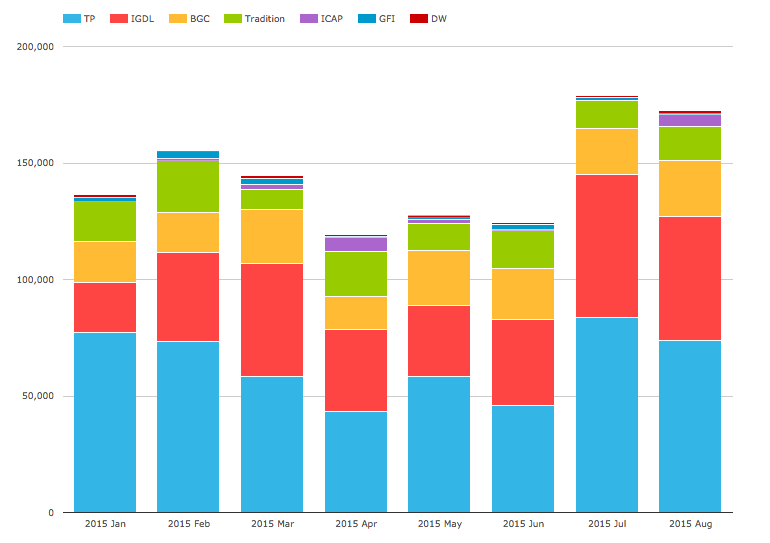
Showing that:
- Tullets is the runaway leader with 44% YTD
- ICAP is second with 30%
- BGC is third with 14%
- Tradition next with 11%
- GFI and DW each with 1%
- Some variability in share each month
- e.g. Tullets as high as 57% and as low as 37%
- But no clear trend in terms of change in share
- July 2015 was the highest volume month, just above Aug 2015
Global Basis Swap Volume vs US
So far we have been looking specifically at US persons volume reported to US SDRs and SEFs.
A question of interest is how much of the market is outside the US?
Using CCPView we can get an estimate. Lets start by looking at Cleared USD Basis Swap volume.
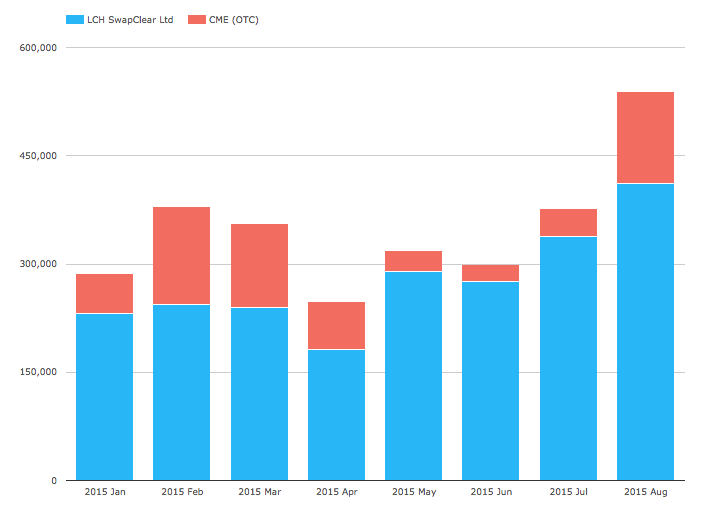
Showing that:
- $540 billion was reported in August
- The highest month in 2015
- With LCH SwapClear having the vast majority (79% YTD)
For US SDR we know that Aug Cleared as $194b and allowing for Capped Notional we estimate the Actual to be $236 billion.
So Cleared USD Basis Swap in SDR or SEF, represent 44% of the Global Cleared market.
Different from the 30% we observed in OIS Swaps and the 50%-60% in USD IRS
Thats it for today
It will be interesting to see how volumes develop.
Will the uptick in volumes in July and August carry into September and October?
Come back and see for yourself in SDRView, SEFView or CCPView.