- SOFR vs FF Basis Swaps, a new high in Sep-19 of $19 billion
- SOFR Outright Swaps, less trades and notional than Aug-19
- SOFR Swaps were mostly Off SEF and Cleared
- For On SEF, tpSEF reported the most trades
- Oct-19 volumes are shaping up to exceed Sep-19
- LCH SwapClear reported $45 billion notional in Sep-19
- Clarus Data Products provide insight into SOFR Swaps activity
SDRView Email Alerts
SOFR Swaps trading has picked up to the point that we added a new feature to our email alerts, one that sets an optional delay time e.g. 30 mins, so that reported trades get consolidated into fewer emails.
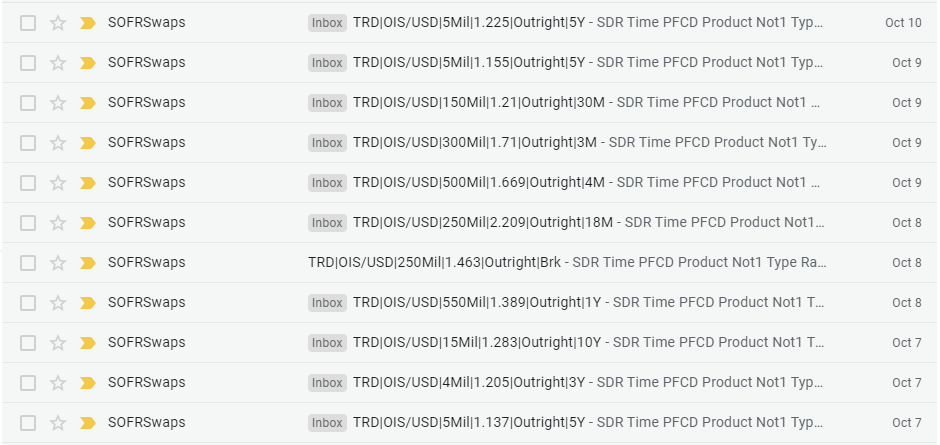
SDRView sends email alerts to my inbox every time a SOFR trade is transacted.
Monthly Volumes in 2019
Using SDRView Researcher we can can compare monthly volumes for 2019.
First, SOFR Swaps by trade count, split by Outright or Basis trade types.
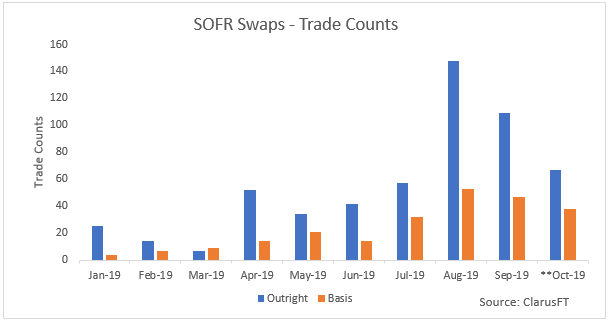
- Showing Sep-19 trade counts are down from the high in Aug-19, but well above prior months
- Sep-19 with 105 Outright (SOFR vs Fixed) trade, down from 146 in Aug-19
- And 67 trades so far in Oct-19 (up to October 11 inclusive)
- Sep-19 with 47 Basis (SOFR vs FedFunds) trades, similar to the 53 in Aug-19
- And 38 so far in Oct-19, shaping up to be a new high month
Next, SOFR activity by gross notional, split by Outright or Basis trade type:
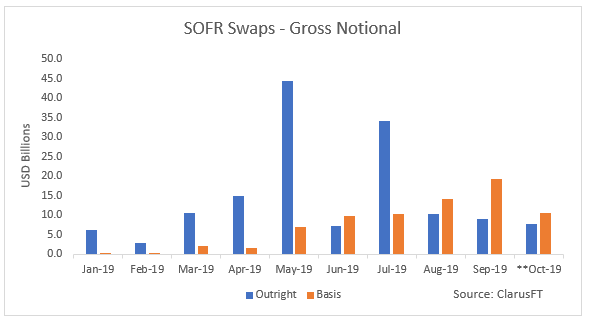
- Sep-19 with $19 billion of Basis Swaps, a new high from Aug-19 with $14 billion
- Gross notional of Outright Swaps in Sep-19 of $9 billion, is below prior months
- Well below the May-19 and Jul-19 highs of $44b and $34b
So some way to go for gross notional volumes and no sign of the jump in volumes that I noted in my article on CME SOFR Futures in September.
Volumes in Sep-19
Using SDRView Professional we can look at the trades in Sep-19 in more detail.
First the Outright SOFR Swaps.
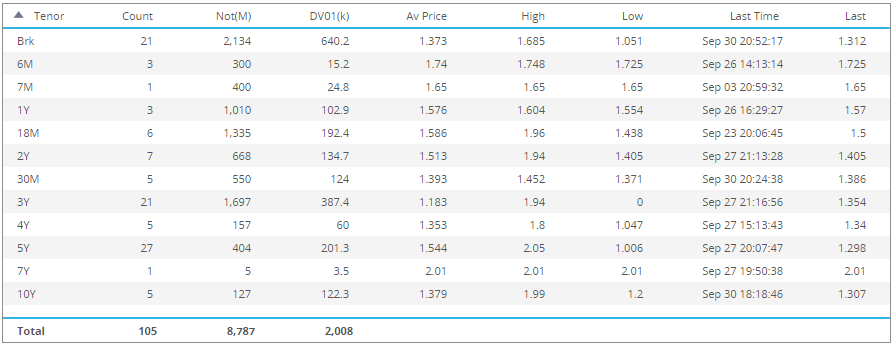
- Showing 105 trades, 8 On SEF and 97 Off SEF, of which 26 were Uncleared and 79 Cleared
- 5Y is the most common tenor with 27 trades
- 3Y the highest DV01 tenor with $390k
As mentioned in an earlier blog on this topic, we can assume that customer activity is in Outrights and so we would expect at some point most of this volume will move to Bloomberg and Tradeweb SEFs.
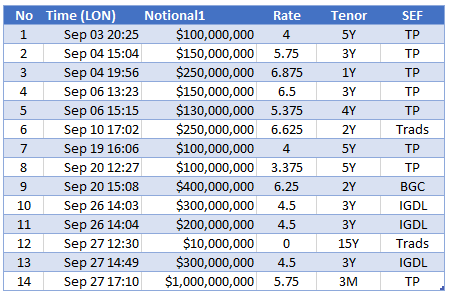
Next Basis Swaps in more detail, first On SEF and then Off SEF.
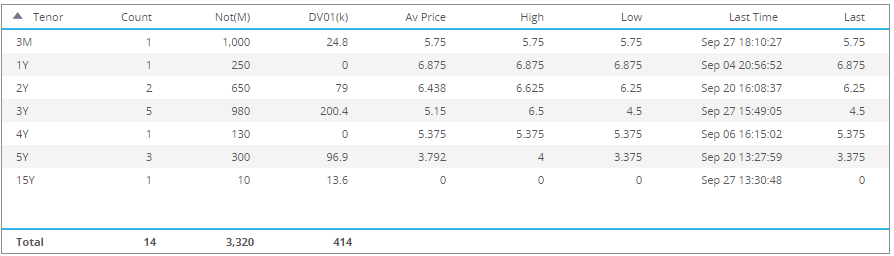
- Showing 14 On SEF and Cleared trades
- 3Y the most common tenor with 5 trades and $980 million notional and a last price of 4.5 bps
- A single 15Y trades of $10 million and flat spread to FedFunds
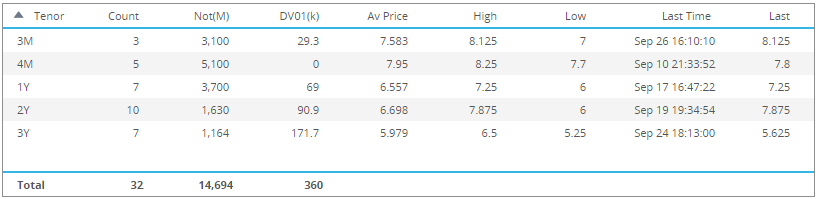
- Showing 32 trades Off SEF, of which 5 are Uncleared
- 2Y the most common tenor with 10 trades, though not much in it as 1Y and 3Y each have 7 trades.
I am not sure why the Off SEF notional is much higher than On SEF in but again would expect this to eventually move to mostly On SEF.
SEF Trading in Sep-19
Using SEFView we can work out which SEF the SOFR Basis Swaps were executed on.
- Showing Tullets (tpSEF) with the most trades, 8 in Sep-19, which is down from the 20 in Aug-19
- Tradition with 2 trades, down from 15 in Aug-19
- IGDL with 3 trades, up from 1 in Aug-19
- BGC with a trade, up from 0 in Aug-19
It will be interesting to see how competition between the D2D SEFs for SOFR Swaps develops and will it end up with similar share to that in USD Libor Swaps?
CCPView
Using CCPView, we can isolate global cleared volumes and we now have specific view for SOFR Swaps.
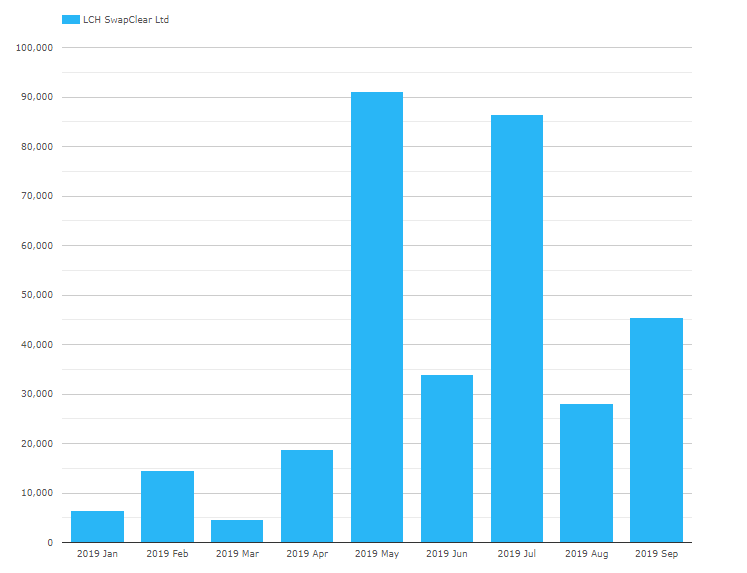
Showing LCH SwapClear reported $45 billion gross notional (single-sided) in Sep-19, up from Aug-19 and down from Jul-19.
If I add up the SDR Basis total of $19b and Outright of $9b (shown in monthly volumes section above), I get a total of $28 billion, so some way short of $ 45 billion.
Now some of the difference could be due to capped trade rules in SDR not showing the full notional for large trades. The difference of $17 billion implies a 60% understatement, on the high side, given our prior research shows that for USD Libor Swaps, 30% is a reasonable estimate of the understatement. But it could be plausibly be entirely from this fact or there could possibly be some trades not reported to US SDRs and instead reported in Europe or elsewhere.
Given the importance of tracking trade volumes in RFR, it is a great shame that transparency in Europe, from either Trade repositories or Trading Venues or MiFID APAs, is sorely lacking in this regard.
That’s it for today.
It will be interesting to see how October volumes develop.
Please contact us for a demo of our Data products.