Following on from my recent Supplementary Leverage Ratio: Comparing US Banks article I wanted to look at Capital Ratios and Risk Weighted Assets (RWAs) published by the six largest US banks.
Background
One of the lessons learned from the Great Financial Crisis (GFC) was that Banks were generally under-capitalised for the risks they were exposed, leading to new Basel III regulations requiring increases in both the level and the quality of capital. Capital regulations specify the minimum amount of capital as a percentage of risk weighted assets (RWA).
The table below shows the phase-in timeline for the new Basel III capital regulations.
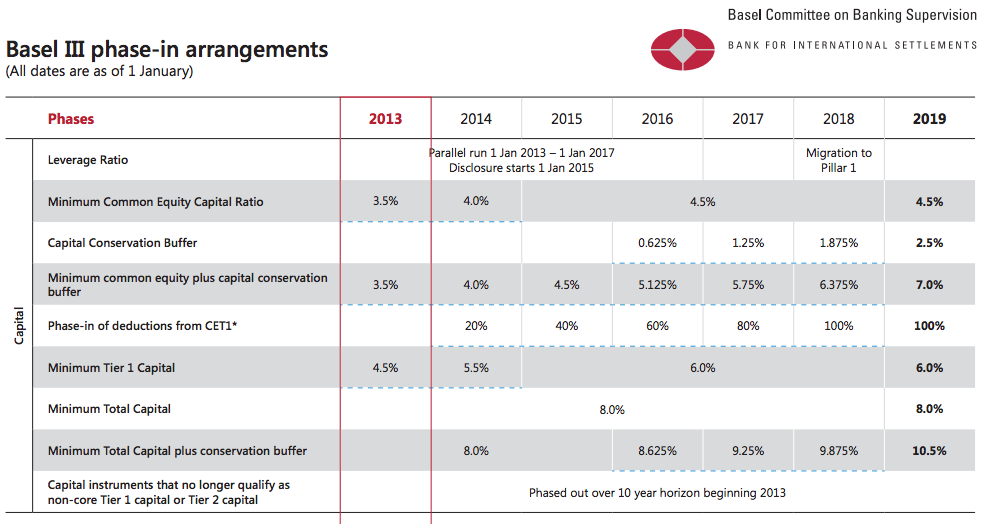
- Minimum Common Equity (CET1) ratio is now 4.5% of RWA
- CET1 + Additional Tier 1 capital gives Total Tier 1 Capital, which is now 6% of RWA
- Tier1 + Tier 2 gives Total Capital, which is now 8% of RWA
- Conservation buffers will take this up to 10.5%
In addition Global Systematically Important Financial Institutions (SIFIs) are required to have additional CET1 ranging from 1% to 2.5% and possibly a further 1% could be applied, meaning minimum CET1 ratios of 7% or minimum Total capital Ratios of 14% are possible for some firms.
Lets look at some data.
Capital Ratio Comparisons
The six largest US banks and their quarterly disclosures from 31 March 2016 to 31 March 2017.
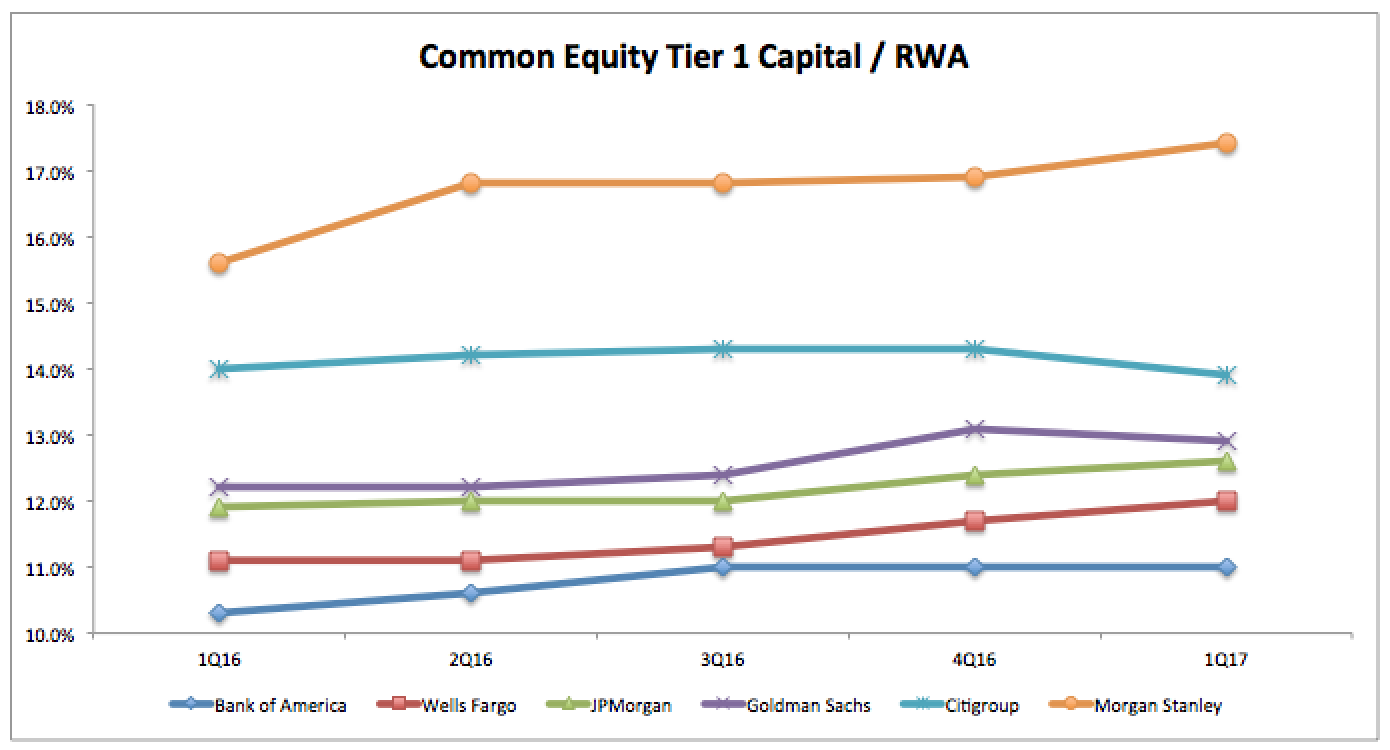
Showing that:
- All have CET1 ratios above 10%, well above the minimum requirements of 4.5% to 7%
- Bank of America’s CET1 ratio has increased from 10.3% to 11% over the year
- Wells Fargo’s CET1 ratio has increased from 11.1% to 12%
- JP Morgan’s CET1 ratio has increased from 11.9% to 12.6%
- Goldman Sach’s CET1 ratio has increased from 12.2% to 12.9%
- Citigroup’s CET1 ratio is down from 14% to 13.9% (though it’s Total Capital ratio is up 0.6%)
- Morgan Stanley’s CET1 ratio has increased from 15.6% to 17.4%
Generally stronger capital ratios over the course of the year and well above regulatory minimums.
Of-course the regulatory minimum ratios are just that minimums and banks will decide on a buffer above that commensurate with their business mix, management policy and share holder views.
Capital Ratios can be increased by either increasing the Capital measure or decreasing the RWA measures and decreased by doing the opposite, so lets look at which of these has happened for the six banks.
Common Equity Tier 1 Capital
Lets look at the Common Equity Tier 1 Capital, which consists of Common Stock and Retained Earnings.
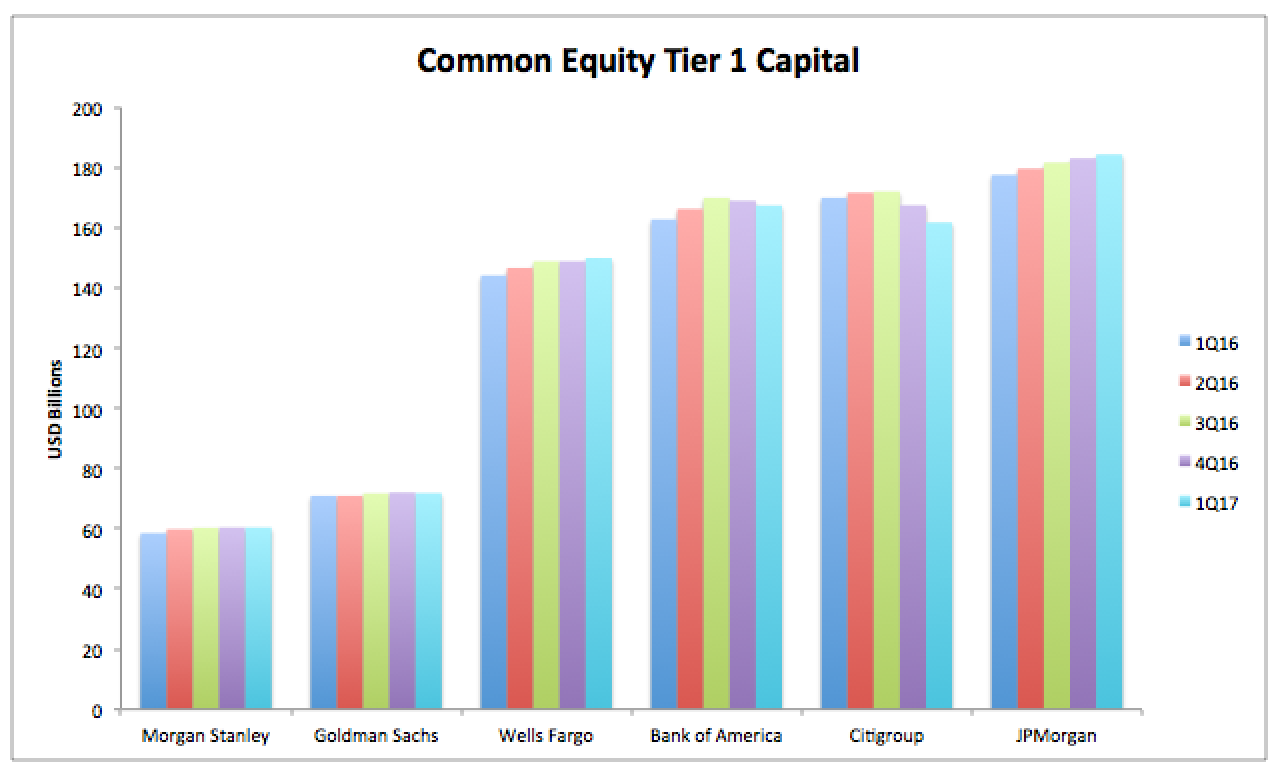
Showing:
- The relative CET1 Capital held by these firms
- Ranging from $60 billion to $184 billion
- Morgan Stanley is up 3.2% in the period, to $60 billion
- Goldman Sachs is up 1.3% to $72 billion
- Wells Fargo is up 4% to $150 billion
- Bank of America is up 2.9% to $167 billion
- Citigroup is down 4.8% to $162 billion
- JP Morgan is up 3.8% to $184 billion
So each firm, except Citigroup has increased CET1 capital and done so largely by higher retained earnings.
Citigroup has lower CET1 capital, but higher Additional Tier 1 Capital and higher Tier 2 Capital, leaving its Total Capital the same at the end of the period.
Risk Weighted Assets
Next lets turn to the denominator of the Capital Ratio; RWA and look at the quarterly trend in these.
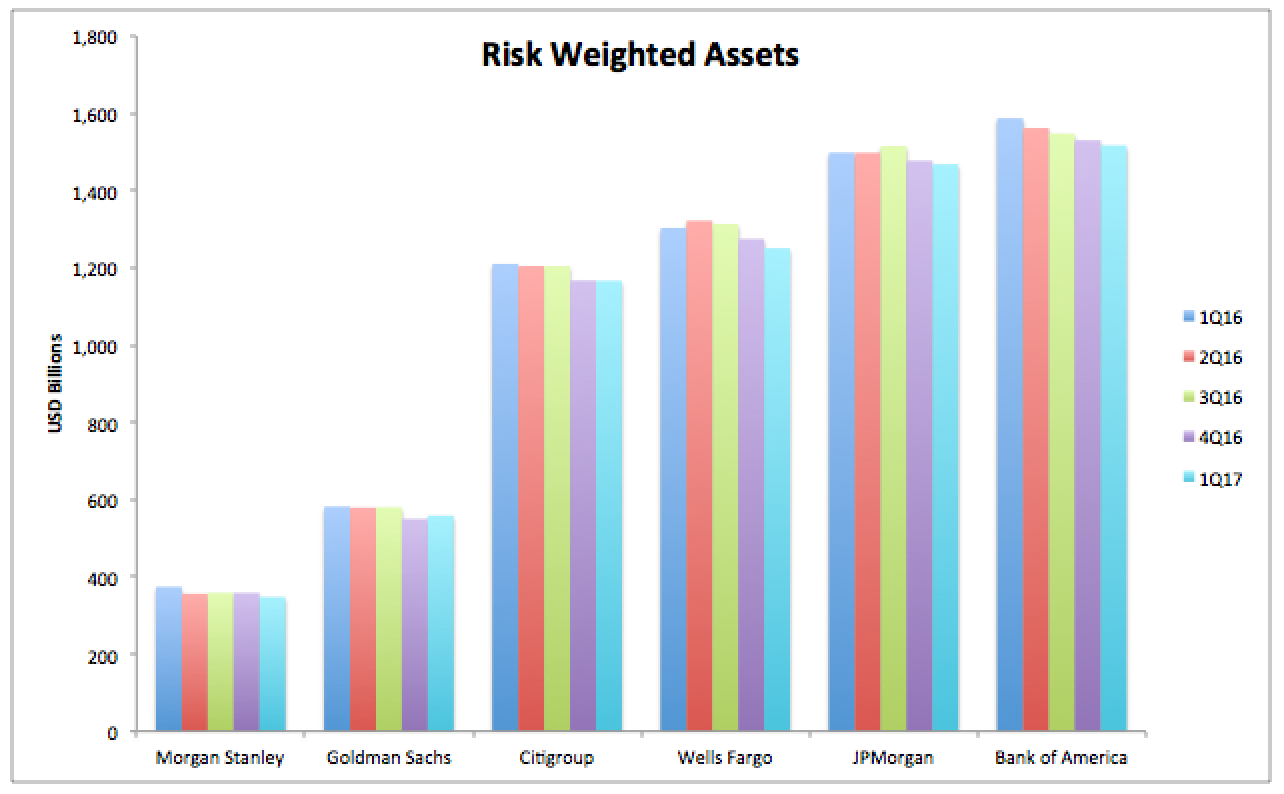
Showing that:
- The RWAs for each of the banks
- Ranging from $350 billion to $1.6 trillion
- Morgan Stanley’s RWA is down 7% to $348 billion
- Goldman Sachs’s RWA is down 4% to $558 billion
- Citigroup’s RWA is down 3.6% to $1,166 billion
- Wells Fargo’s RWA is down 4% to $1,251 billion
- JP Morgan’s RWA is down 2% to $1,468 billion
- Bank of America’s RWA is down 4.4% to $1,517billion
So down across the board and most at Morgan Stanley and Bank of America.
Lets now drill-down further into what makes up these RWAs.
RWA by Risk Type
Taking the latest 31 March 2017 figures, we see the first level breakdown by Credit Risk, Market Risk and Operational Risk.
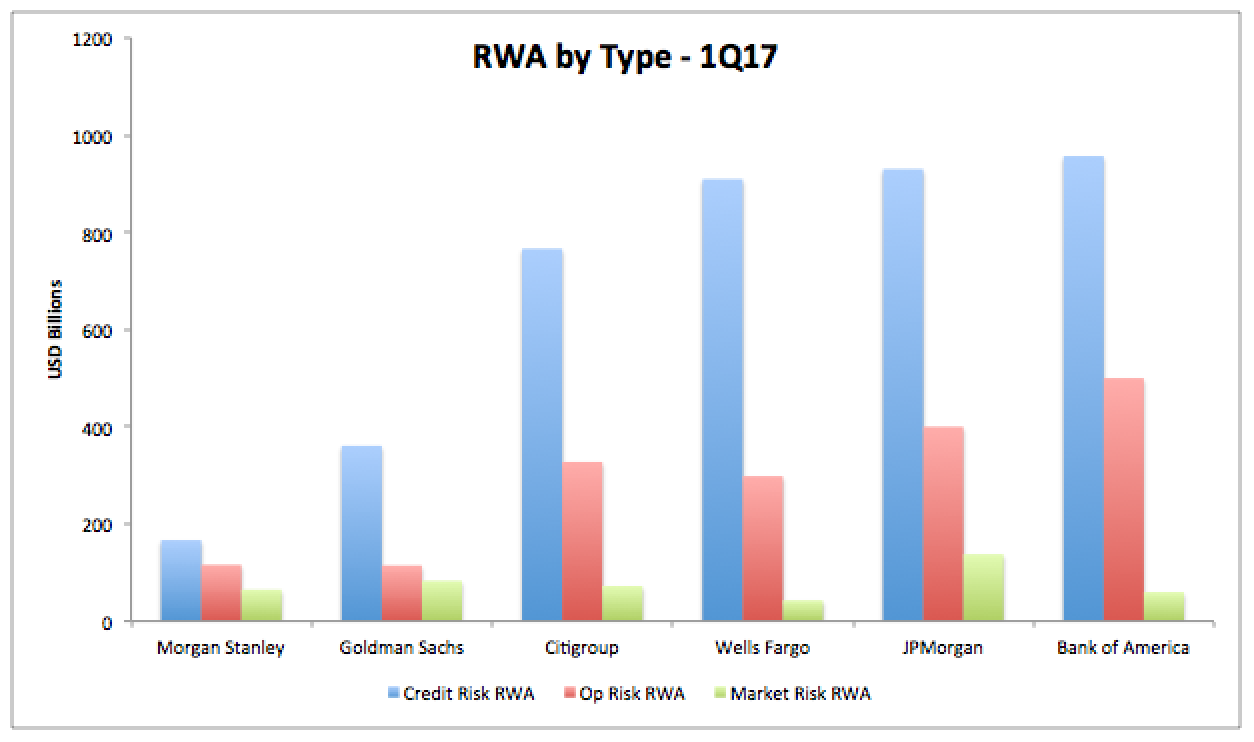
Showing that:
- Credit Risk RWAs are by far the largest
- As we would expect, given that the main business of banks is credit intermediation
- Banks with retail and wholesale lending businesses have particularly large Credit Risk RWAs
- From Citigroup’s $766 billion to $957 billion at Bank of America
- While Banks without such lending businesses have much smaller Credit Risk RWAs
- From Morgan Stanley’s $167 billion to $361 billion at Goldman
- Surprisingly Op Risk RWAs are the next largest and far higher than Market Risk RWAs
- JP Morgan’s Op Risk RWA is $400 billion and Bank of America’s is $500 billion!
- No wonder we have seen much press from JP Morgan on the size of these
- Market Risk RWAs range from Wells Fargo’s $43 billion to $138 billion at JP Morgan
Interesting to say the least.
There is of-course further break-down of these numbers and lets focus on one firm and look at components of these RWAs that arise from Trading businesses.
JP Morgan RWAs
Comparing the RWA detailed breakdown for March 2016 and March 2017.
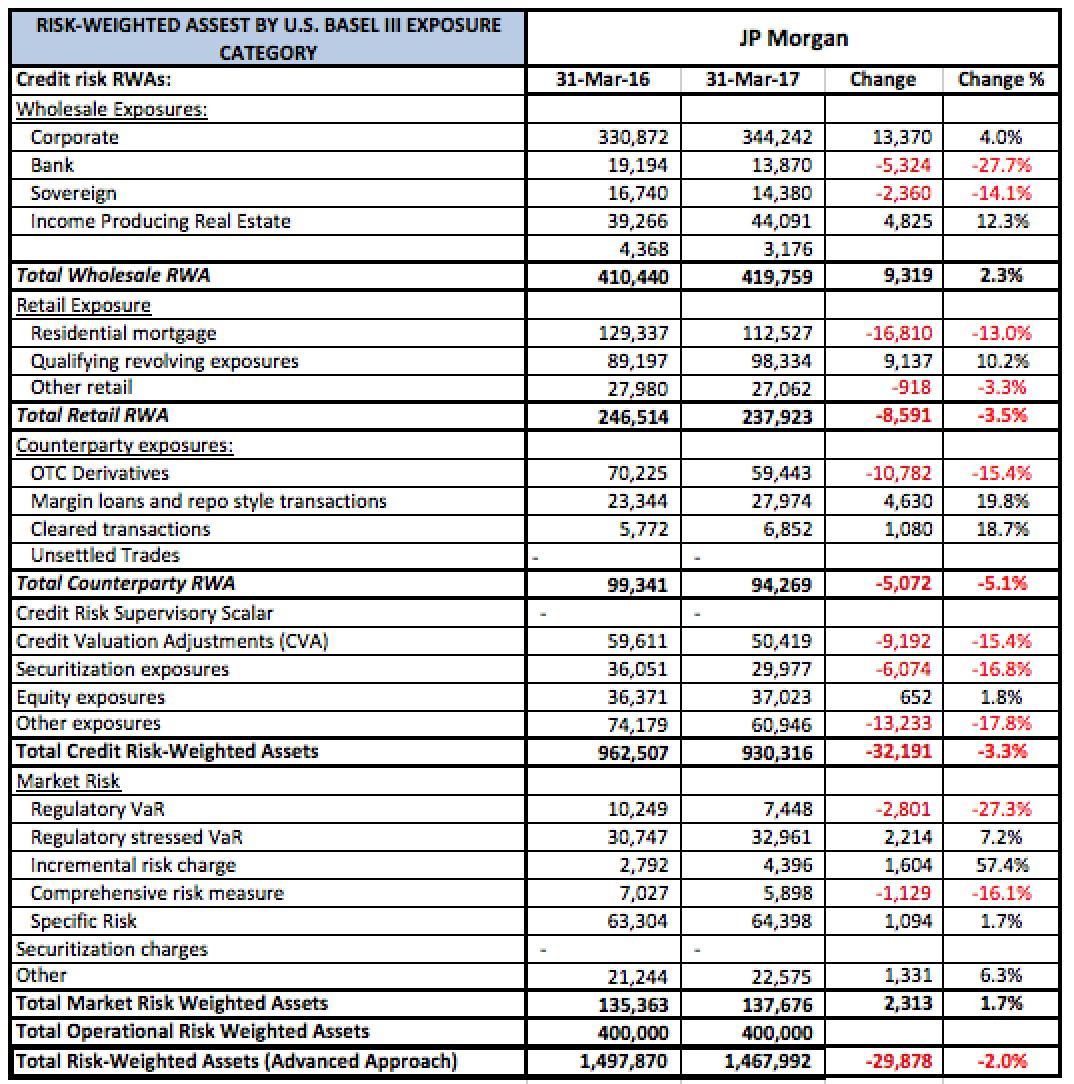
Credit Risk RWA:
- The largest line item is Wholesale Exposures to Corporates at $344 billion
- Not surprising given the size of loans to Corporates
- The next largest is Credit Risk Residential Mortgage at $112 billion, down 13% in the year
- And then focusing specifically on Derivatives and Trading
- Counterparty Exposure of OTC Derivatives is $59 billion, down 15%
- Counterparty Exposure of Margin loans and Repos is $28 billion, up 20%
- Counterparty Exposure of Cleared transactions is $6.9 billion, up 19%
- Credit Valuation Adjustment (CVA) is $50 billion, down 15%
- Securitisation Exposures are $30 billion, down 17%
- Total Credit Risk RWA is $930 billion, down 3%
Market Risk RWA:
- Regulatory VaR is $7.4 billion, down 27% (less risk being taken or calmer markets?)
- Regulatory Stressed VaR, one of the new Basel II.5 measures is $33 billion and greater than 4x VaR
- Incremental Risk Charge is also one of these new measures
- Comprehensive risk measure, also sounds like another
- Showing the scale of the higher Market Risk RWA requirements post the Financial Crisis
- Total Market Risk RWA is $138 billion, up 1.7%
Operational Risk RWA:
- There is no detail available here, just the Total of $400 billion
- Which is nearly half of Credit Risk RWA and three times Market Risk RWA!
- I know very little about Operational Risk RWA, presumably it includes regulatory fines and there have been plenty of those at most large banks
- But given it is a large round number, sounds like a crude approximation and not a quantitative bottom-up measure on observed historical operational risk losses
- Given the size of Op Risk RWA, probably about time I learned more about the details (one for the future)
These numbers are at a JP Morgan group level and not broken about by business line, so the best we can do is have a rough idea on which business line contributes the most to a line e.g. Market Risk RWA will be dominated by a Markets Trading business.
Summary
Basel III disclosures shed light on Capital Ratios, Capital and RWA.
The six largest US banks have Capital Ratios well above the regulatory requirements.
And have gradually increased Capital and reduced RWA over the past year.
Detailed breakdowns of RWA, show the constituents of Credit Risk, Operational Risk and Market Risk RWAs.
The relative size of breakdown items is interesting and sometimes surprising.
It will be interesting to observe trends for the next few quarters in 2017.