Last year we wrote about Capital Ratios and Risk Weighted Assets for Tier 1 US Banks and that blog remains popular to this day. Today I will provide an update using the latest quarterly figures, to see if the trend we observed with US Banks increasing capital and reducing RWA has continued into 2018.
Background
The Basel III accord, which builds on the previous accords Basel I and II, is a set of financial regulations which were initiated after the great financial crisis, which revealed that Banks did not hold sufficient capital as compared to the risks they were exposed to.
Thus, one of the key principles of Basel III includes the increase in Capital Ratios, which is the minimum amount of capital as a percentage of Risk Weighted Assets. The regulation requires an increase in both the quality and quantity of capital.
The changes were mainly:
- Common Equity Tier 1 Capital Ratio up from 2% to 4.5%.
- Tier 1 Capital Ratio increased from 4% to 6%.
- Total Capital Ratio is 8%.
- Additional Capital conservation buffer of 2.5% of CET 1 Capital, intended to be used in times of stress.
- This increases the CET1 Capital Ratio to 7%.
Capital Ratios can be increased by either increasing the Capital measure or decreasing the RWA measures and decreased by doing the opposite, so lets look at which of these has happened for the six Tier-1 US banks.
Common Equity Tier 1 Capital
CET1 capital is a component of Tier 1 capital and consists mainly of Common Stock and Retained Earnings.
It measures Bank solvency and determines a Bank’s capital strength
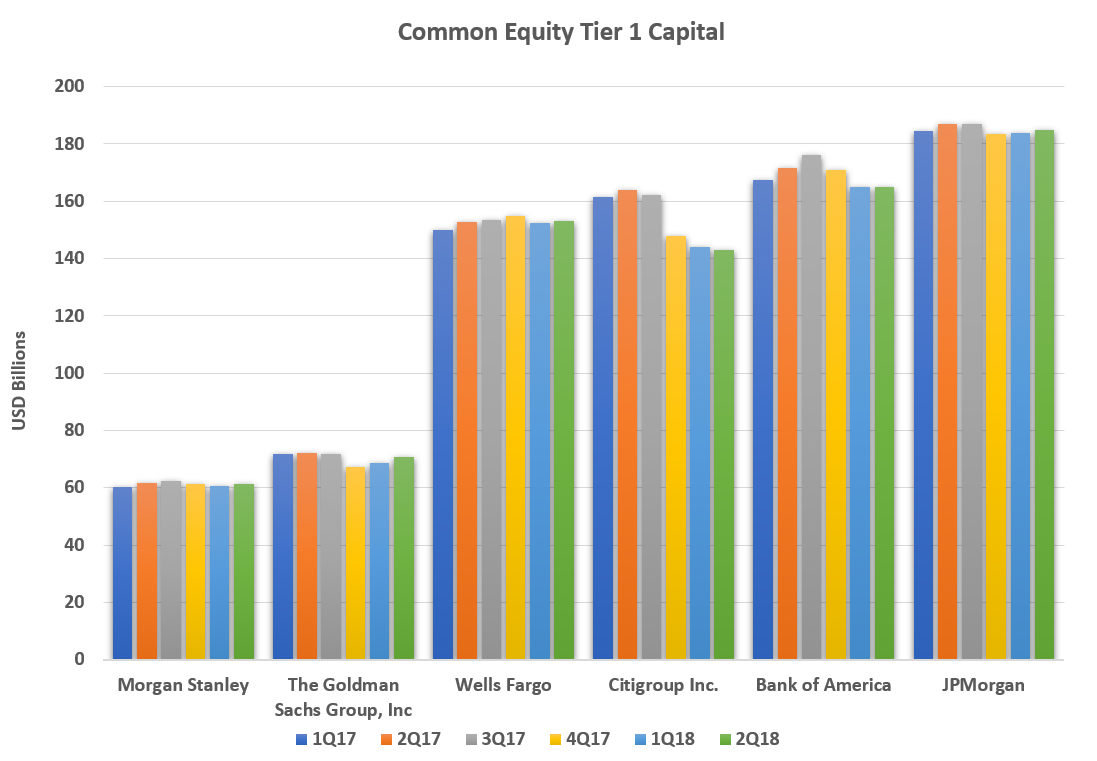
The figure above shows the relative CET1 capital held by these Banks over the last six quarters.
Lets look at how the Banks compare in Common Equity Tier 1 Capital over the period 1Q2017 to 1Q2018:
- Morgan Stanley is up 0.3% over the period, to $60.5 billion
- Goldman Sachs is down 4.5% to $68 billion
- Wells Fargo is up 1.6% to $152 billion
- Bank of America is down 1.5% to $164.8 billion
- Citigroup is down 10.7% to $144 billion
- JP Morgan is down 0.4% to $183.6 billion
The previous Blog observed that CET1 Capital for all Banks except for CitiGroup, over the period 1Q2016 to 1Q2017 had gone up.
It is interesting to see that CET1 Capital has gone down for most of the Banks when comparing 1Q18 to 1Q17, with the largest decline is again by Citigroup, which has gone down from $161 billion to $144 billion.
Only Wells Fargo has increased its CET1 over this period.
For the rest, either there is little change or a material reduction.
Common Equity Tier 1 Ratio
Next, lets look at the Bank’s CET1 Capital to their Risk Weighted Assets.
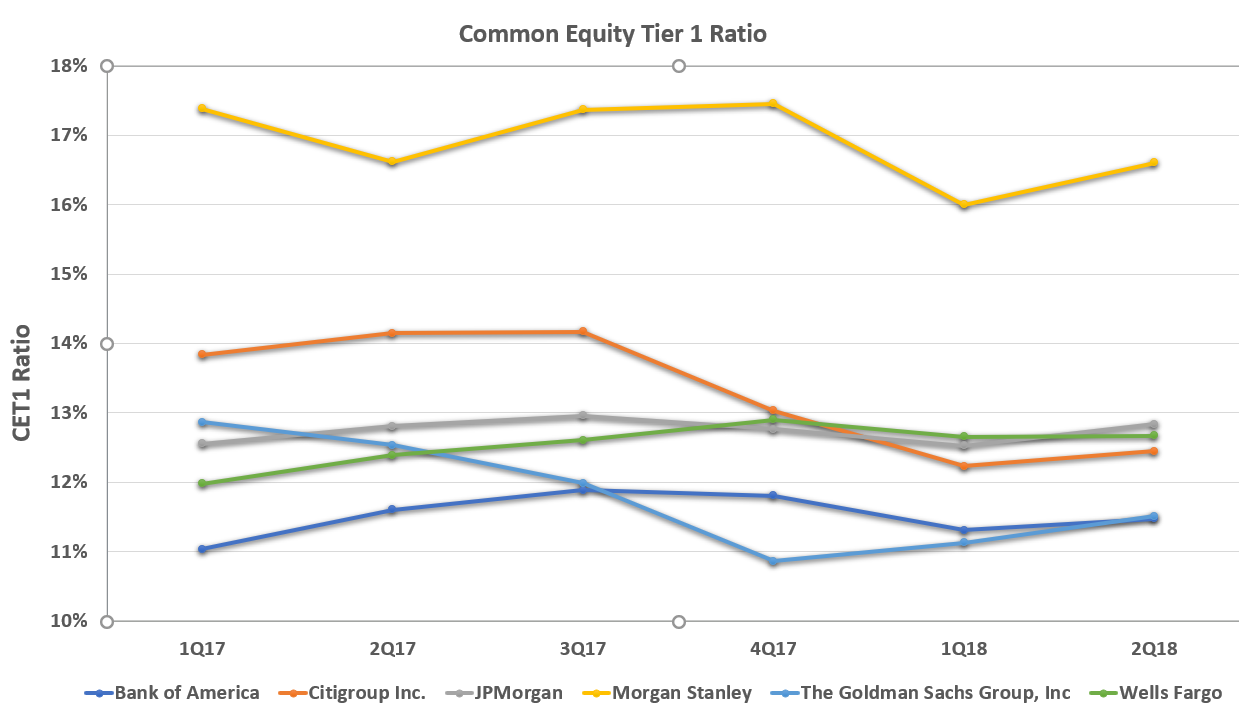
Observing the trend from 1Q17 to 1Q18:
- Bank of America’s CET1 ratio has increased from 11% to 11.3% over the year.
- Wells Fargo’s CET1 ratio has increased from 12% to 12.7%.
- JP Morgan’s CET1 ratio has declined from 12.6% to 12.5%.
- Goldman Sach’s CET1 ratio has declined from 12.9% to 11.1%.
- Citigroup’s CET1 ratio declined from 13.8% to 12.2%.
- Morgan Stanley’s CET1 ratio, while the highest ratio out of all the banks, has declined from 17.4% to 16.0%
While there has been a decline in CET1 Ratios for most Banks over the period, all have CET1 ratios above 10%, well above the minimum requirements of 4.5% to 7%.
Risk Weighted Assets
Next lets turn to Risk Weighted Assets, and look at the quarterly trend in these.
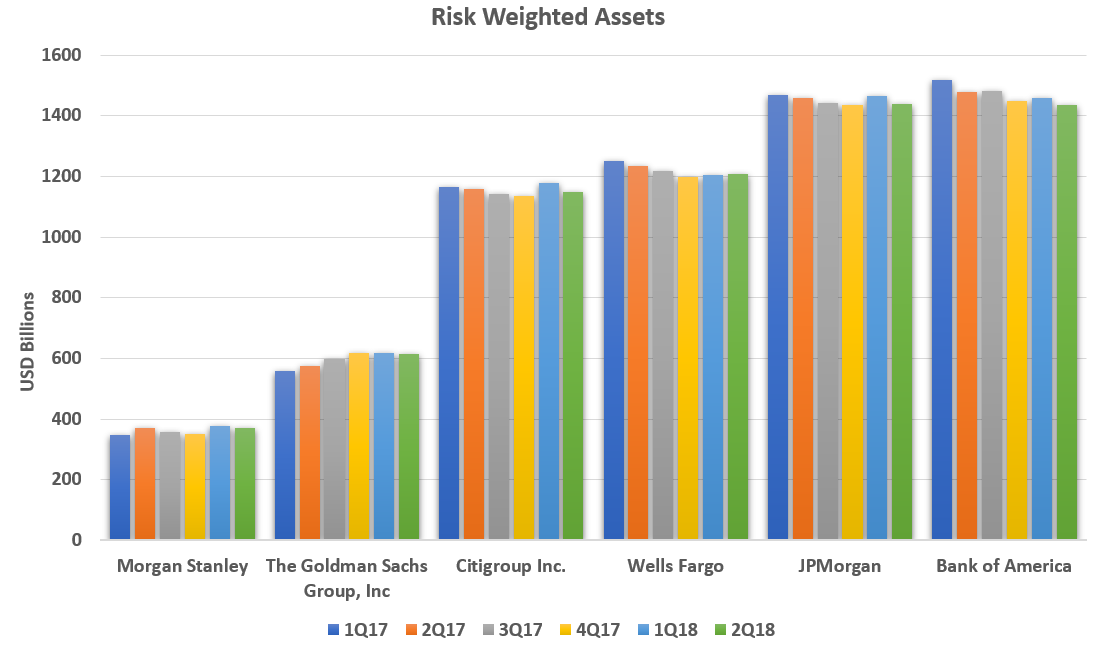
Summarising the trend from 1Q17 to 1Q18:
- RWAs of the Banks range from $347 billion to $1.5 trillion
- Morgan Stanley’s RWA is up 8.9% to $378 billion
- Goldman Sachs’s RWA is up 10.5% to $617 billion
- Citigroup’s RWA is up 1% to $1,178 billion
- Wells Fargo’s RWA is down 4% to $1,203 billion
- JP Morgan’s RWA is down 0.1% to $1,466 billion
- Bank of America’s RWA is down 3.9% to $1,457 billion
So a mixed picture, three of the banks increasing their RWAs and three of them decreasing.
Risk Weighted Asset by Risk Type
Let’s further look at the break down of Risk Weighted Assets, which consists of Credit Risk, Market Risk and Operational Risk.
We will focus on the figures from the 1st Quarter of 2018.
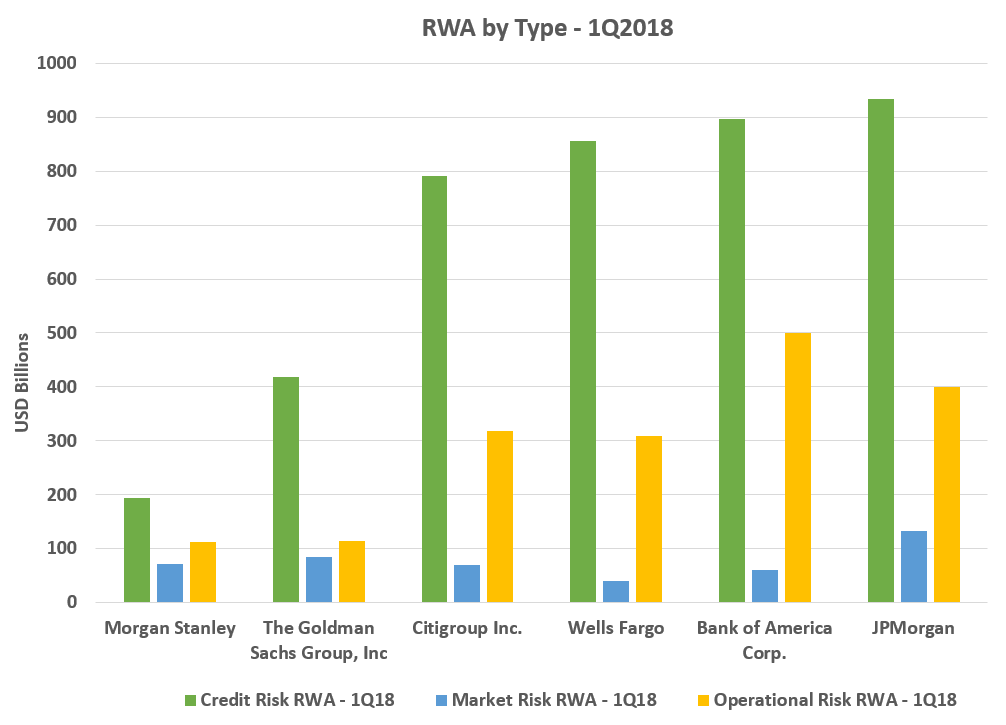
Showing that:
- As expected, Credit Risk RWAs are by far the largest at each Bank, specifically those with higher Retail and Wholesale lending businesses.
- JPMorgan’s Credit Risk RWAs is at highest at $934 billion followed by Bank of America at $897 billion.
- Operational Risk RWAs are the second largest at each Bank.
- Bank of America’s Op Risk is highest at $500 billion JPMorgan’s $387 billion
- Market Risk RWAs range from Wells Fargo’s $39.6 billion to $132 billion at JPMorgan.
Bank of America RWAs
The below table shows a breakdown of RWAs of Bank of America and how they compare between March 2017 and March 2018.
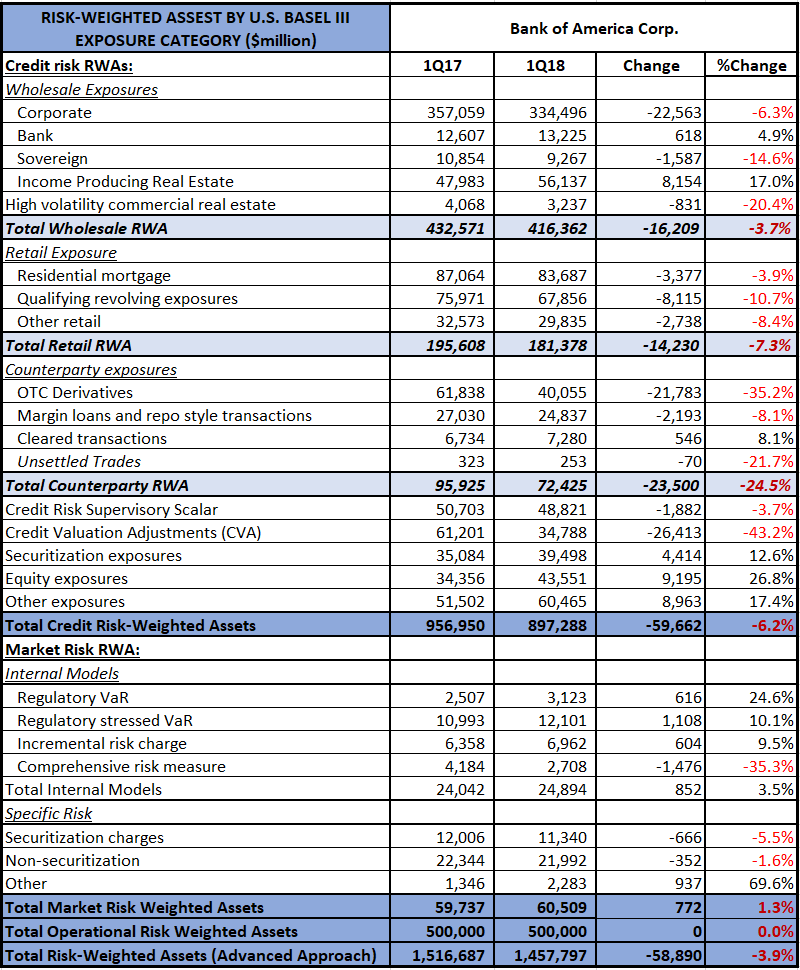
The above figures are at a Bank of America group level.
Credit Risk RWA:
- Under Credit RWAs, the largest line item is Wholesale Exposures to Corporate at $357 billion.
- This corporate exposure has declined over the year by 6.3%.
- The next largest line item is Residential Mortgage, which has dropped by 3.9% over the period.
- In terms of Counter-party exposure, OTC Derivatives are down by 35.2%!
- Credit Valuation Adjustment (CVA) is down by 43.2%.
- Securitization and Equity exposures are up by 12.6% and 26.8% respectively.
- Total Credit Risk RWA is down by 6.2%.
Market Risk RWA:
- Regulatory VaR is up by 24.6% at $3 billion
- Regulatory Stressed VaR is up by 10.1% at $12bn
- Total Market Risk RWA is up by 1.3%
Operational Risk RWA:
- There is no detail breakdown available, just the Total of $500 billion
Summary
Basel III disclosures shed light on Capital requirements and RWA.
The six largest US banks have Capital Ratios well above the regulatory requirements.
In our previous blog we observed all Banks had increased Capital and reduced RWAs over 2016-17.
For 1Q17 to 1Q18, we see a more mixed picture.
Some banks with lower Capital and higher RWA, leading to lower Capital Ratios.
Others with little change from 2016.