It is a year since we last looked at the Capital and RWA of European banks, so today I will look at what the past year’s data shows.
Background
One of the lessons learned from the Great Financial Crisis was that Banks were under capitalised commensurate to their risk exposure; leading to new Basel III regulations increasing both the amount and the quality of capital required.
Basel III is has 3 main components, also called the three Pillars of Basel III. These are, Minimum Capital Requirement, Supervisory Review process and Market Discipline.
The key principle is to have Banks increase their Capital Ratios, which is measured by the minimum amount of capital that they hold as compared to their Risk Weighted Assets.
The changes were mainly:
- Common Equity Tier 1 Capital Ratio up from 2% to 4.5%.
- Tier 1 Capital Ratio increased from 4% to 6%.
- Total Capital Ratio is 8%.
- Additional Capital conservation buffer of 2.5% of CET 1 Capital, intended to be used in times of stress.
- This increases the CET1 Capital Ratio to 7%.
Common Equity Tier 1 Capital Ratio
CET1 Capital Ratio measures the amount of Common Equity Tier 1 Capital held by the Bank as compared to its Risk Weighted Assets.
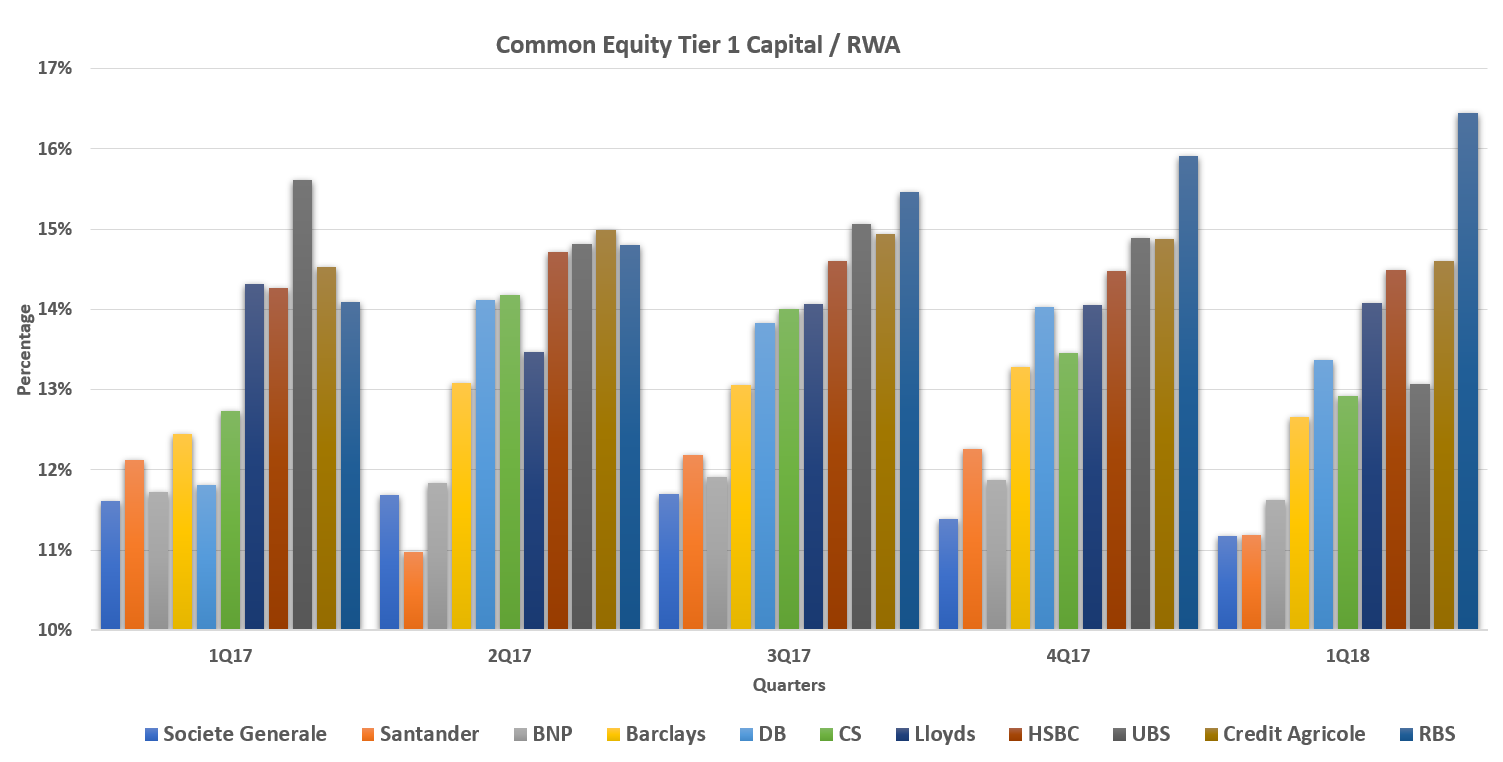
Showing that:
- All have CET1 ratios above 10%, well above the minimum requirements of 4.5% to 7%
- Ranging between approximately 11% to 16.5% over the period.
- UBS has had the largest decline in CET1 Ratio, falling from 15.6% to 13%, with sharp declines from 1Q17 to 2Q17 and 4Q17 to 1Q18.
- Followed by Santander with a decline in CET1 Ratio from 12.1% to 11.2%.
- Societe Generale’s CET1 Ratio has also declined from 11.6% to 11.2%
- Royal Bank of Scotland has had the largest increase in CET1 ratio, increasing from 14.1% to 16.4%.
- Deutsche Bank’s CET1 Ratio, increased from 11.8% to 13.4%.
- HSBC’s CET1 Ratio has increased from 14.3% to 14.5%.
The trend in CET1 ratio over the period show a very mixed picture. UBS’s CET1 has declined the most. On the other hand, RBS’s CET1 ratio has been increasing every quarter and has increased by 2.35% over the period.
Capital Ratios can be increased by either increasing the Capital measure or decreasing the RWA measures and decreased by doing the opposite, so lets look at which of these has happened for some of these Banks..
Common Equity Tier 1 Capital
CET1 capital is a component of Tier 1 capital and consists mainly of Common Stock and Retained Earnings. It measures a Bank’s capital strength.
The Bar chart below shows the trend in Common Equity Tier 1 capital of the top Banks on a Quarterly basis over the past year.
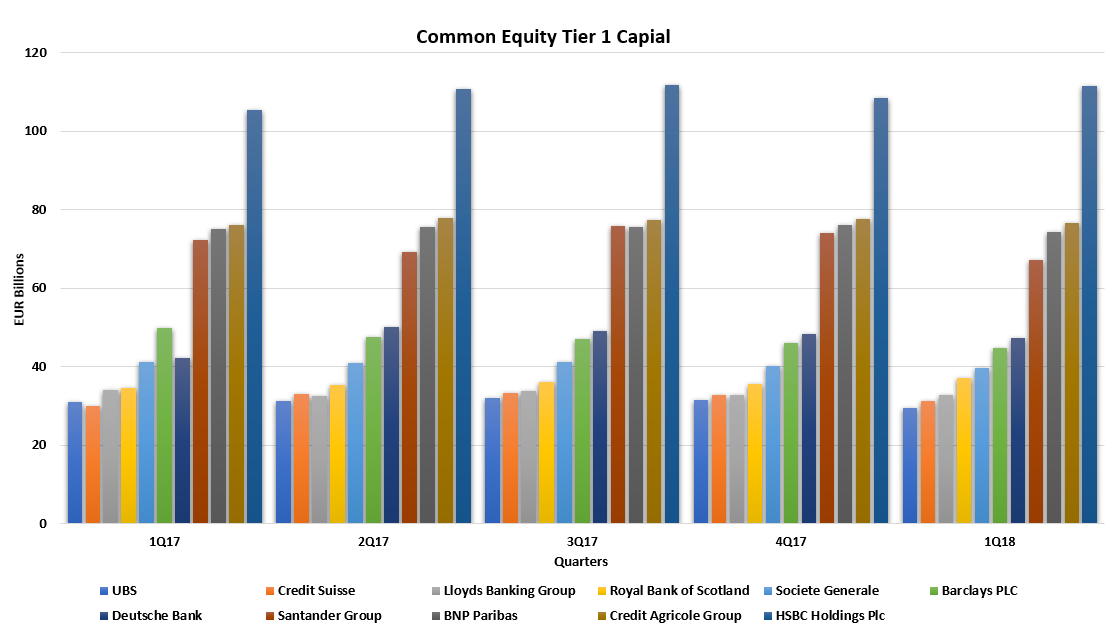
Showing:
- Barclays is down from €49.8 billion to €44.6 billion.
- Santander is down from €72.3 billion to €67.1 billion.
- UBS shows a slight decline from €31 billion to €29 billion.
- Royal Bank of Scotland is up from €34.7 billion to €37 billion.
- HSBC is up from €105.2 billion to €111.5 billion.
- Deutsche Bank is up from €42.2 billion to €47.3 billion.
HSBC Holdings has by far the largest CET1 Capital, followed by Credit Agricole, BNP Paribas and Santander Group.
Risk Weighted Assets
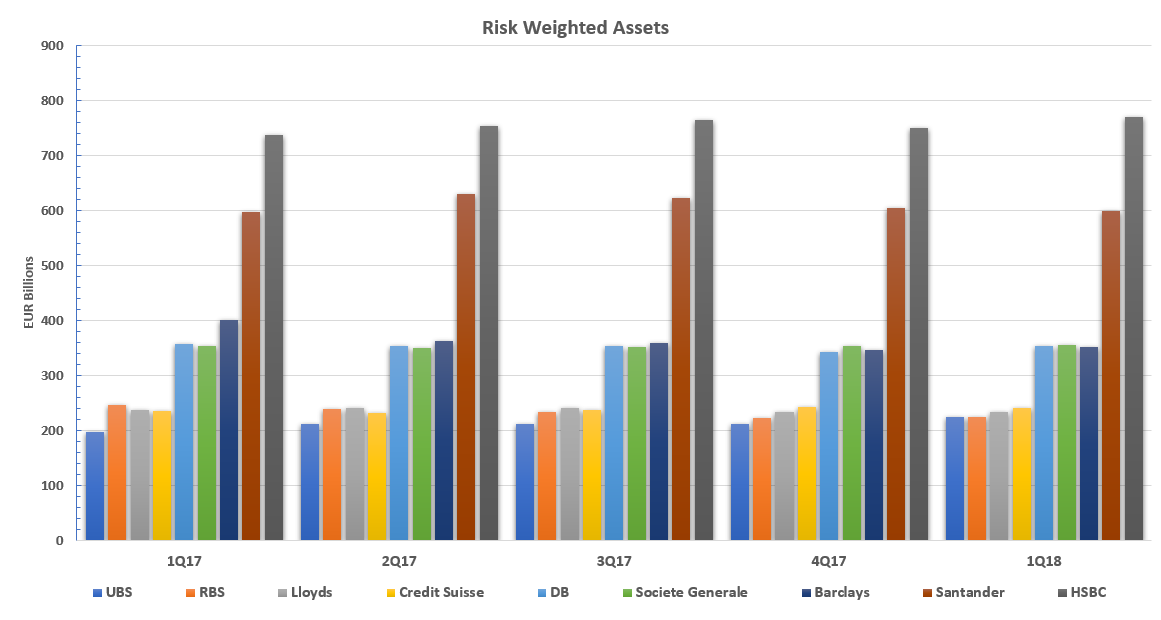
Showing:
- Ranging from €198 billion at UBS to €769 billion at HSBC.
- UBS’s RWAs are up by 13.7%, from €198 billion to €226 billion.
- HSBC’s RWAs are up by 4.25% from €738 billion to €769 billion.
- Credit Suisse’s RWA are up by 2.14% from €236 billion to €241 billion.
- Societe Generale is up by 0.52% from €353.8 billion to €355.6 billion.
- Santander is up by 0.51%, from €597 billion to €600 billion.
- Barclays has had the largest decline in RWAs by 12%, from €400 billion to €353 billion.
- RBS has had the second largest decline of 8.6%, from €246 billion to €225 billion.
- Deutsche Bank’s RWAs have declined by 0.72% from €357 billion to €354 billion.
- Lloyds has declined by 1.5%.
A mixed picture, with UBS showing the highest increase in RWAs while Barclays and RBS show the largest decline in RWAs over the period, most likely due to GBP weakness.
We can now see that the higher Capital Ratios are mostly due to a reduction in RWAs and vice versa.
In the first chart above which shows the trend in CET1 Ratio, we saw that UBS had the largest decline in CET1 Ratio, we can now see that this was mostly due its increase in RWAs.
Similarly, RBS’s increase in its CET1 Ratio is partly due to its decline in RWAs.
Lets now drill-down further into what makes up these RWAs.
Risk Weighted Assets by Type

Showing:
- Credit Risk RWA are as expected the largest, given that the main business of Banks is lending.
- Followed by Operational Risk RWA and Market Risk RWA.
- HSBC and Santander have the highest Credit Risk RWA, mainly due to their higher retail and wholesale lending businesses.
- HSBC’s Credit Risk RWA is at €652 billion while Santander is at €514 billion.
- UBS, Credit Suisse and Deutsche Bank have relatively higher Operational Risks relative to their total RWAs, as compared to the other Banks.
- UBS’s Operational RWA is 31.3% of its RWA!
- Deutsche Bank’s Operational Risk RWA is the highest out of all he Banks, at €93 billion, followed by HSBC at €79.7 billion and UBS at €70.7 billion.
- HSBC also has the highest Market Risk RWA, followed by Barclays and Deutsche Bank.
Summary
Basel III disclosures shed light on Capital requirements and RWA.
The largest European Banks all have Capital Ratios well above the regulatory requirements.
In our previous blog we observed all Banks had increased Capital and reduced RWAs over 2016-17.
For 1Q17 to 1Q18, we see a more mixed picture.
Some banks with lower Capital and higher RWA, leading to lower Capital Ratios.
Specifically the larger increase in RWAs has lead to lower Capital Ratios for some Banks.
It will be interesting to observe the trend in the next few quarters.