Clearing Houses 3Q 2019 CPMI-IOSCO Quantitative Disclosures are now available, so lets look at what the data shows, similar to my CCP Disclosures 2Q 2019 article. Summary:
- Initial Margin for IRS is up 17% in the quarter and 45% in a year
- Each of the four major IRS CCPs increasing IM
- Client IM is significantly up
- IM for ETD up 9% QoQ and 16% YoY
- For the first time our selected IRS and ETD CCPs IM is at a parity of $235 billion
- Skin in the Game (SITG) ratios show a wide variance in CCP capital
- The SITG debate is back on the agenda for CCP Resilience & Recovery
- Some CCPs increased their Default Resources in the quarter
- We recently added Shanghai Futures Exchange
Background
Under the voluntary CPMI-IOSCO Public Quantitative Disclosures, CCPs publish over two hundred quantitative data fields covering margin, default resources, credit risk, collateral, liquidity risk, back-testing and more.
CCPView has 4 years of these quarterly disclosures for thirty-six Clearing Houses, each with multiple Clearing Services, covering the period from 30 Sep 2015 to 30 Sep 2019. This disclosure data provides insights into trends over time at one CCP and comparisons between CCPs.
Initial Margin for IRS
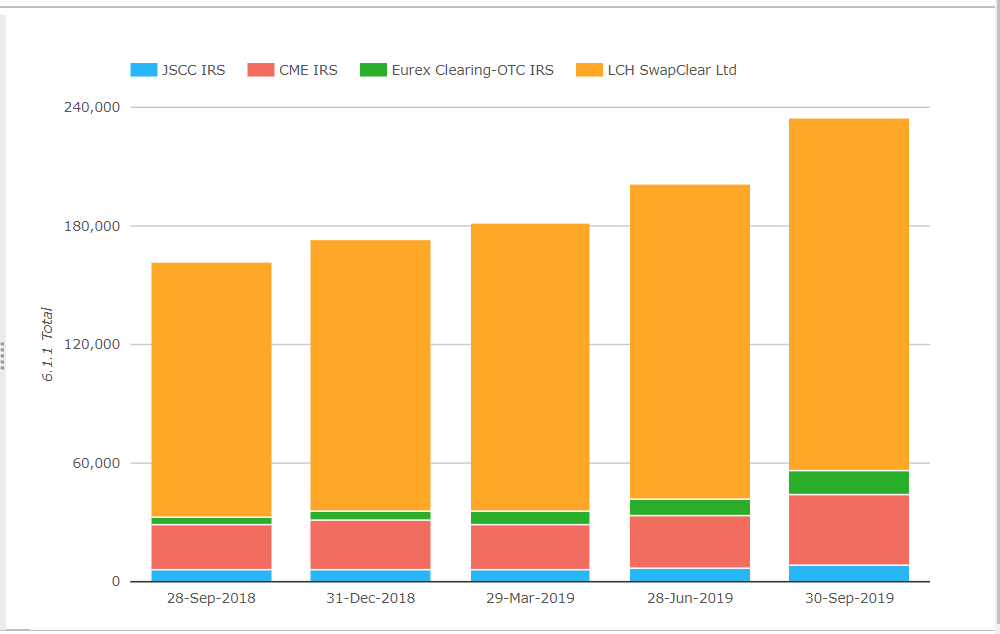
- Total IM for these four CCPs was $235 billion on 30-Sep-2019 up from $201 billion on 28-Jun-2019
- And up from $162 billion on 28-Sep-2018, increases of 17% QoQ and 45% YoY, a big quarter indeed!
- LCH SwapClear with $179 billion IM, up $20 billion or 12% QoQ and up $49 billion or 38% YoY.
- CME IRS with $35.5 billion, up $9 billion or 34% QoQ and up $12 billion or 53% YoY.
- Eurex OTC IRS with $12.5 billion, up $3.8 billion or 43% QoQ and up $9 billion or 250% YoY, increasing even faster than prior quarter growth rates of 34% QoQ and 140% YoY.
- JSCC IRS with $8.3 billion, up $1.5 billion or 21% QoQ and up $2.4 billion or 40% YoY.
For 2Q 2019, we noted that Total IM had increased by the largest amount in a quarter for some time, well that increase has been blown away by 3Q 2019. Every one of these CCPs increasing IM significantly QoQ and YoY, so certainly a quarter with more risk-on positions and higher price volatility, which results in higher margin.
LCH Client IM increased more than House IM and now represents 60% of Total IM. We know there was an LCH IM model change that increased client IM in the quarter, which accounts for some of the growth, but a large part must be due to higher volatility and more risk in positions held.
CME Client IM also with significant increases QoQ, so without doubt it was a very good quarter for FCMS/Clearing Brokers, whose fees are linked to client IM balances.
Initial Margin for CDS
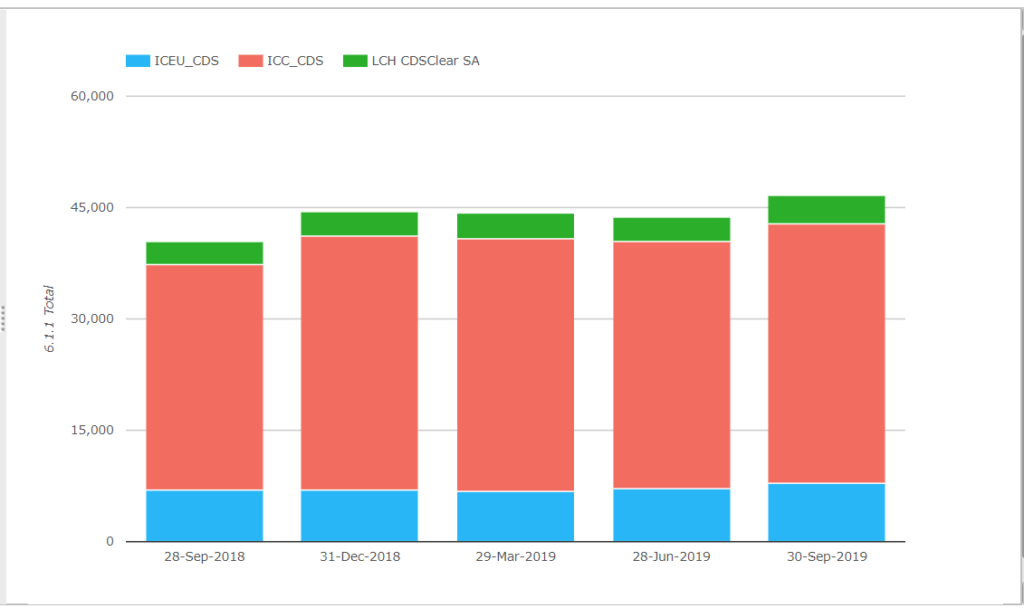
- Total IM was $46.5 billion on 30-Sep-2019, up $2.9 billion or 6% QoQ and up $6.3 billion or 16% YoY
- ICE Credit Clear by far the largest at $34.9 billion, up $1.4 billion or 4% QoQ and up $4.5 billion or 15% YoY.
- ICE Europe Credit next with $7.9 billion, up $800 million or 11% QoQ and up $940 million or 13.5% YoY.
- LCH CDSClear with $3.9 billion, up $600 million or 16% QoQ and up $800 million or 27% YoY.
In 2Q 2019 CDS IM was down or flat QoQ, so the 3Q is a nice contrast with increases at each of the CCPs, however growth rates in cleared credit far lower than in cleared rates.
Initial Margin for ETD
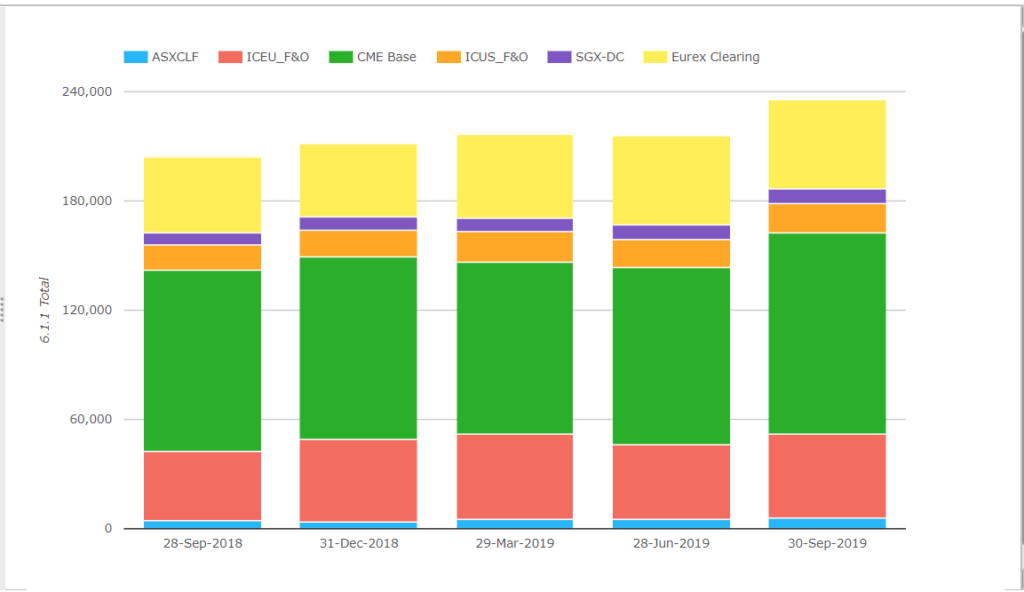
- Total IM was $236 billion on 30-Sep-2019, up $20 billion or 9% QoQ and up $32 billion or 16% in a year
- CME Base is the largest with $110 billion, up $13b or 12% QoQ and up $10.4b or 10% YOY.
- Eurex is next, with $49 billion, flat QoQ and up $7b or 17% YOY.
- ICE Europe F&O with $47 billion, up $5.6b or 12% QoQ and up $9.3b or 25% YOY.
- ICE US F&O $16 billion, up 5% QoQ and 13% YOY.
- SGX-DC $8.4 billion, flat QoQ but up $2.1b or 35% YoY
- ASX CLF $5.5 billion, up 7% QoQ and 19% YoY
So these selected ETD CCPs showing good IM increases across the board, but not as high as the IRS CCPs.
For the first time the total IM of the four major IRS CCPs at $235 billion is neck and neck with the $236 billion of these selected ETD CCPs, which is interesting as a year ago there was a $40 billion difference.
- A case of the market preferring to use Swaps more than Futures?
- Or IRS CCPs being more successful in attracting business.
- Or as old bi-lateral swaps mature, new cleared swaps continuing to provide growth
- Or regulatory drivers and deadlines (Category 3 in Europe).
- Or a divergence in IM methodologies? (Swaps with 5-day or 7-day margin period of risk increasing IM more than the 1-day or 2-day MPOR of Futures).
- More than one of the above …
Topics to consider in detail on another day, but if you have an opinion, please send our way.
Skin in the Game
Next lets turn to the topic of Skin in the Game, one that was big on the conference circuit a few years ago and while it never really went away, an October 2019 paper by nine global financial institutions, “A Path Forward for CCP Resilience, Recovery and Resolution“, has brought the debate back into the open and onto agendas.
While I would encourage you to read the full paper, for today I am interested in the following section:
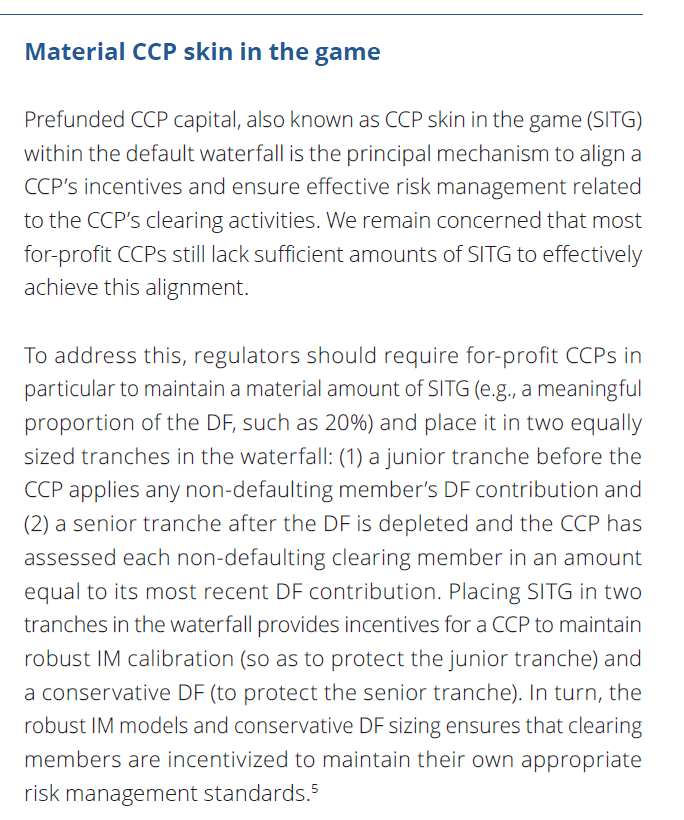
Most interesting, it proposes that for-profit CCPs (which most are these days) should maintain a meaningful amount of SITG e.g. 20% in two equal tranches, before and after the Default fund.
No reasoning is given for the 20% number and I am sure most CCPs would reject a methodology that set’s their contribution as a percentage of the overall default fund, but nevertheless lets look at a few sample SITG ratios from quantitative disclosures data.
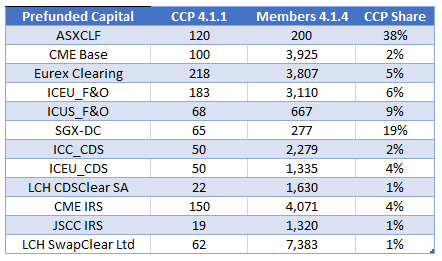
Showing a wide variance indeed of the CCP capital before to member capital (referred to as junior tranche in the paper) with LCH SwapClear, LCH CDSClear and JSCC at 1%, many in the 2-6% range (CME, ICE), ICE US 9%, SGX-DC at 19% and ASX CLF at 38%. So only ICE US F&O close to the 10% proposed in the paper.
ASX in particular stands out with 38% and in addition has more SITG with $150 million of pre-funded own capital alongside the DF, $180 million of pre-funded capital after and $450 million of committed capital.
The only other CCP in our list with pre-funded own capital after DF is SGX-DC with $43 million and the only other CCP with committed own/parent capital is Eurex Clearing with $655 million. Each of the ICE CCPs has Committed – Other, not sure what the other means here, except for not own or parent and Eurex Clearing also has Committed – Other.
We could also calculate other SITG ratios by looking at both prefunded an committed default resources.
CCPView has data for many more CCPs, but even this sample of twelve large CCPs shows a lot of variance, no doubt including others will show even more variance.
Other Disclosures of Interest
There are lots of disclosures for clearing houses and other measures such as margin, default fund, credit risk, liquidity, margin models, back-testing and more; let’s highlight a few from the many CCPs we cover:
- B3 – Estimated largest aggregate stress loss in excess of initial margin caused by the default of any two participants (4.4.7 Peak day Average) was $598 million, much higher than the $269-$321 million range in prior quarters
- DTCC GSD – Cash deposited at central bank (4.3.1) was $4.8 billion, up from $3.85 billion in the prior quarter
- LME – Number of days during the look-back period on which the fall in value during the assumed holding period exceeded the haircut on an asset (5.3.4) was 11, similar to prior quarters and an interesting disclosure that I have not looked at before
- LCH SwapClear – Pre-funded aggregate member contributions to the default fund (4.1.4) increased in the quarter from £5 billion to £6 billion, an unusual 20% increase. Both default resources and IM increasing suggests a more risk-on market.
- OCC – Pre-funded aggregate member contributions to the default fund (4.1.4) increased in the quarter from $9.6 billion to $10.8 billion
- SHFE – Shanghai Futures Exchnage, which we have recently added to CCPView, has Total IM required (6.1.1) of $10.4 billion and Prefunded Own capital (4.1.1) of $600 million
I could go on but after jumping from D to L to O to S, there are so many more clearing services to delve into. The current list is now:
- ASX, ATHEXClear, B3, BME, CCG, CCIL, CCP Austria, CDCC, CFFEX, CME, DTCC, EUREX, EuroCCP, HKEX, ICE Clear Credit, ICE Clear Europe, ICE Clear US, ICE NGX, JSCC, KDPW, Keler, LCH LTD, LCH SA, LME, MGEX, Nasdaq, NCC, Nodal, OCC, OMIClear, SCH, SHFE, SGX, SIX, TAIFEX, TFX.
Surely there must be some with names starting with U, V, W, X, Y, Z, if so we will get to them eventually…
More Disclosures
CCPView has disclosures from thirty six Clearing Houses, each with many Clearing Services, so there is a lot more data to look at covering Equities, Bond, Futures, Options and OTC Derivatives.
With over 200 quantitative data fields and quarterly figures from September 2015 to September 2019, that is a lot of data to analyse.
If you are interested in this data please contact us for a CCPView subscription.
If your firm is not already a subscriber, it would be great for you to become one.
FYI, the Quantitative Disclosures are not “voluntary” for CFTC-regulated SIDCOs and Subpart C DCOs. (C.f., 17 CFR 39.37(a) and Appendix B (i.e., CFTC Regs). Cheers.
Thank you for clarifying.