Clearing Houses have recently published data on the magnitude of margin calls they made in Q1 2020 and these are interesting to say the least. Given the massive price volatility we observed in March across all asset classes, we knew these were going to be big numbers, so let’s dive into the detail.
Variation Margin
Let’s start with the maximum total variation margin paid to the CCP on any business day in the quarter, which is quantitative disclosure 6.7.1 in the CPMI-ISOCO disclosures.
For selected clearing services, we show this disclosure for Q1 2020, the prior high since March 2016 and the quarter of the prior high.
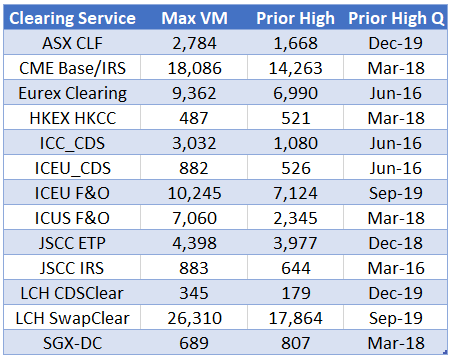
- Almost all of the Clearing Services had a record high of VM paid to them on a single day in the quarter ending March 2020
- LCH SwapClear with the largest VM at $26.3 billion, with the prior high being $17.9 billion in the quarter ending Sep 2019.
- CME Base/IRS, which is both Futures and Swaps with $18.1 billion and the prior high was $14.3 billion in the quarter ending Mar 2018.
- (It is entirely possible that there were other days in 1Q 2020, with higher VM than the prior quarter highs and given what we know about market moves it is likely that was the case for some CCPs, but the disclosure data do not tell us that).
- ICE Europe F&O with $10.2 billion, prior high of $7.1 billion in Sep-19 quarter.
- Eurex Clearing with $9.4 billion, prior high of $7 billion in Jun-16 quarter.
- The only Clearing Services in our list to not exceed their record highs in Q1 2020 were HKEX HKCC and SGX DCC, who both had bigger numbers in the March 2018 quarter.
- For ICE Credit Clear and ICE Clear Europe Credit the prior high quarter was June 2016
While it is unlikely that all these CCPs had the highest VM paid on the same business day, we may as well add up the first column to get a grand total of $84.6 billion. Wow!
This is the worst case and the true number on the largest business day in the quarter is likely to be somewhat lower, but still it gives an idea of the massive flow of cash (VM is always cash) from member firms to CCPs and of-course from CCPs to member firms
And from the price volatility we observed (see Crashing rates) we know that there will have been massive flows on other days too.
A daily back and forth to make sure that if the music stops for one firm, the money is in the appropriate place to minimize and localize the loss.
A process that worked exceptionally well in the most volatile period since the Great Financial Crisis of 2008.
Initial Margin
Next the maximum aggregate initial margin call on any business day in the quarter, which is quantitative disclosure 6.8.1 in the CPMI-ISOCO disclosures.
For selected clearing services, we show this disclosure for Q1 2020, the prior high since March 2016 and the quarter of the prior high.
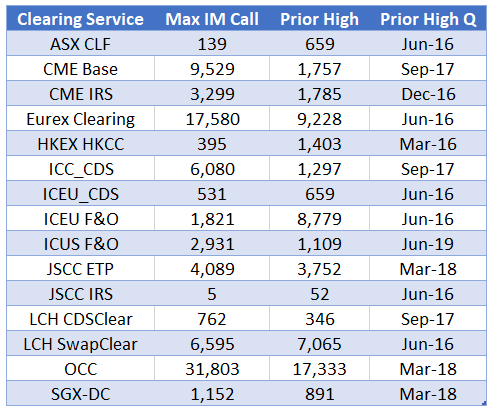
- Again as with VM, almost all the CCPs had a new record high in Q1
- Options Clearing Corporation stands out with $31.8 billion, however before we jump to conclusions recall that I did not have OCC in the VM table. This is because for OCC the 6.7.1 disclosure states “OCC does not separately report variation margin payments”, meaning that the $31.8 billion combines both VM and IM. This brings OCC in line with other comparably sized CCPs such as CME, Eurex and LCH.
- Eurex Clearing at $17.6 billion also stands out but referring to the explanatory notes from Eurex, we see the note “including intraday variation margin calls”, explaining the relatively large size of this number.
- CME Base, the core Futures and Options franchise, is then the largest with $9.6 billion, which is massively higher than it’s prior high of $1.8 billion in the Sep 2017 quarter. Given the moves we have seen in S&P500 (see here) and Crude Oil, two of the largest underlyings at CME, the size of which we have not seen since 2008, it is not surprising that the record high is so much larger.
- LCH SwapClear with $6.6 billion is actually just lower than its record of $7.1 billion in June 2016, the Brexit referendum quarter.
- ICE Clear Europe F&O with $1.8 billion is far lower than the $8.8 billion seen in the same June 2016 Brexit referendum quarter, not surprising given the short sterling contracts cleared there
- ICE Clear Credit with $6 billion is much higher than its prior record of $1.3 billion in the Sep 2017 quarter, again similar to CME Base not surprising given the massive price volatility in the underlyings, in this case CDS Index and Single-names in the quarter.
- The other Clearing Services to not exceed their highs in Q1 are ASX CLF, HKEX HKCC, ICEU CDS, JSCC IRS.
While it is most unlikely that all these CCPs had the highest IM Call on the same business day, we may as well add up the first column to get a grand total of $87 billion, with the caveat that a chunk of this ($20 billion?) is VM not IM.
But even $67 billion is a large worse case. Again like VM, this back and forth of IM between CCPs and member firms and member firms and clients is important to ensure that default losses are minimised.
However the extent of the IM increases is down to the choice of procylicaility of margin i.e. how much should margin increase between low volatile and high volatile periods. And as my article in Risk.Net shows today, the wide variance in IM percentage changes is surprising and warrants further debate discussion.
Other Disclosures
At Clarus our CCPView product has Quantitative Disclosure data from thirty-six Clearing Houses, each with more than one Clearing Services and this quarterly data starts in Sep 2015.
I cover a few highlights on a quarterly basis, see 4Q19 – Default Resources and today’s article on Initial Margin.
However as with any summary, it is limited and may leave out details that are important for your firm.
I would encourage you to reach out to us and ask about a subscription to CCPView for your firm.
With over 200 quantitative data fields and quarterly figures from September 2015 to December 2020, for 36 clearing houses, most with more than one clearing service, that is a lot of data to analyse.