In a recent blog, procylical margins in the time of covid-19, I reproduced a chart from a BIS Bulletin showing that IM requirements for US Equity Index Futures doubled during March, the peak of the covid-19 market crisis. Today I will take a detailed look into these margin changes, concentrating on the S&P 500 index.
Open Interest
In CCPView we can see the open interest of CME futures categorized by the main US Equity Indices and converted to usd equivalents.
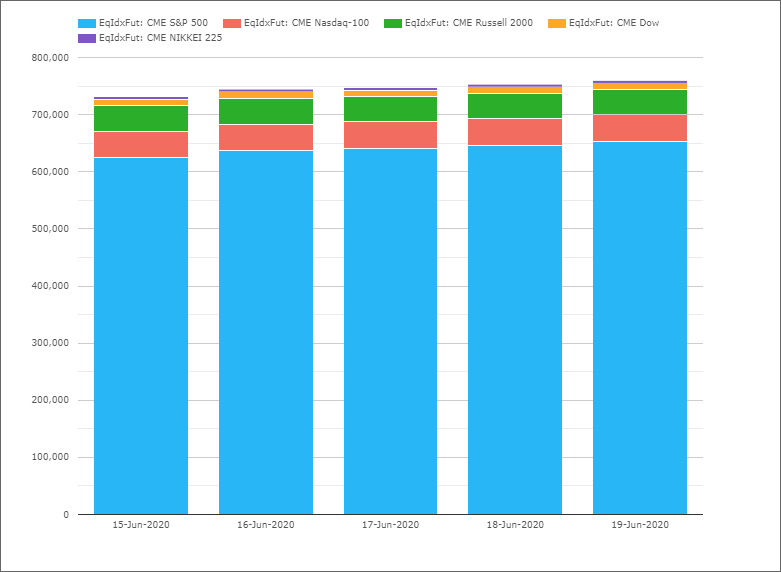
This shows that as of 19-Jun-2020:
- Overall open interest of $760 billion
- S&P 500 by far the largest at $653 billion
- Nasdaq 100 at $47 billion
- Russell 2000 at $43 billion
- Dow at $12 billion
- Nikkei 225 at $4.5 billion
CME S&P 500 Products
For the S&P 500 index there are three main CME Futures contracts:
- S&P 500 Futures, contract unit is $250 x S&P 500 Index
- E-mini S&P 500 Futures, contract unit $50 x S&P 500 Index
- Micro E-mini S&P 500 Futures, contract unit $5 x S&P 500 Index
So contract size ratios of 50 to 10 to 1.
Margins as of today are $60,000, $12,000 or $1,200 per contract, so in the same ratio as contract size, as we would expect.
(All of these details are available from the CME Group website).
E-mini S&P 500 has by far the largest open interest with $563 billion, followed by S&P 500 Future with $87 billion and Micro E-mini with $2 billion.
Margin Changes
On 3-Jan-2020 the S&P Future had a margin requirement of $31,500 per contract, while today 24-Jun-2020 the margin requirement is $60,000.
(Note the E-Mini and Micro margins are simply 1/5 and 1/50 of these)
Let’s see how this margin changed over the period 26-Feb to 25-Mar.
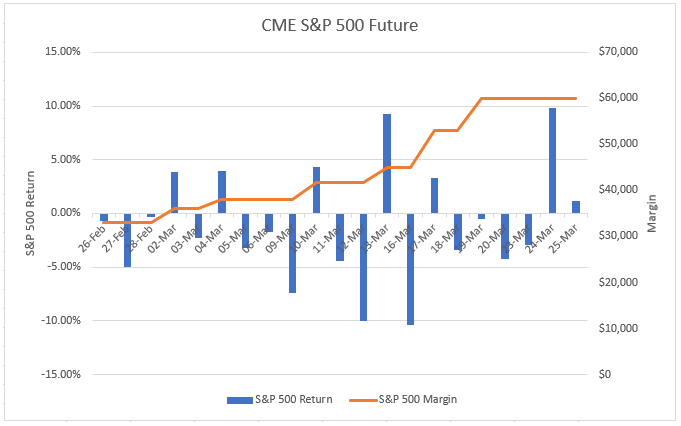
The orange line and the right-hand axis shows that margin started at $33,000 on 26-Feb and first increased by $3,000 on 2-Mar, followed by similar increases on 4-Mar, 10-Mar, 13-Mar and then two larger increases of $8,000 and $7,000 on 17-Mar and 19-Mar to end at $60,000.
An increase of $27,000 or 82% over this period, so almost double!
The blue bar show the daily changes in the S&P 500 index and the increasing size of these, especially on 12-Mar, 13-Mar and 16-Mar are the drivers of the margin increases.
(Historical margin figures are published by CME here, while I have calculated the returns from historical price data available at www.macrostrends.net).
Pro-cyclicality of Margins
As noted in the BIS Bulletin, “higher margins should be expected during heightened turbulence, but the extent of the procyclicality of margining is the consequence of various design choices.”
The concern being that increasing initial margin too much at a time of market stress when market participants are having to meet larger daily variation margin calls can result in increasing market stress.
So as an example, a participant that was long 10 contracts in the S&P Future, a position equivalent to $6.7 million notional, would have had to meet a variation margin call of $700,000 on 16-Mar as the S&P 500 fell 10% or 280 points and on 17-Mar the initial margin requirement would have increased by $80,000 from $450,000 to $530,000 and then again on 19-Mar by $70,000 to $600,000.
For an FCM, with say 100 client accounts, each long 10 contracts, this would have resulted in daily VM of $70 million to be collected from clients on 16-Mar or the day after and then a $15 million increase in initial margin required from clients, ((80,000+70,000)*100).
And then there is that fact that six times over this 1-month period, the margin requirement increased to go from $33,000 to $60,000 per contract.
The Question
Was the increase of 82% for the S&P 500 contract too much?
Meaning it should have been higher prior to Feb-2020 or it should have increased less?
Before we answer that, here is a question for you to consider.
How volatile has S&P 500 been prior to March 2020?
As low volatility leads to lower margin, we could look at rolling measures of historical volatility.
An easier way is to ask how often and when has S&P 500 moved by a lot?
Taking the past 20 years of history and defining a lot as > 8%.
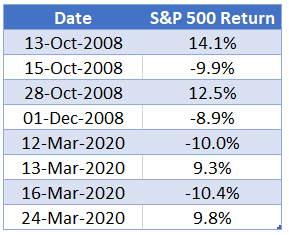
We see that prior to March 2020, we have to go back 12 years, all the way to December 2008 to find a daily move greater than 8%.
In-fact the only moves since Sep-1997 (the start of my history) that are greater than 8% up or down, occurred in the 2008 Great Financial Crisis and in the 2020 Covid-19 Pandemic.
Final Thoughts
Does that alter your answer to the question, “is the margin increase of 80% too high”?
For me, it is clear that the increase was not too much.
It would have been un-realistic to have a higher margin before.
And it would be un-safe to have not increased significantly after the large moves.
At $60,000 per contract, the margin is just under 8% of notional.
And on first increase to this higher level, it was just under 9% of notional.
While prior to March it was just over 4% of notional.
Given the market moves, those are clearly appropriate margins.
Thank you for reading to the end.
is it too high or not, the question is not answered by market competition.
unlike swaps clearing, the competition between LCH and CME and other smaller players drive down margin requirements to lowest level tolerable by the CCP and regulators.
But for equity futures, CME is simply a monopoly.