We like to stay on top of market trends here at Clarus, and following-on from Amir’s blog yesterday on the sharp rise in uncleared, back-dated EUR IRS, I’ve been taking a look at my “alma-mater” – Cross Currency Swaps. As an uncleared market, there are no execution mandates, but it serves as a pivotal part of global capital markets nonetheless.
SEFs and Volumes
Despite no execution requirements in the DFA for Cross Currency swaps, SEF platforms are highly significant for the market. We can see from SDRView that nearly 67% by volume trades on-SEF:
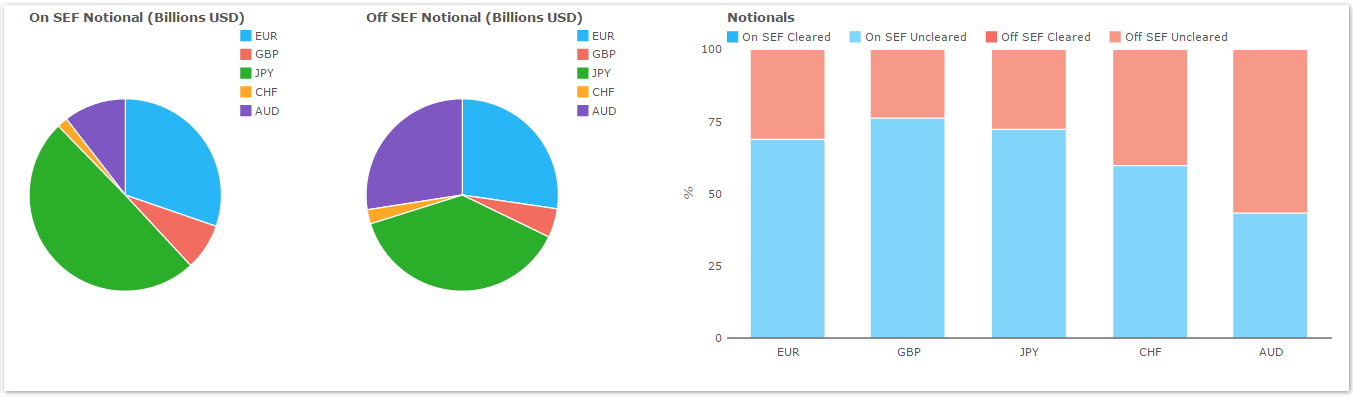
In addition, whilst it may be an expensive product to trade – due to a lack of clearing and hence exorbitant capital charges under Basel III – we have still seen a steady growth in Cross Currency volumes over the past year. This is best seen in SEFView because we see total notionals reported instead of the capped amounts in SDRView:
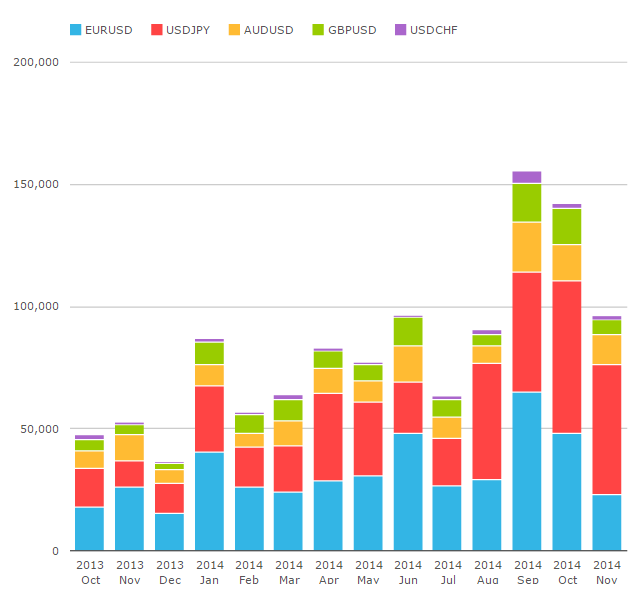
As a quick footnote to these charts, it is important to acknowledge that a Cross Currency swap is not a product that trades frequently. For example, in USD/JPY we have seen 590 swaps in total this month. Of these, 110 were above the block reporting threshold. This is clearly significant and symptomatic of a market that trades infrequently but in large size – but it also presents a bit of a puzzle when trying to develop a rounded picture of the market as a whole. Fortunately, we can counteract this by using SEFView. Because SEFs report notionals in aggregate, we see the total sizes traded – including the full size of block amounts.
Currency Composition
Even armed with the above information, I still found the next chart highly surprising:
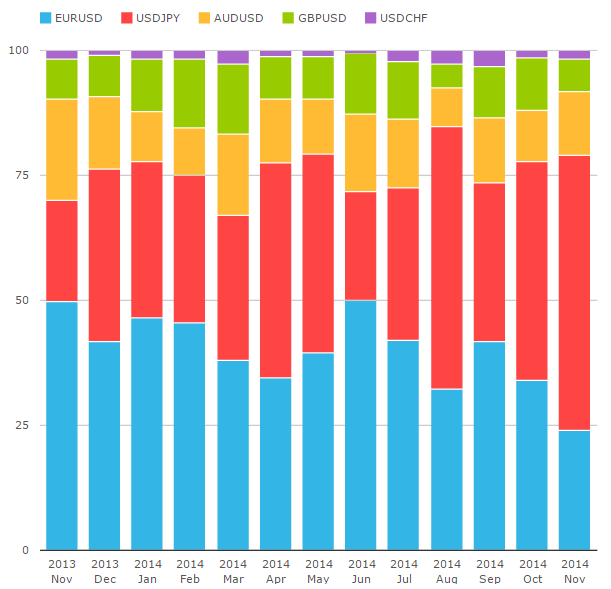
The key questions that this chart raises, to my mind, are:
What has happened to the EUR/USD market?
From constituting 50% of Cross Currency notionals traded, EUR/USD trading has slipped below 25% this month, which has been a gradual trend throughout the year.
What has happened to the USD/JPY market?
USD/JPY has seen almost the polar opposite behaviour. From just a 20% market share in November 2013, USD/JPY is now enjoying a 55% market share, making it larger than all of the other Cross Currency pairs combined!
Who is benefitting from this change in the currency mix?
We’ve already noted that cross currency volumes are generally increasing. EUR/USD trading on-SEF saw it’s second highest month on record in October 2014 at over $48bn. And yet it’s market share slipped under 34%, the second lowest on record.
SEF Market Share
In short, we can safely say that the growth in volumes is all down to USD/JPY trading. Which makes for another fascinating chart:
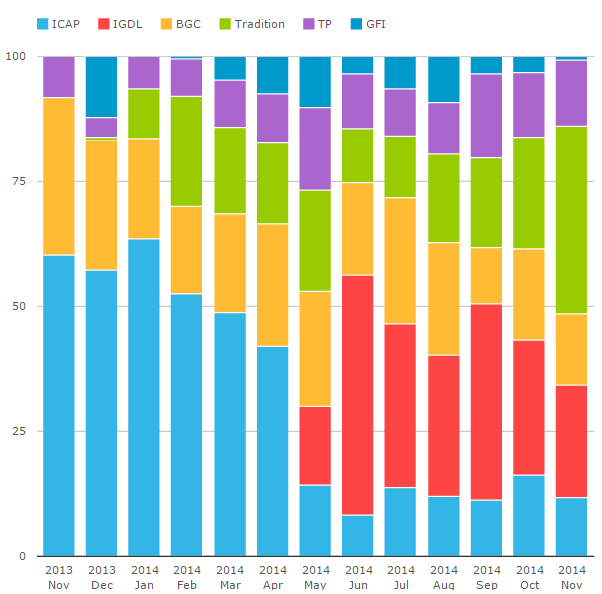
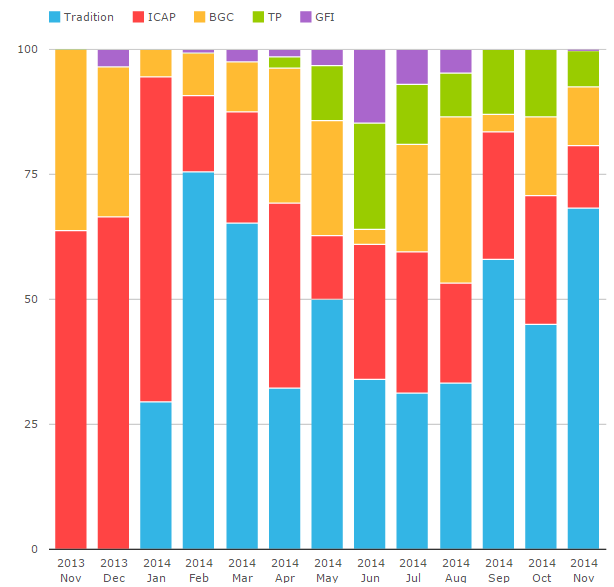
The chart shows the market share per SEF as a percentage for the cross currency swaps market. The trend we can see is quite startling:
- ICAP used to enjoy a 60% market-share in on-SEF Cross Currency Swap trading.
- Tradition were late to the game. Until the past three months they only had a 10-20% market share.
- However, as volumes in USD/JPY have steadily climbed, the Tradition market share has become ever more significant these past three months.
- “Trads” are now currently number one in Cross Currency swaps traded on-SEF with a 37% market share (even after taking ICAP and IGDL as one).
Short-End
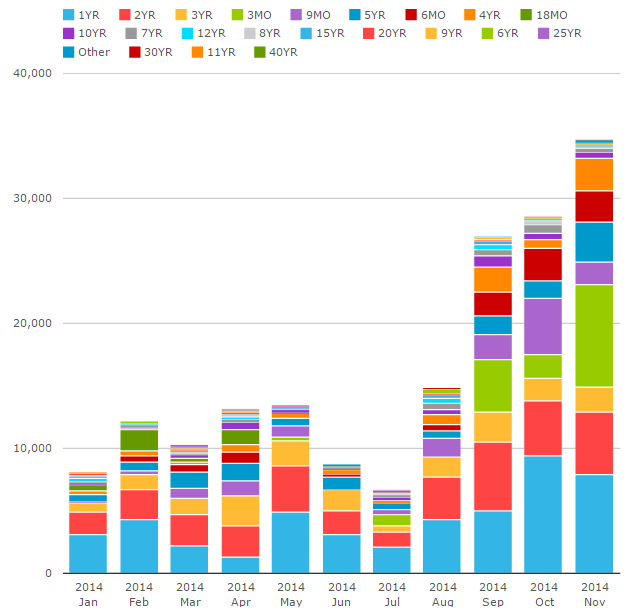
Now, I don’t believe that is the whole story. If we look at the growth in USD/JPY volumes at Trads, we can see a huge amount of it is down to a focus on the short-end of the curve – particularly in the 1 year (light blue) and 3 month (green) tenors:
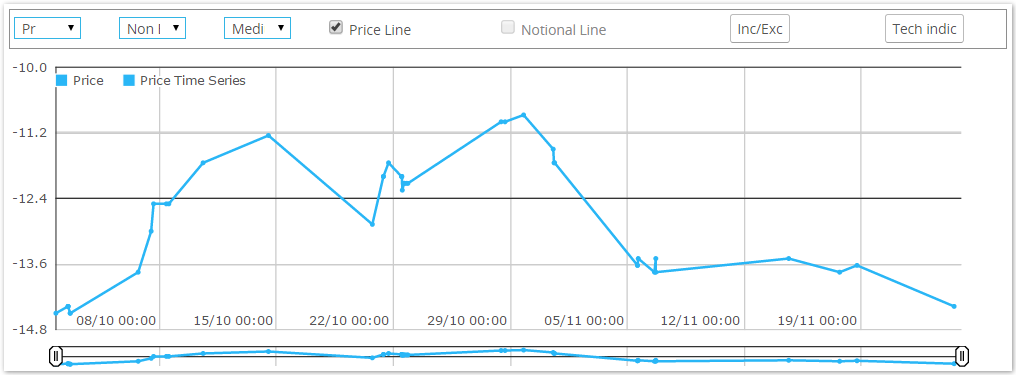
Using SDRView Pro, we can see why this volume growth has been centred at the short-end of the curve. Simply looking at the range of traded prices for 1 year EUR-USD in the past 50 days, it has been constrained in a fairly narrow range from -11 to -15bp:
But for USD/JPY, volatility has returned:
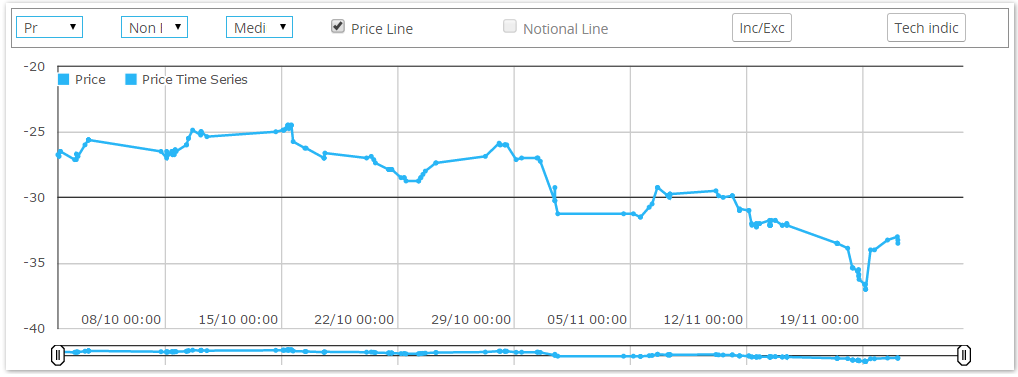
The charts show that the range in 1 year USD/JPY (from -25bp to -37bp) is over 3 times greater than in 1 year EUR/USD.
SEF Market Share by Tenor
If I put this another way – everything changes, but some things stay the same. The below chart shows Trads’ market share in USD/JPY for 2 years and under. It is volatile, but we can essentially see that nothing has changed dramatically in the past 3 months. Indeed, their market share was actually higher in February and March 2014:
Trad’s clearly have a “niche” in servicing the short-end of the USD/JPY market and have successfully protected this as volumes have risen.
Summary
What I am trying to say is plus ça change, plus c’est la même chose. The change in SEF market share in Cross Currency swaps that we have seen recently seems to be a function of the price-action of the underlying asset classes rather than a fundamental shift in market behaviour. Fortunately, the Clarus tools help us shed light on this fact.