Continuing with our monthly Swaps review series, let’s look at volumes in December 2016.
Summary:
- On SEF USD IRS price-forming volume >$1.3 trillion gross notional
- 13% higher than a year earlier
- SEF Compression activity was >$350 billion in USD IRS
- The highest month on record and 66% higher than a year earlier
- USD OIS surprisingly has Off SEF volume up and On SEF down from a year earlier
- On SEF EUR, GBP, JPY IRS volumes are up 28% from a year earlier
- SEF Compression in EUR, GBP, JPY was also strong at >$87 billion
SEF
- Volumes for IRS, OIS, Basis Swaps were up at $1.7 billion DV01
- Tradeweb with a huge increase in volume, driven by Compression
- TrueEx also showing a large increase
- BGC the only D2D SEF up from the prior month
- CME–LCH Switch volumes were $93 billion gross notional
- The highest month on record and double the prior month
- Tradition with $63 billion in the month
- Global Cleared Volumes only slightly down from Nov
- LCH SwapClear down 4%, CME down 8%, JSCC up 6%
- In Asia volumes were down
- In LatAm volumes also down
- Inflation Swaps and NDFs at LCH continue to show strong volume
Onto the charts, data and details.
USD IRS ON/OFF SEF
Using SDRView the gross-notional volume (in $billions) of On and Off SEF USD IRS Fixed vs Float price forming trades (Outrights, SpreadOvers, Curve/Flys).
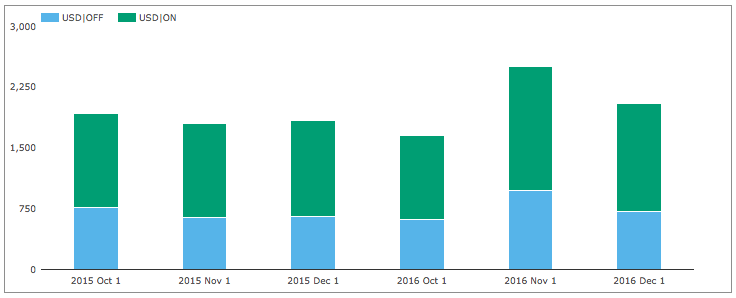
Showing:
- December 2016 On SEF gross notional is > $1,330 billion ($1.33 trillion)
- (recall capped trade rules mean this is understated as the full size of block trades is not disclosed)
- This is 13% higher than December 2015
- November 2016 Off SEF gross notional is > $720 billion
- 10% higher than December 2015
- And On SEF vs Off SEF is 65% to 35%
Next splitting by package type and showing On SEF DV01 (adjusted for curves and flys).
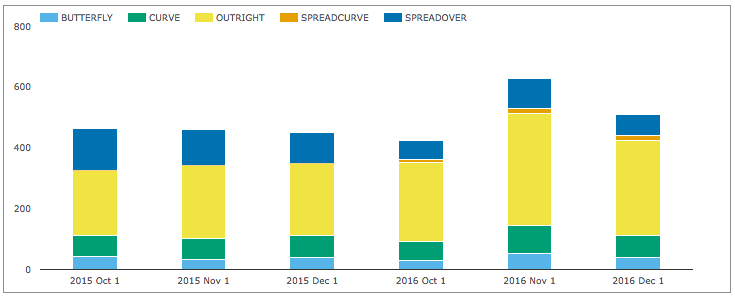
Showing:
- In DV01 terms December 2016 was 13% higher than December 2015
- Overall >$510 million of DV01 was traded in the month
- (recall capped trade rules mean this is understated)
And gross notional of On SEF non-price forming trades; SEF Compression and Rolls.
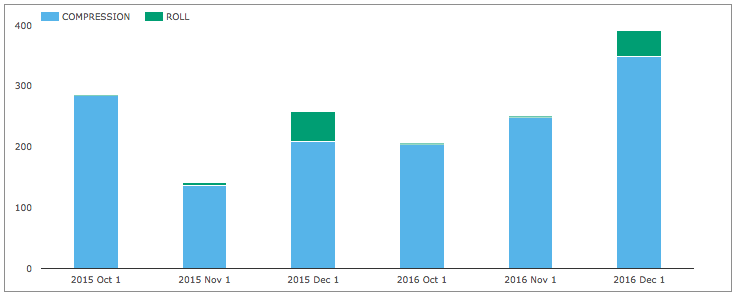
Showing:
- SEF Compression in December 2016 was >$350 billion
- 40% higher than November 2016 and 66% higher than December 2015
- In-fact a highest ever month for compression, exceeding the >$290 billion in June 2015
- IMM Rolls were >$43 billion, similar to Dec 2015
USD OIS Swaps
Next USD OIS Swaps volumes.
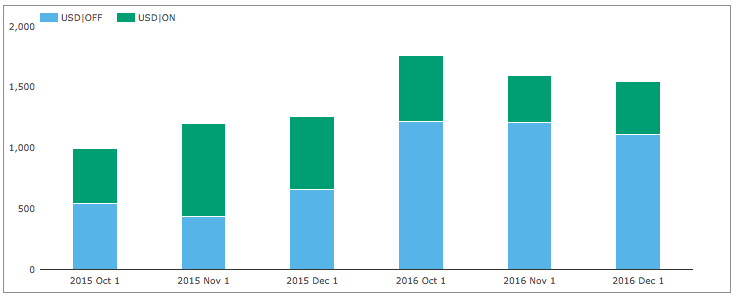
Showing:
- December 2016 volumes similar to the prior month
- 23% higher than Dec 2015
- Off SEF gross notional is 69% higher than Dec 2015
- On SEF gross notional is 28% lower than Dec 2015
- The increase in Off SEF and decrease in On SEF is noteworthy
- Not something we have observed for any other product
- The combined UDS OIS total in December 2016 is > $1.54 trillion
- (recall capped trade rules mean this is understated as the full size of block trades is not disclosed)
- Much lower than the > $2.05 trillion of USD IRS in the month
- The second lower month after three consecutive months of USD OIS being higher than USD IRS
USD IRS Prices
Lets now take a look at what happened to USD Swap rates in the month.
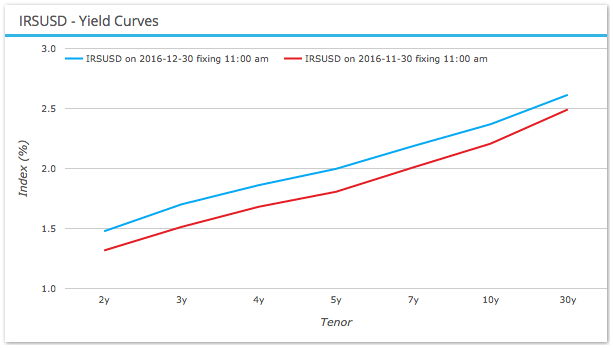
Showing an increase of 18bps rates for all tenors up to 10Y with 30Y up 12 bps, continuing the upwards trends in rates since the US election result in early November.
EUR, GBP, JPY Swaps
Next On SEF volumes of IRS in the other three major currencies.
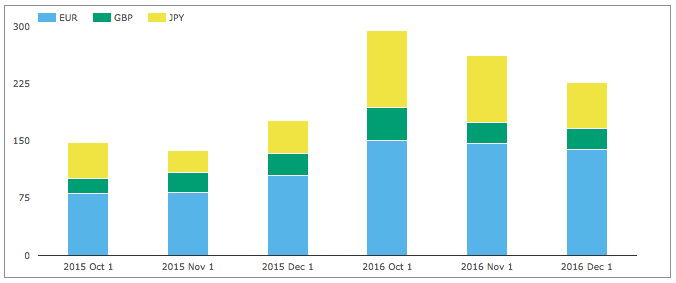
Showing:
- Volumes in December 2016 are up 28% from Dec 2015
- EUR up 33%, JPY up 41% and GBP down 8%
The overall gross notional in these currencies of > $227 billion is 17% of the USD IRS ON SEF volume.
Next SEF Compression activity.
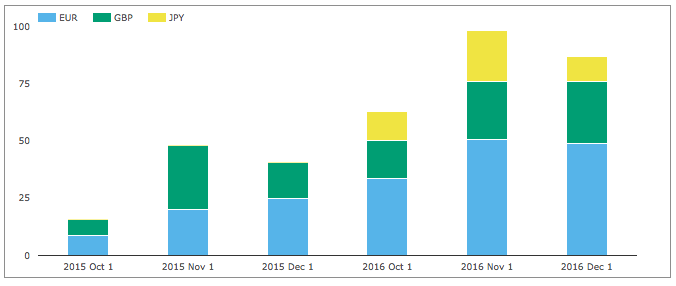
Showing that December 2016 was a very strong month with overall volume > $87 billion, 112% higher than Dec 2015 and equivalent to 25% of the USD IRS Compression figure of >$330 billion.
EONIA and SONIA
Next lets check how volumes in EONIA & SONIA have performed.
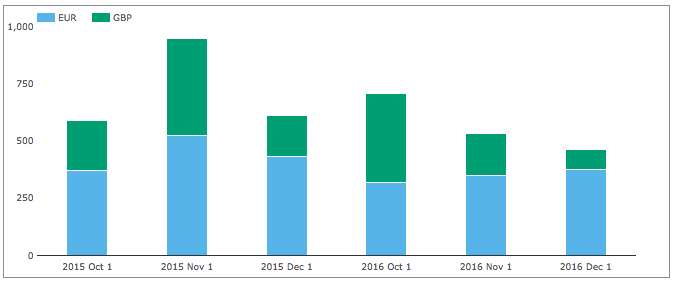
Showing that overall volumes in December 2016 at > $462 billion are 24% lower than Dec 2015.
Compared to the $1.54 trillion of USD OIS in November, EONIA and SONIA volume is 30%.
SEF Market Share
Lets now turn to SEFView and SEF Market Share in IRS including Vanilla, Basis and OIS Swaps.
DV01 (in USD millions) by month for USD, EUR, GBP and by each SEF, including SEF Compression trades for the prior three months.
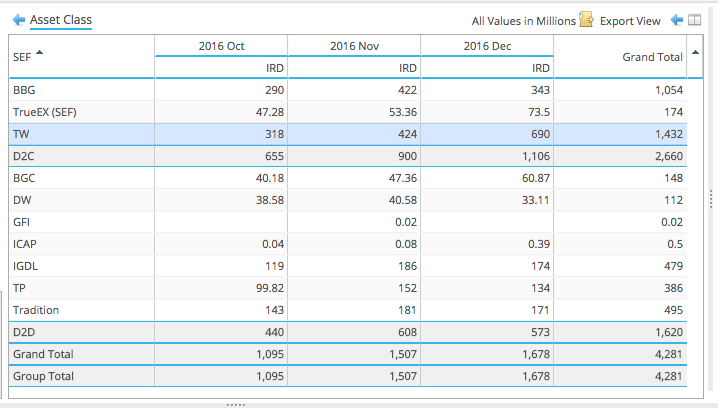
Showing that:
- December volume at $1.678 billion DV01 is higher than the $1.5 billion in November
- Tradeweb is massively up at $690 million DV01, driven by the high compression volumes we saw in SDR
- TrueEx is the other SEF with higher volumes, again from compression
- BGC is the only D2D SEF with higher volume in the month
- IGDL, Tradition and TP are down from Nov but up compared to Oct
In gross notional terms $2.4 trillion of USD IRS traded On SEF in December
From SDRView data above, we know that $1.33 trillion of price forming capped gross notional and $393 billion of capped compression and roll volumes was reported, making the understatement $677 billion.
Put another way the SDR total figure of $1.723 trillion for USD IRS On SEF should be increased by 40% to be equivalent to the actual notional of $2.4 trillion reported by SEFs.
CCP Basis Spreads and Volumes
In SEFView we can isolate CME Cleared Swap volume at the major D2D SEFs (on the assumption that this is all CME–LCH Switch trade activity). Lets look at this for the past 3 months.
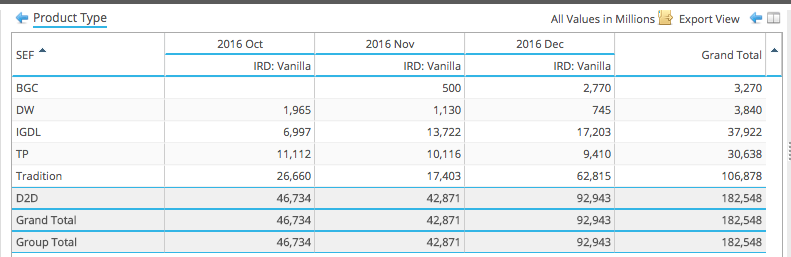
Showing:
- Overall volume in December was $93 billion, more than twice the November figure
- In-fact a new record, beating the previous high of $75b in Nov 2015
- Tradition up from $17b in Nov to $63b in Dec!
- With a lot of volume in 2Y, mostly likely spread vs other tenors
- IGDL up from $14b to $17b
- A very strong end to the year in CME-LCH Switch trade activity
CME-LCH Basis Spreads ended the year at 3.35 bps for 10Y and 4.65 bps for 30Y, so slightly down from 30 November 2016, but well above the levels of prior months.
Global Cleared Volumes
Now CCPView Global Cleared Swap Volumes of EUR, GBP, JPY & USD Swaps (IRS, OIS, Basis, ZC, VNS types).
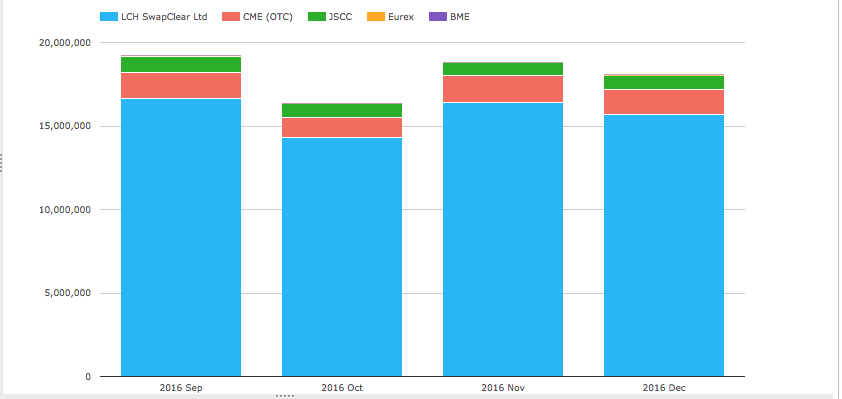
Showing:
- Overall Global Cleared Volumes at $18.1 trillion, only slightly down from Nov
- LCH SwapClear volume at $15.7 trillion, is down 4%
- CME volume at $1.5 trillion, is down 8%
- JSCC volume at $811 billion, is up 6%
- Eurex with $64 billion, is up from $33 billion
- BME figures for Dec are not yet available ($244m in Nov)
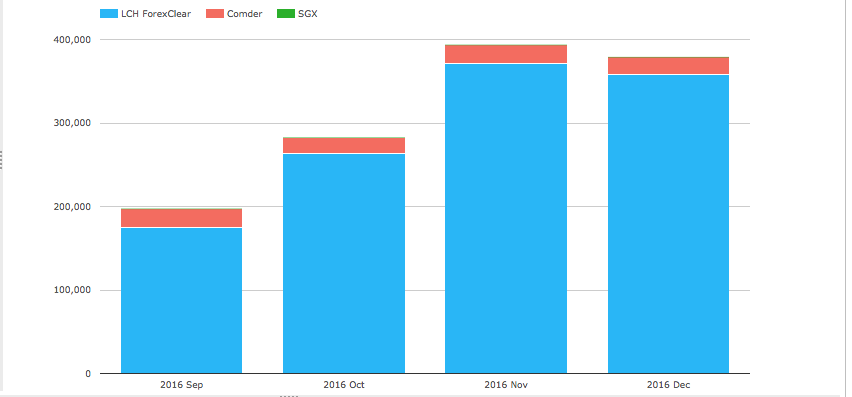
Asia and LatAm
Next the volume of AUD, HKD, SGD Swaps (including Vanilla, OIS, Basis, Zero Coupon).
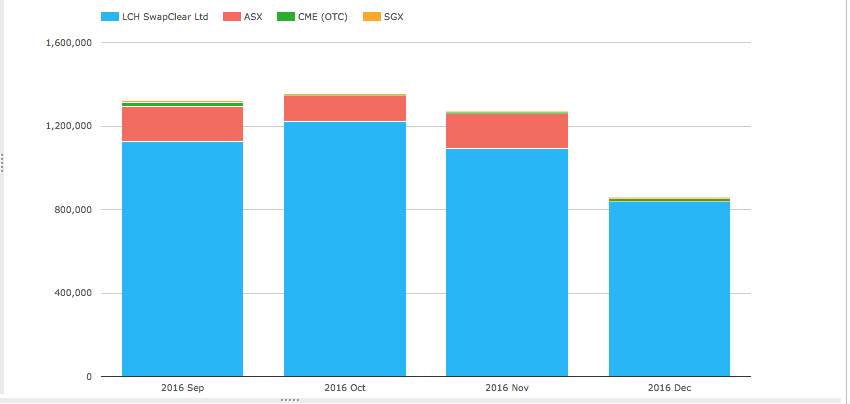
Showing:
- LCH SwapClear at $0.84 trillion, down from the $1.1 trillion in November
- ASX volumes not currently available
- CME at $15 billion, up from $7 billion
- SGX at $6 billion, up from $3.8 billion
And next the volume of MXN and BRL Swaps.
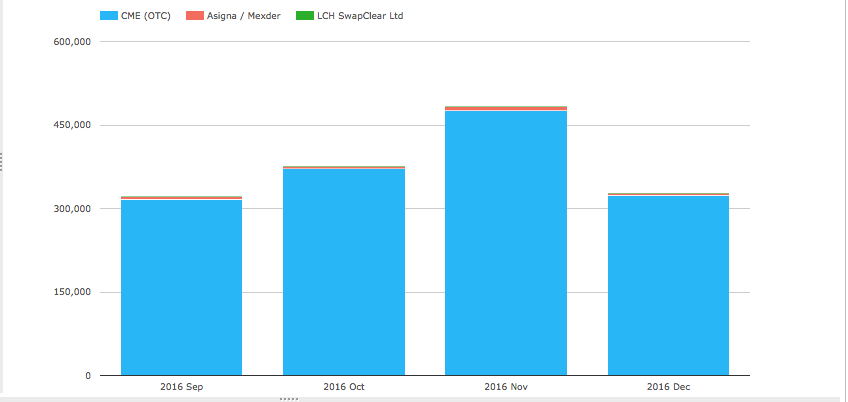
Showing:
- CME up in the first 3 months, then $324 billion in December, down from $476 billion in Nov
- Asigna/Mexder with $3.5 billion, up from $7.5 billion (all MXN)
- LCH SwapClear showing $414 million (all MXN)
Inflation Swaps
Finally lets look at the two products that have gained the most cleared volume from the Uncleared Margin Rules, starting with Inflation Swaps.
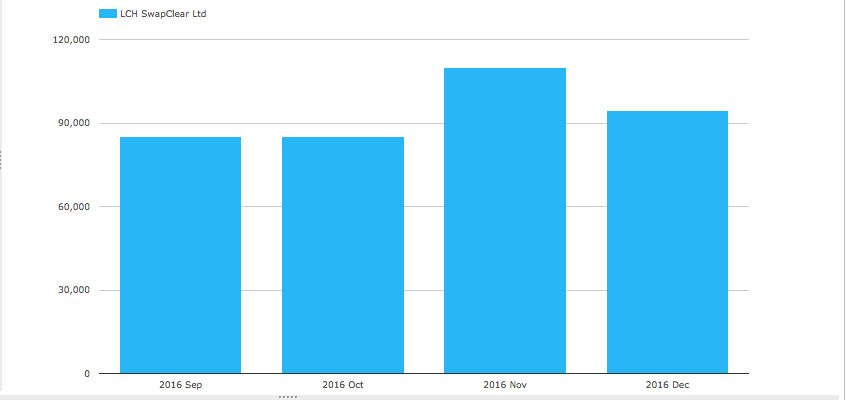
Showing $95billion at LCH SwapClear, comparable to the months after 1 Sep 2016.
Non-Deliverable Forwards
Showing $358 billion at LCH SwapClear, comparable to the prior month.
That’s it for today.
Thanks for staying to the end.
Our Swaps review series is published monthly.