Continuing with our monthly review series, let’s review Swap volumes in November 2016.
SDR highlights:
- On SEF USD IRS price-forming volume in November was > $1.5 trillion
- Almost 50% higher than the prior month
- USD Swap Rates were up 50 bps for 10Y, with a steeper curve
- SEF Compression activity was > $250 billion in USD IRS
- On SEF EUR, GBP, JPY IRS volumes were down
- SEF Compression in EUR, GBP, JPY was up
SEF highlights:
- Volumes for IRS, OIS, Basis Swaps were up at $1.5 billion DV01
- Both D2C and D2D volumes increased 37%
- Tradeweb and Bloomberg neck and neck in D2C
- ICAP and Tradition in the lead for D2D
- CME–LCH Switch volumes at $43 billion were similar to the prior month
- CME–LCH Basis Spreads with a big move, 30Y at 4.85 bps up from 4.15 bps
CCP highlights:
- Global Cleared Volumes were also up
- LCH SwapClear up 14%, CME up 35%, JSCC down 7%
- In Asia volumes were similar to the prior month
- In LatAm volumes were up, with CME up 28%
- Inflation Swaps at LCH SwapClear, a record month, up 30%
- NDFs at LCH ForexClear, a record month, up 40%
- Both continuing to benefit from Uncleared Margin rules
Onto the charts, data and details.
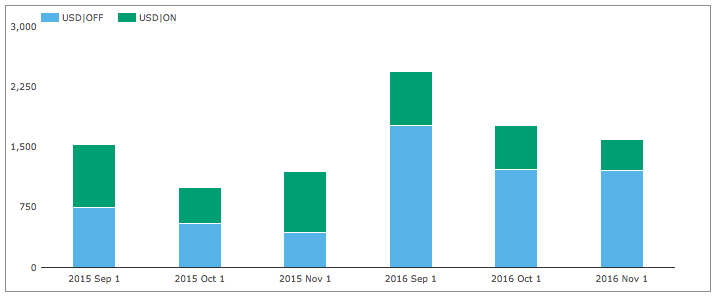
USD IRS ON/OFF SEF
Using SDRView the gross-notional volume (in $billions) of On and Off SEF USD IRS Fixed vs Float price forming trades (Outrights, SpreadOvers, Curve/Flys).
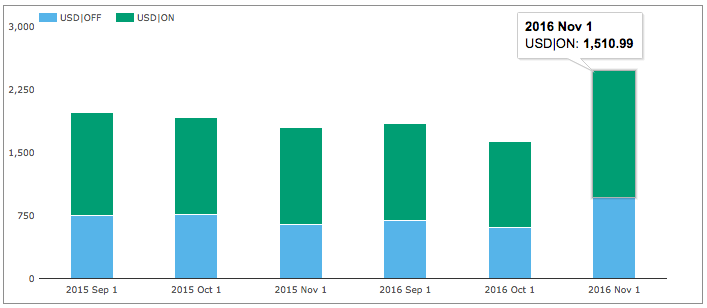
Showing:
- November 2016 On SEF gross notional is > $1,500 billion ($1.5 trillion)
- (recall capped trade rules mean this is understated as the full size of block trades is not disclosed)
- This is 48% higher than October 2016 and 31% higher than November 2015
- November 2016 Off SEF gross notional is > $960 billion
- 57% higher than October 2016 and 50% higher than November 2015
- And On SEF vs Off SEF is 61% to 39%, slightly lower than the YTD average
While selecting trade counts.
Shows 21,783 trades On SEF and 11,393 Off SEF, a total of 33,176 in November 2016, 44% higher than a year earlier.
Next splitting by package type and showing On SEF DV01 (adjusted for curves and flys).
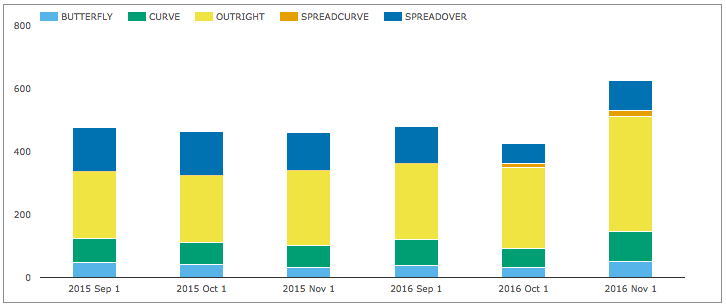
Showing:
- In DV01 terms November 2016 was 47% higher than October 2016
- Overall >$626 million of DV01 was traded in the month
- (recall capped trade rules mean this is understated)
- Compared to November 2015, DV01 was 36% higher
- All package types have higher volumes in the month
- (Note, we now isolate SpreadOver Curve/Switch trades from SpreadOvers)
And gross notional of On SEF non-price forming trades; SEF Compression and Rolls.
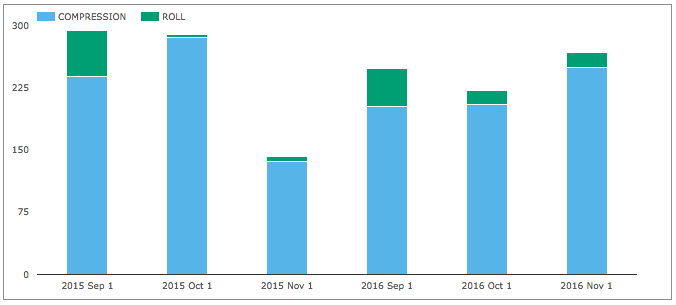
Showing:
- SEF Compression in November 2016 was >$250 billion
- 22% higher that October 2016 and 83% higher than November 2015
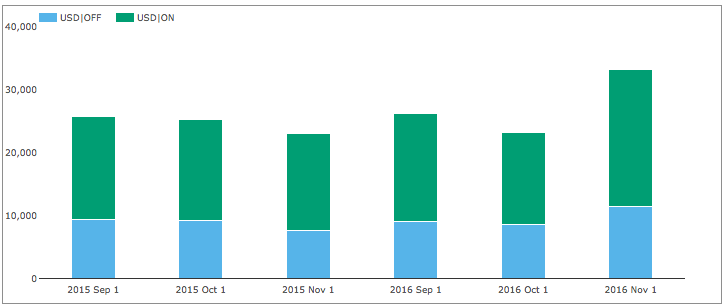
USD OIS Swaps
Now lets check and see how volumes in USD OIS Swaps have performed.
Showing:
- November volumes are much lower than October 2016
- So we do not see the large increase in volumes that we saw in Libor Swaps
- Off SEF gross notional is similar to the prior month
- On SEF gross notional is lower by 30% than the prior month
- The combined UDS OIS total in November 2016 is > $1.6 trillion
- (recall capped trade rules mean this is understated as the full size of block trades is not disclosed)
- Much lower than the > $2.5 trillion of USD IRS in the month
- The first month after three consecutive months of OIS being higher than IRS
USD IRS Prices
Lets now take a look at what happened to USD Swap rates in the month.
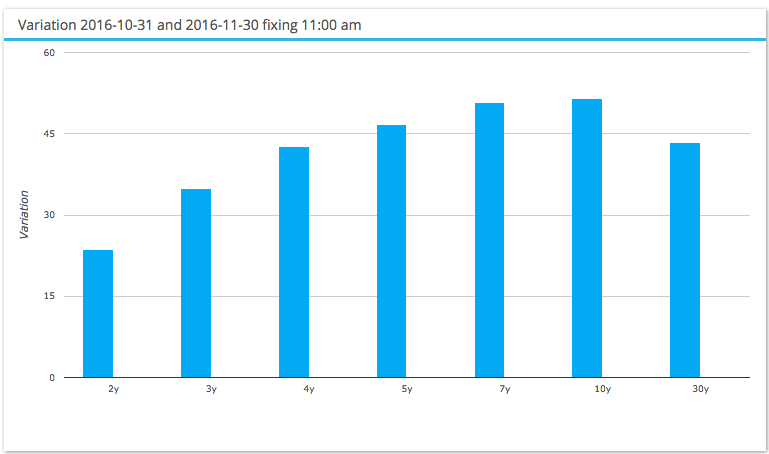
Showing an increase in rates for all tenors with 10Y Swap Rates up 50 basis points and a steeper curve, which we covered in our recent blogs, USD Swap Volumes after Nov 8 and USD Election Live – What is Trading?
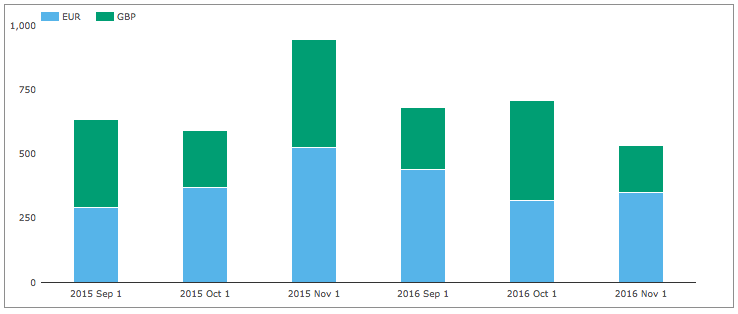
EUR, GBP, JPY Swaps
Next On SEF volumes of IRS in the other three major currencies.
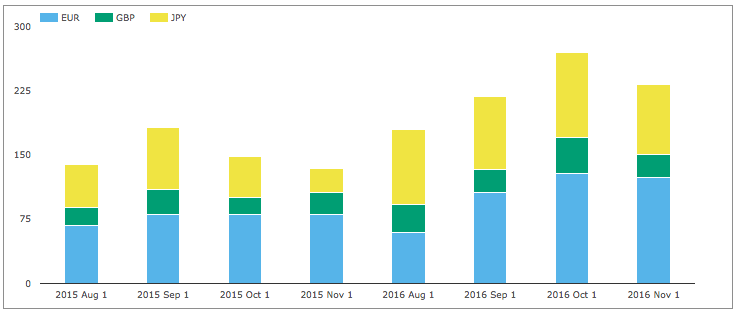
Showing:
- Volumes in November are down 14% from October 2016
- EUR similar, but GBP and JPY lower
The overall gross notional in these currencies of > $232 billion is 15% of the USD IRS ON SEF volume, lower than the 18% average.
So the action was all in USD Swaps this month.
And then SEF Compression activity.
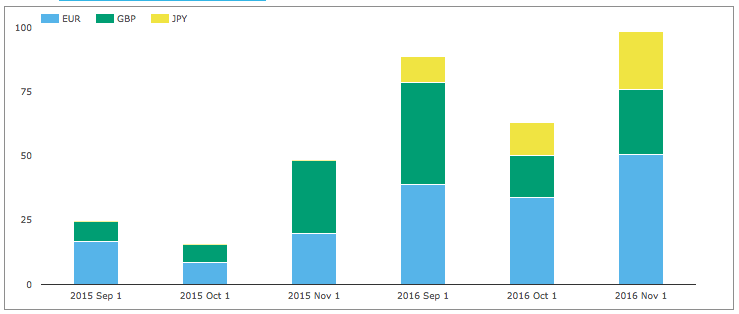
Showing that November was a very strong month with overall volume > $98 billion, with each of EUR, GBP and JPY higher and this total of $98 billion is 40% of the USD IRS Compression figure of >$250 billion.
EONIA and SONIA
Next lets check how volumes in EONIA & SONIA have performed.
Showing that overall volumes in November at > $533 billion are lower than prior months.
Compared to the $1.6 trillion of USD OIS in November, EONIA and SONIA is 33%, much higher than the 15% comparison in IRS.
SEF Market Share
Lets now turn to SEFView and SEF Market Share in IRS including Vanilla, Basis and OIS Swaps.
DV01 (in USD millions) by month for USD, EUR, GBP and by each SEF, including SEF Compression trades and use a chart to compare the relative share in November 2016 with the prior three months.
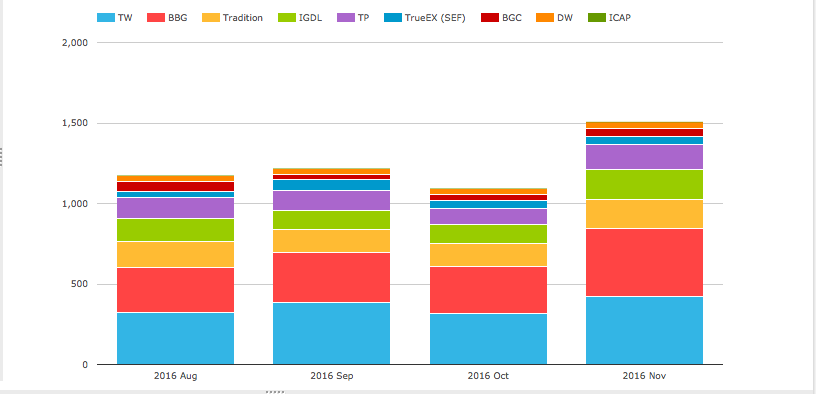
Showing that:
- November volume at $1.5 billion DV01 is much higher than the $1.1 billion in October
- Tradeweb and Bloomberg are neck and neck for the month (with $420 million each)
- Both significantly up from prior months
- With D2C volume 37% higher than the prior month
- ICAP and Tradition next, followed by Tullet
- TrueEX up from its prior month
- BGC above Dealerweb ($47m to $41m DV01)
- D2D volumes also 37% higher than the prior month
In gross notional terms $2.2 trillion of USD IRS traded On SEF in November!
From SDRView data above, we know that $1.5 trillion of price forming capped gross notional and $250 billion of capped compression and roll volumes was reported, making the understatement $450 billion, or put another way the SDR total figure of $1.75 trillion understates the actual notional of $2.2 trillion by 25%.
CCP Basis Spreads and Volumes
In SEFView we can isolate CME Cleared Swap volume at the major D2D SEFs (on the assumption that this is all CME–LCH Switch trade activity). Lets look at this for the past 4 months.
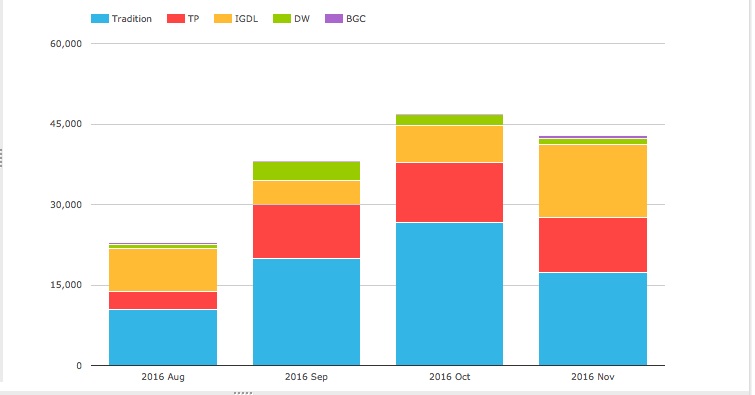
Showing:
- Overall volume in November was $43 billion, just below the $47 billion in October
- Tradition with the 40% share in gross notional terms, down from 57%
- ICAP next with 32% share, up from 15%
- Tullet with 24%, same as the prior month
- DW and BGC with 3% and 1% respectively
CME-LCH Basis Spreads are up again with:
- 10Y at 3.60 bps up from 3.00 bps (end Oct) and 2.75 bps (end Sep)
- 30Y at 4.85 bps up from 4.15 bps (end Oct) and 3.90 bps (end Sep)
It will be interesting to see how these increases impact volumes going forward.
Global Cleared Volumes
Now CCPView Global Cleared Swap Volumes of EUR, GBP, JPY & USD Swaps (IRS, OIS, Basis, ZC, VNS types).
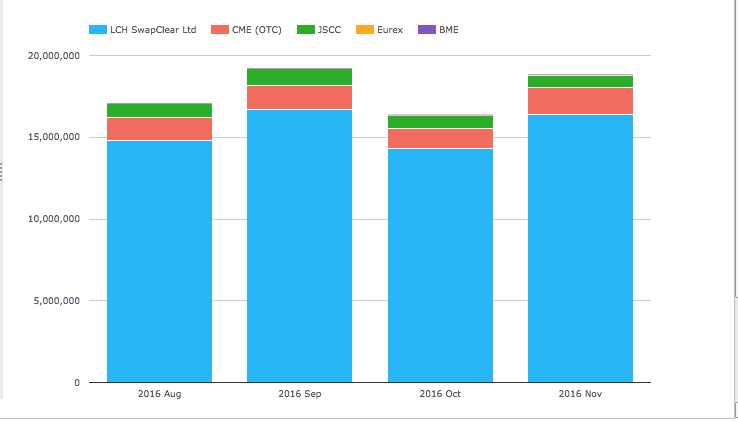
Showing:
- Overall Global Cleared Volumes is up this month (consistent with SEF and SDR data)
- LCH SwapClear volume at $16.4 trillion, is up 14% from October
- CME volume at $1.6 trillion, is up 35%
- JSCC volume at $770 billion, is down 7%
- Eurex with $33 billion, is up from $22 billion
- BME figures are not currently available ($524m in Oct)
Asia and LatAm
Next the volume of AUD, HKD, SGD Swaps (including Vanilla, OIS, Basis, Zero Coupon).
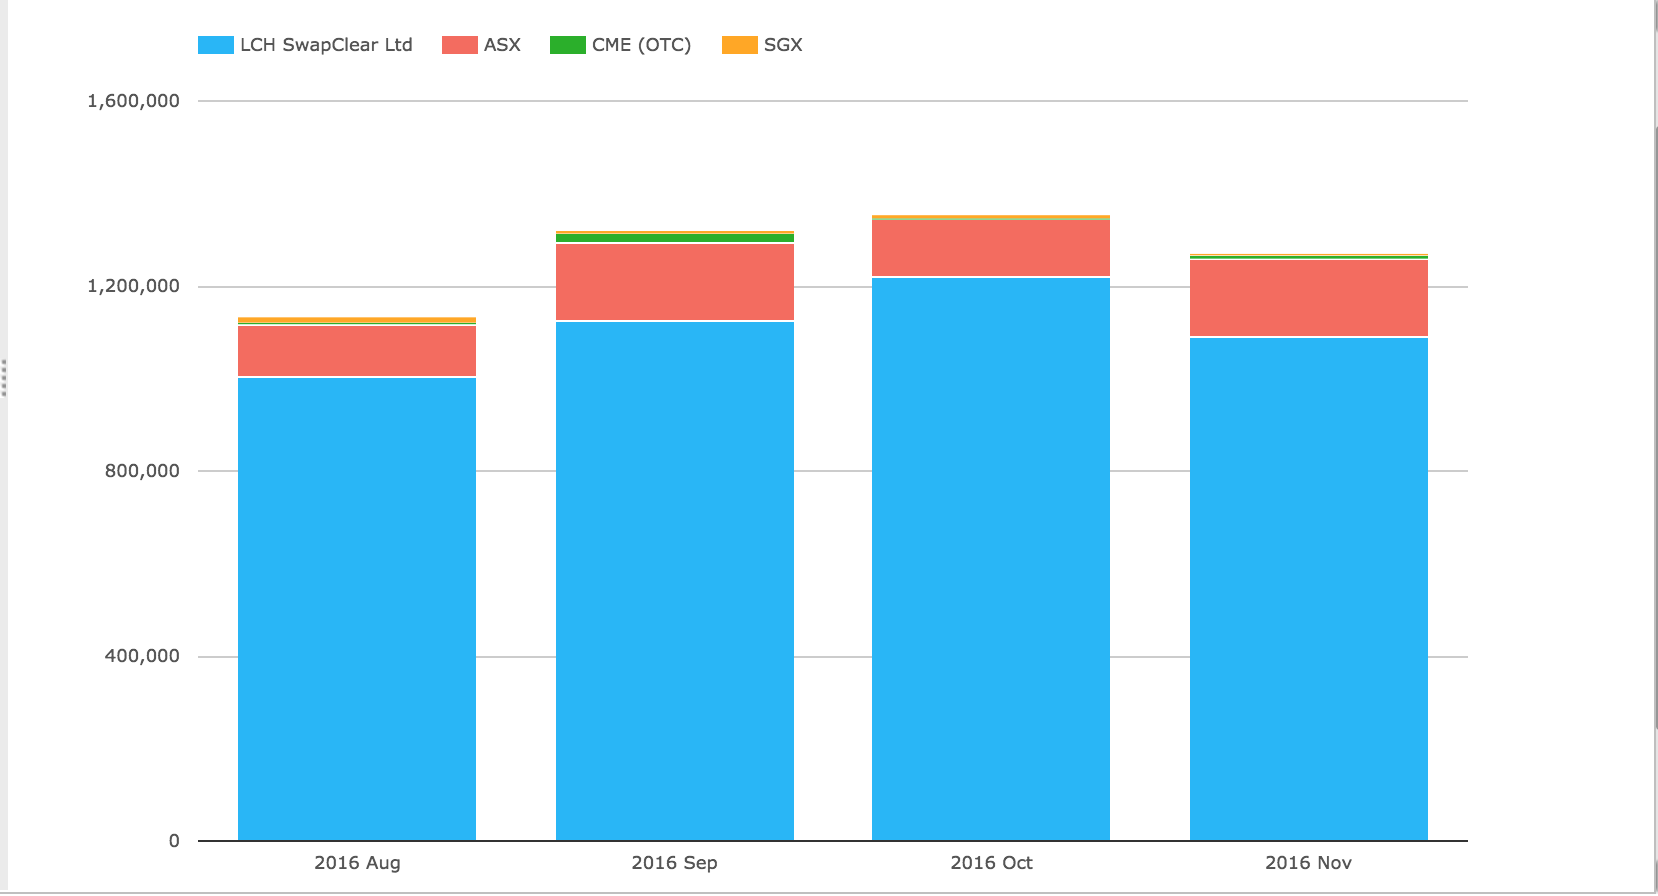
Showing:
- LCH SwapClear at $1.1 trillion, down from the $1.22 trillion in October
- ASX at $169 billion, up from $124 billion
- CME at $7 billion, up from $2 billion
- SGX at $3.8 billion, down from $8.3 billion
And next the volume of MXN and BRL Swaps.
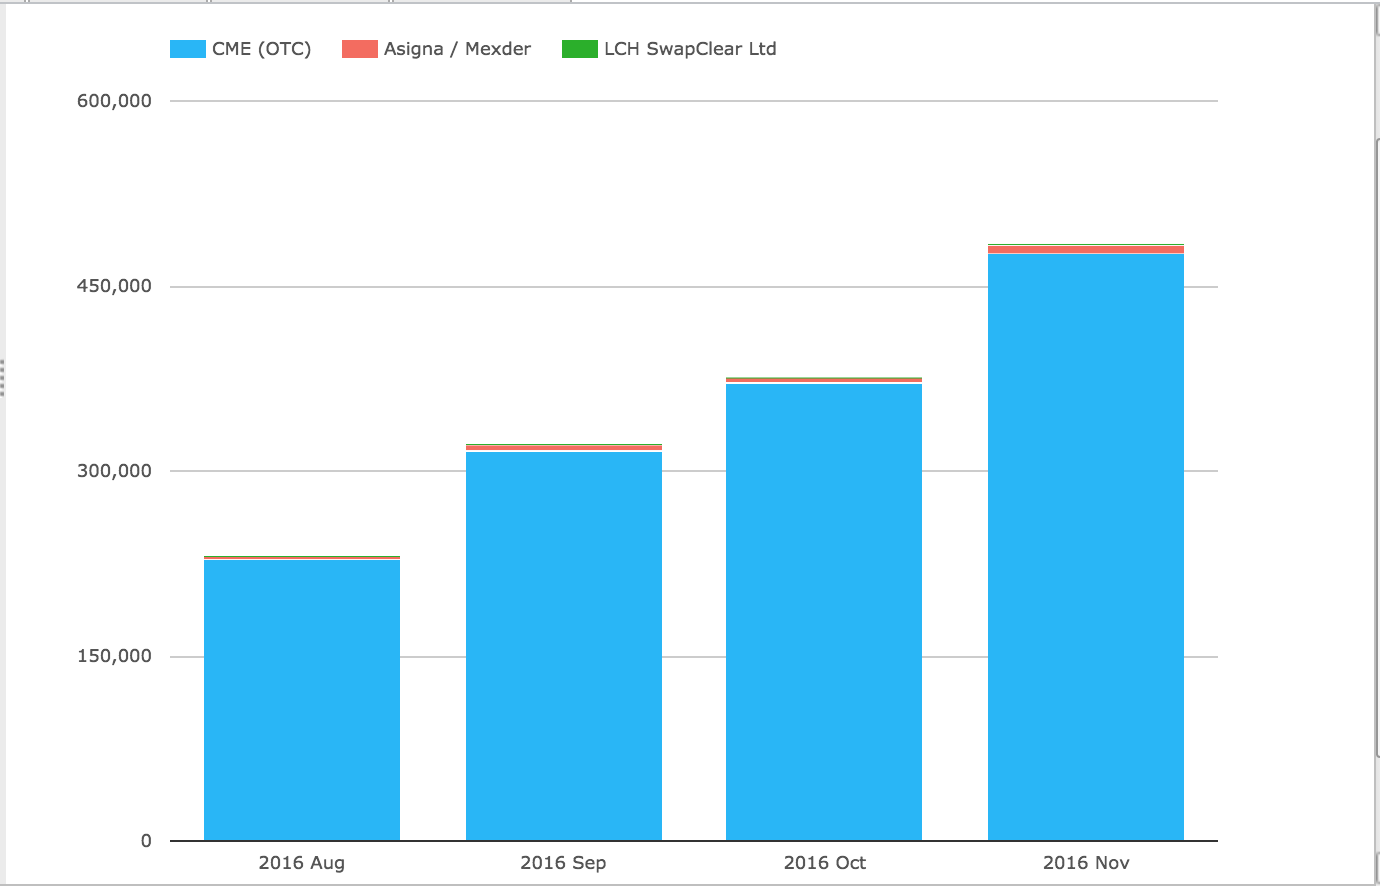
Showing:
- CME up each month, with $476 billion in November, up from $372 billion
- Asigna/Mexder with $7.5 billion, up from $3.9 billion
Inflation Swaps
Finally lets look at the two products that have gained the most cleared volume from the Uncleared Margin Rules, starting with Inflation Swaps.
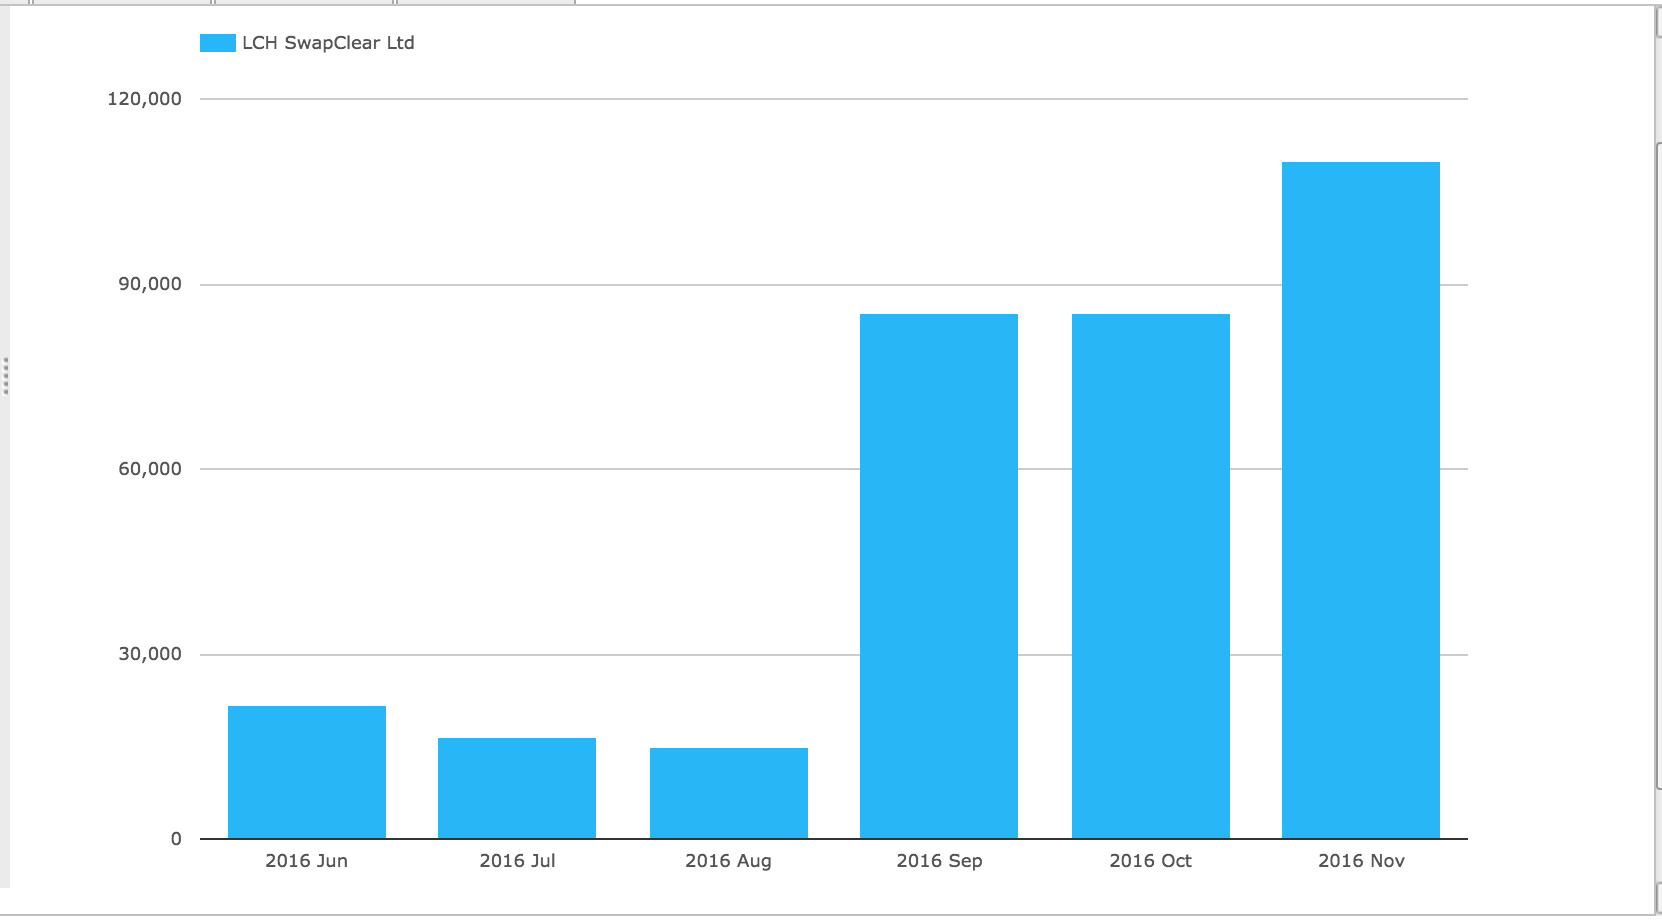
Showing the sharp rise at LCH SwapClear from 1 Sep 2016, with November (single-sided) volumes showing a new high of $110 billion.
And the same but split by currency.
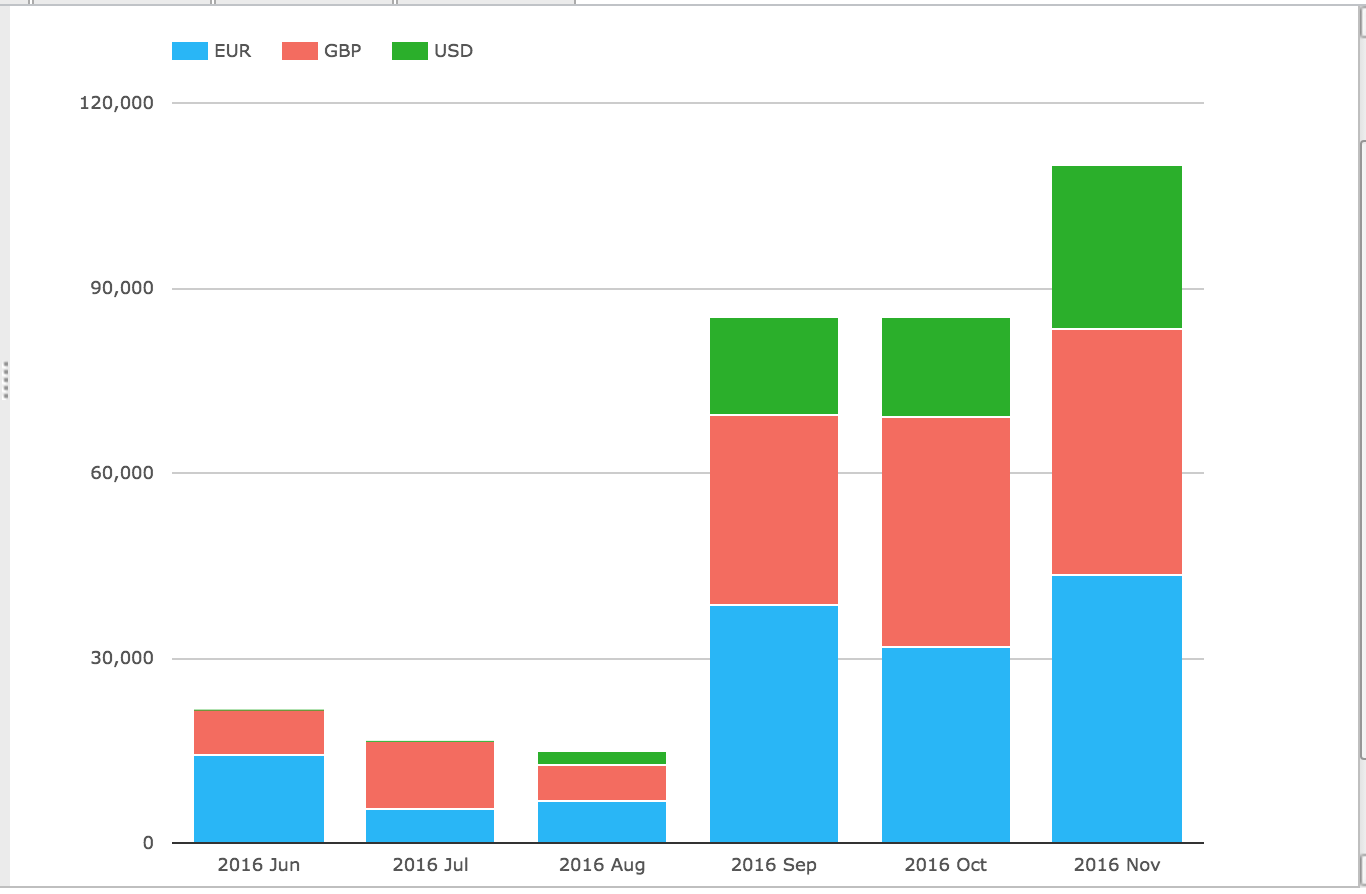
Showing that for November EUR is the largest (40%), followed by GBP (36%) and USD (24%).
Non-Deliverable Forwards
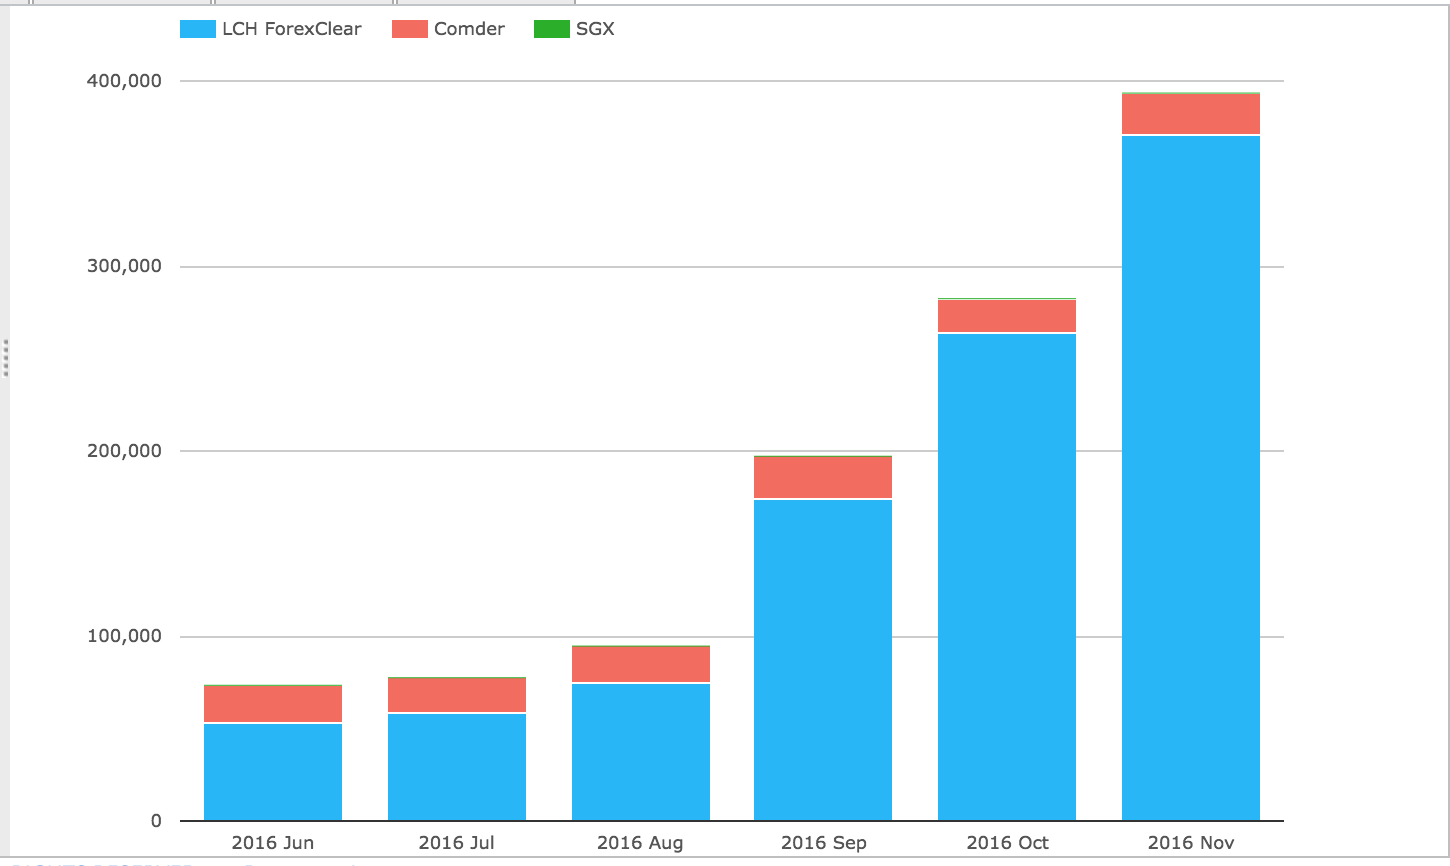
Again showing the sharp rise from 1 Sep 2016 and November with a new high of $394 billion (single-sided), up from $283 billion and LCH ForexClear with 94% market share.
Finally LCH ForexClear volume by currency pair.
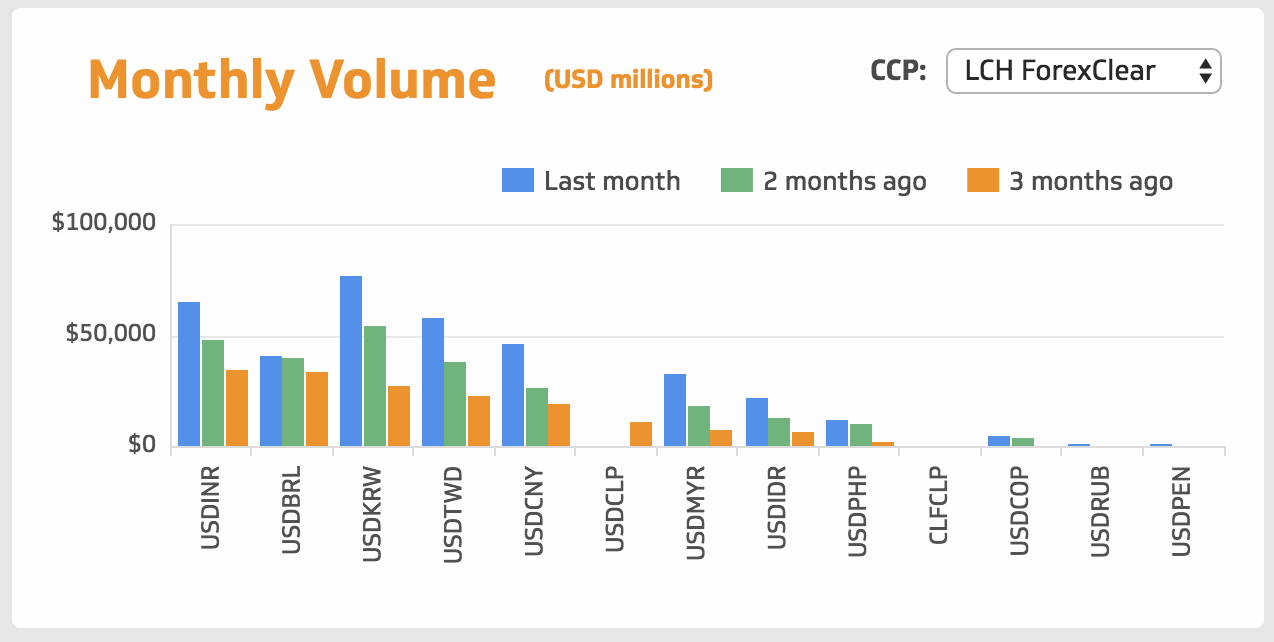
Showing that KRW, INR, TWD, BRL and CNY (in that order) have the highest volumes.
That’s it for today.
Thanks for staying to the end.
Our Swaps review series is published monthly.