- In May 2025, open Interest (OI) in €STR futures exceeded €1.9 trillion notional equivalent, with ICE OI exceeding €1.3 trillion. Both were new records.
- In April 2025, traded volume of €STR futures set a record €8.2 trillion notional equivalent.
- In May 2025, traded volume of €STR futures had its largest-ever 17.7 percent of EUR money-market futures (versus EURIBOR futures at 82.3 percent).
- In May 2025, €STR futures CCP market shares saw ICE with 68 percent of OI, while traded volumes split evenly between Eurex and ICE, with each just shy of 49 percent.
€STR futures
Our €STR Dashboard summarizes key liquidity attributes in this growing market.

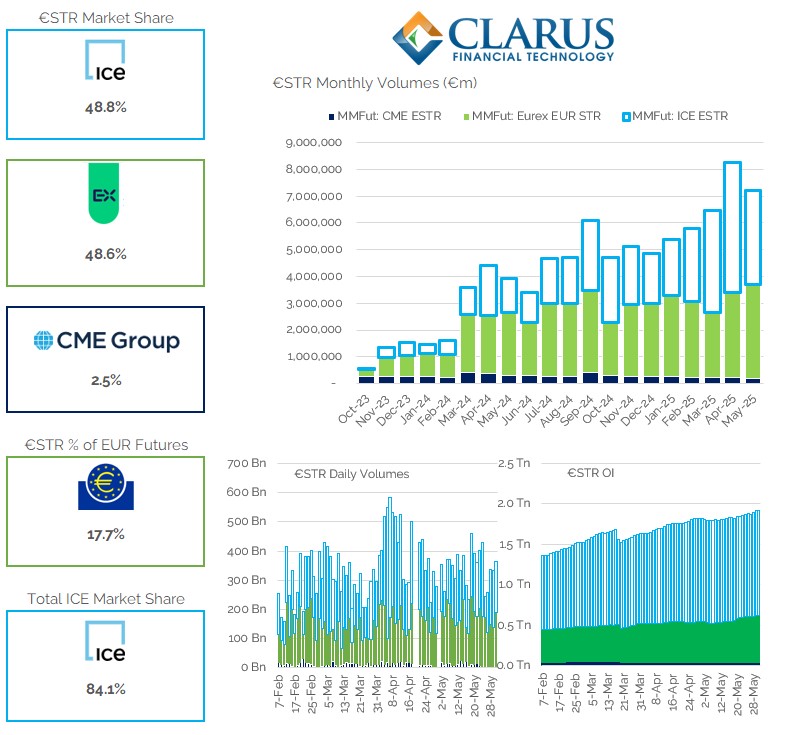
Chart 1: €STR short-term interest rate futures dashboard. Source: Dashboard built using ClarusFT microservices connected to CCPView.
The dashboard shows:
- March, April, and May 2025 each exceeded the prior €STR futures volume record, set in September 2024.
- April 2025 set a new record highest month, with 8.2 million contracts / €8.2 trillion notional equivalent traded.
- €STR accounted for 17.7 percent of all EUR IR ETD trading in May, a new record – up from 15.5 percent in February.
- Eurex €STR contract volumes increased to a record 3.5 million traded in May – up from 3.2 million in April.
- ICE €STR contract volumes decreased from 4.8 million traded in April to 3.5 million in May.
- CME continues to see steady €STR volumes, though they dipped below 200,000 for the first time in May.
- €STR futures market share in May 2025 saw Eurex and ICE neck and neck just shy of 49 percent, while CME had 2.5 percent – with ICE reaching their second highest ever share of monthly volumes.
- Euribor futures traded 33.5 million contracts in May 2025 – lower than March’s record 49.5 million contracts traded.
- Combining the €STR volumes with Euribor means that ICE had an 84 percent market share for all EUR-denominated IR ETD activity.
In addition, CCPView provides longer-range time series, like the following on €STR futures OI.

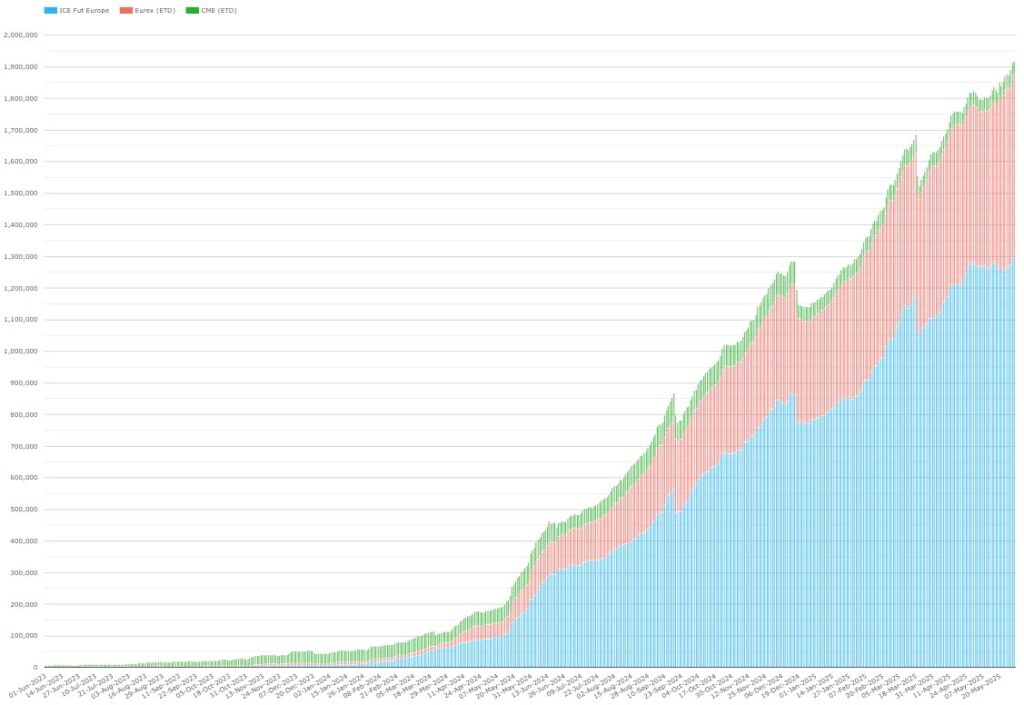
Chart 2: day-by-day €STR futures OI by CCP (notional EUR millions). Source: CCPView
Chart 2 shows that total €STR futures OI went from next to nothing on 01 June 2023 to over 1.9 million contracts / €1.9 trillion notional equivalent on 30 May 2025, evolving from a nascent market to an established market in two years. In particular:
- Total €STR futures OI at the end of May was €1,918 billion – up 26 percent (€391 billion) from the end of February.
- €STR futures OI was shared between ICE with €1,300 billion (a 67.8 percent share), Eurex with €575 billion (30.0 percent), and CME with €43 billion (2.3 percent).
- Since the end of February, Eurex increased its market share from 28.7 percent to 30.0 percent, while Eurex and CME each lost less than 1 percent.
Euribor futures
While €STR futures continue to expand their share, Euribor futures are still much bigger and continue to dominate EUR IR ETD volumes.

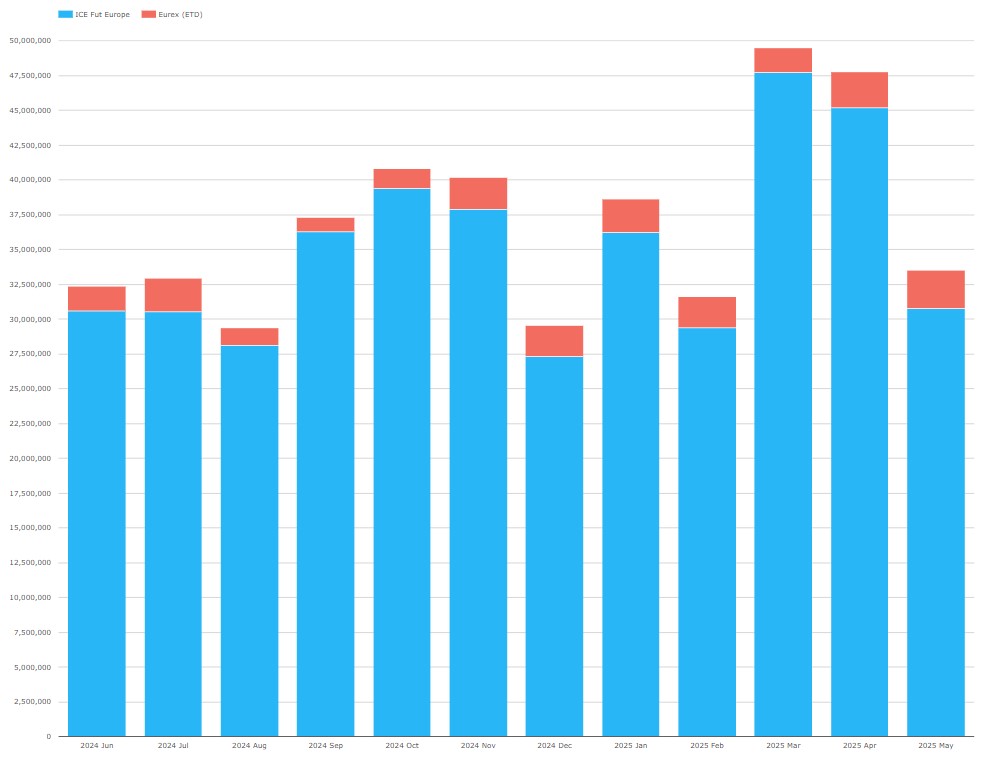
Chart 3: Month-by-month Euribor futures trade volumes by CCP (notional EUR millions). Source: CCPView
Chart 3 shows that:
- In terms of Euribor trading volume, March and April 2025 were both higher than any other month in history, with March setting a new record at $49.5 trillion.
- While ICE dominates Euribor, using the CCPView percentages feature (not shown), we can see that Eurex was 8.2 percent in May, higher than almost every month in the last two years – the exception being March 2024 where it had 14.5 percent.
As reported in our prior €STR blog, there were still no new exchange-traded options on €STR futures since August 2024. However, there has been, a trickle of €STR OTC options (almost all swaptions).

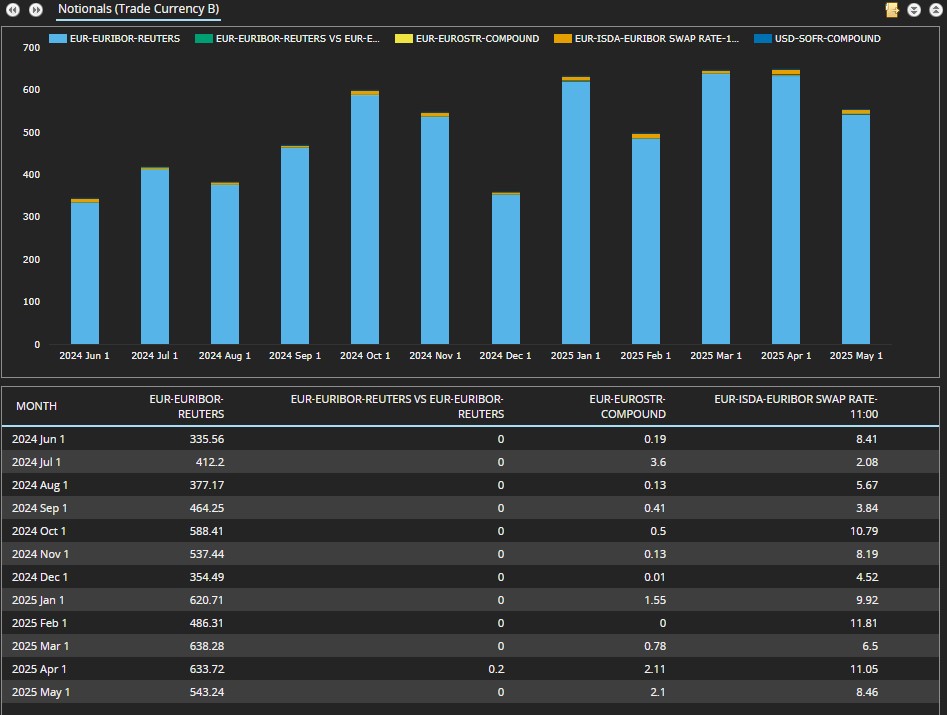
Chart 4: US SDR-reported EUR swaptions and caps/floors. Source: SDRView
Chart 4 shows that most months over the year to May 2025 included ESTR options volume (shown as EUR-EUROSTR-COMPOUND index).
€STR swaps
As noted in the last blog in this series, ESMA’s proposed “Active Account Requirement” has the potential in future to force up to €1 trillion of EUR swaps to move to Eurex. For more detail, see our latest blog on the topic. Meanwhile, let us look at €STR swaps (OIS) volumes.

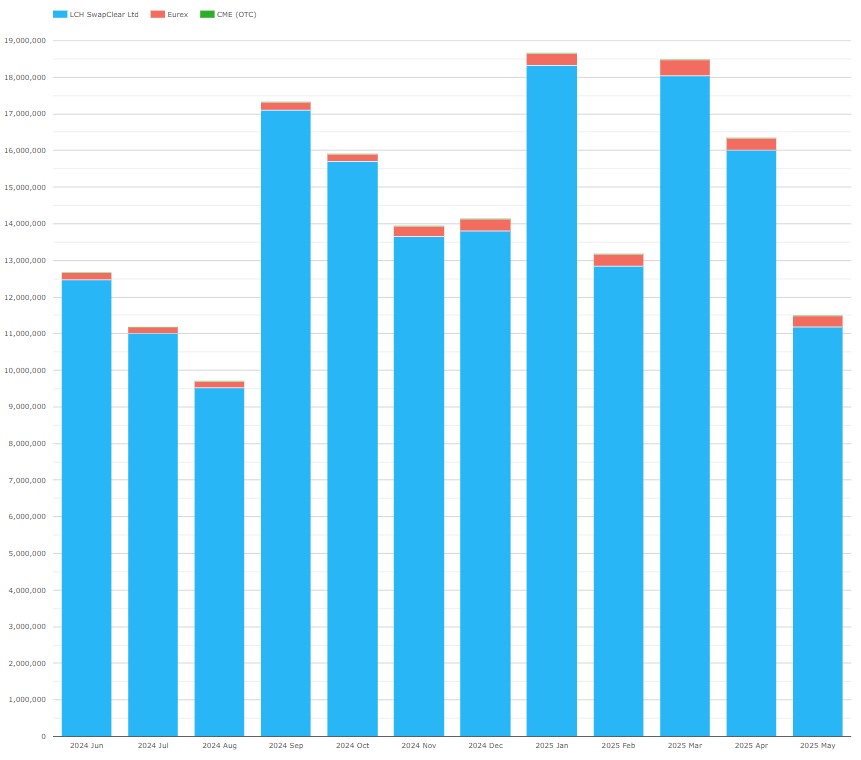
Chart 5: Month-by-month €STR swaps (OIS) cleared volume (notional EUR millions). Source: CCPView.
Chart 5 shows that in May 2025:
- €STR swap trading volume was €11.5 trillion, the lowest month since August 2024 (after March 2025 had been the third-largest month ever).
- LCH SwapClear had 97.5 percent market share in €STR swaps – slightly lower than all recent months except February 2025, in which they had 97.4 percent.
Now, let us take a quick look at €STR swaps in the context of all EUR cleared swaps.

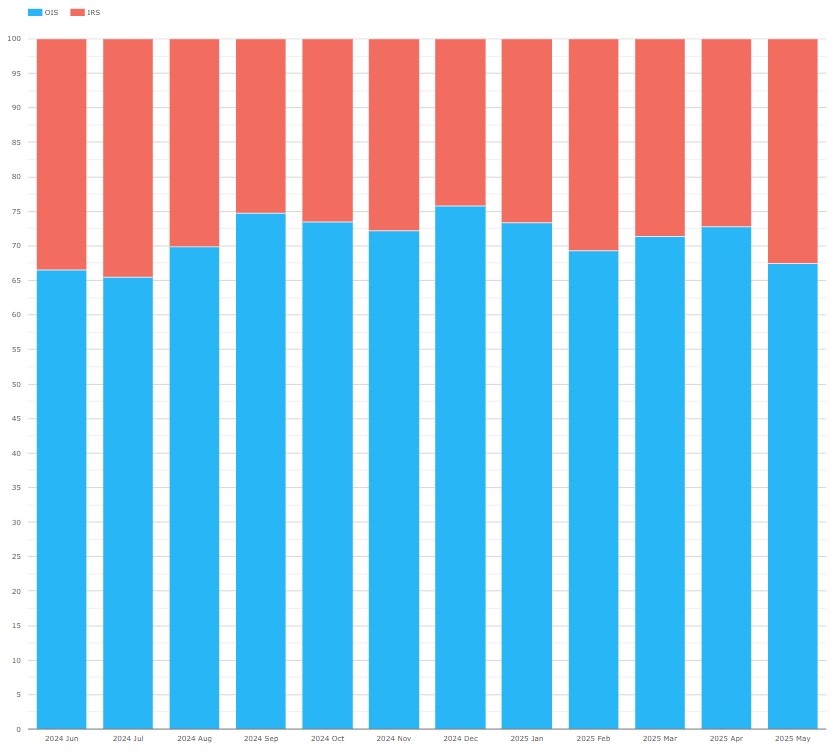
Chart 6: Month-by-month cleared EUR swaps share by product type. Source: CCPView.
Chart 6 shows that, by contrast with €STR futures’ gains in volume and volume share versus Euribor futures, €STR swaps share versus Euribor swaps is more stable.
- In May 2025, €STR swaps (OIS) were 67 percent of EUR swaps volumes versus Euribor swaps (IRS) at 33 percent.
- Over the year to May 2025, €STR swaps were 71 percent of EUR swaps volumes versus Euribor swaps at 29 percent.
In summary
- May 2025 brought record €STR futures OI and volume market share: OI reached €1.9 trillion of which ICE held 67.8 percent, while €STR futures captured a record 17.7 percent of May 2025 EUR MM futures volume.
- Recent months saw robust €STR futures trading volumes and CCP competition: April 2025 saw the highest monthly volume ever at 8.2 million contracts (€8.2 trillion notional), while in May 2025, ICE and Eurex were neck and neck – each with just below 49 percent CCP market share of trading volume.
- €STR swaps and options: €STR swap volumes fell back in May 2025 after March was the third-highest month ever. Proposed Active Account Rules are likely to continue to impact swaps markets. €STR options have remained inactive since August 2024.
Contact us if you are interested in a subscription.