The latest batch of FCM data has been assembled. Lets dig in.
We start with the number of FCMs that are registered, by various metrics:
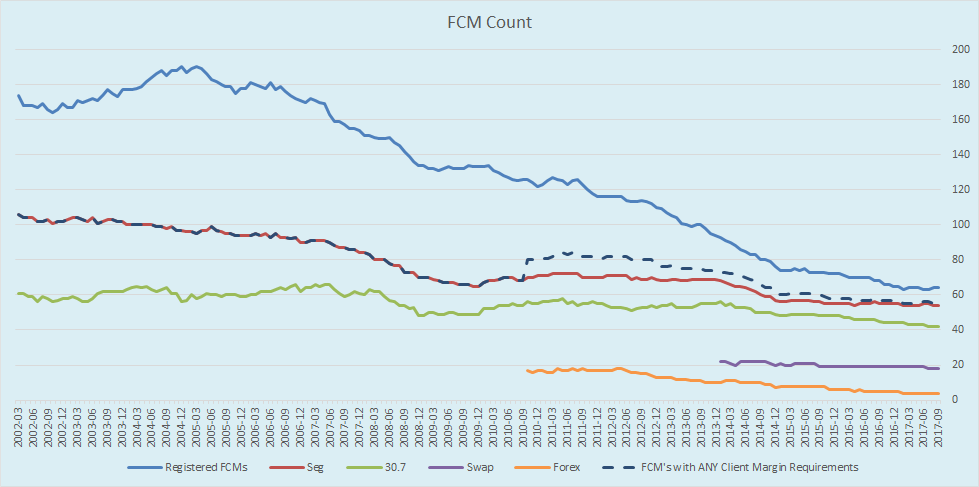
Showing us:
- The number of FCMs registered ticked up by 1 to a total of 64 (addition of Huatai Financial)
- The number of FCM’s with any client margins dropped by 1 to 55
- The number of active Swap FCMs dropped to 19 (Deutsche is now fully at 0 in the US)
Next, the amount of customer funds that are required to support derivatives, in millions of US dollars:
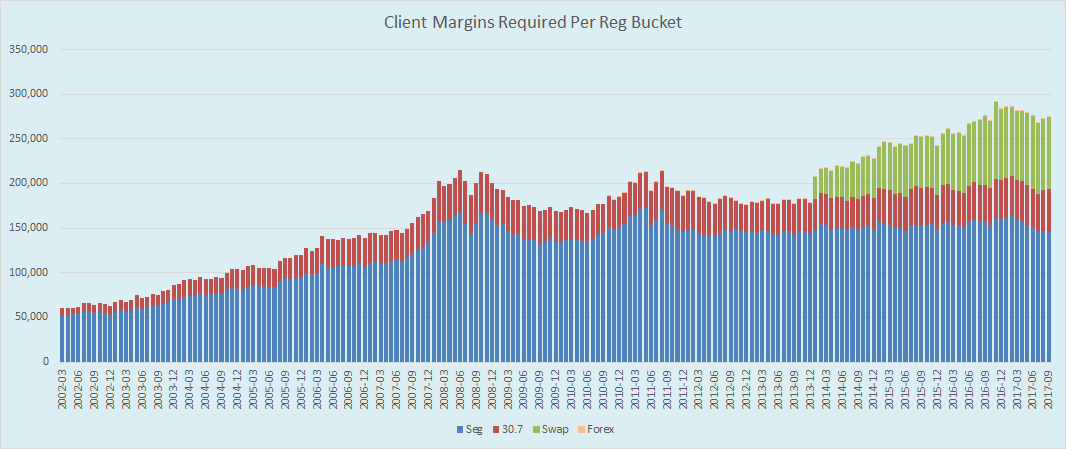
The overall change for the quarter is negligable, however a small shift by required funds:
- Seg funds dropped to $146bn, its lowest quarterly number since 2013
- This change in Seg funds is offset by the highest reading of 30.7 funds, standing at $46.5bn
- Total amount of customer funds on margin is $275bn
Swap League Table
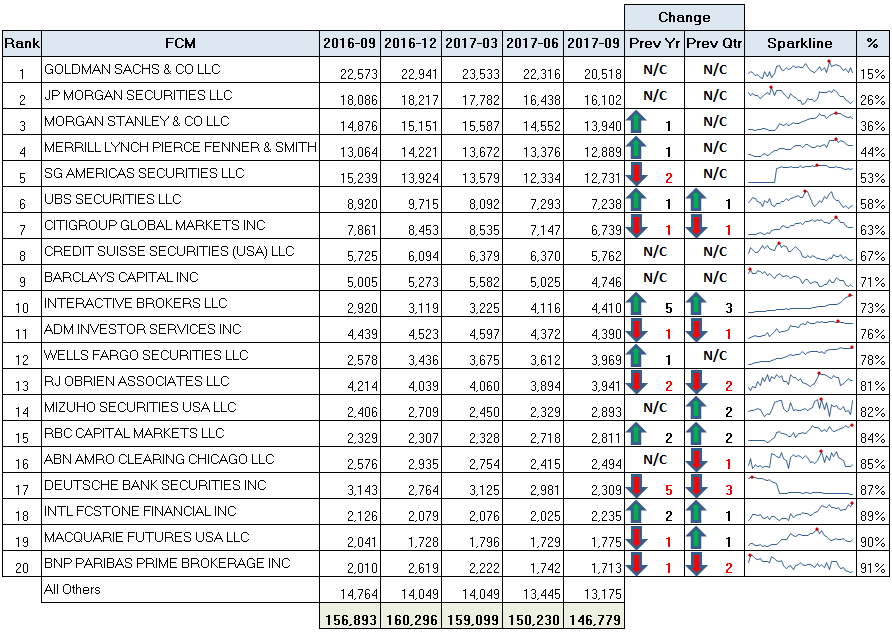
Starting as usual with the Swap league table:
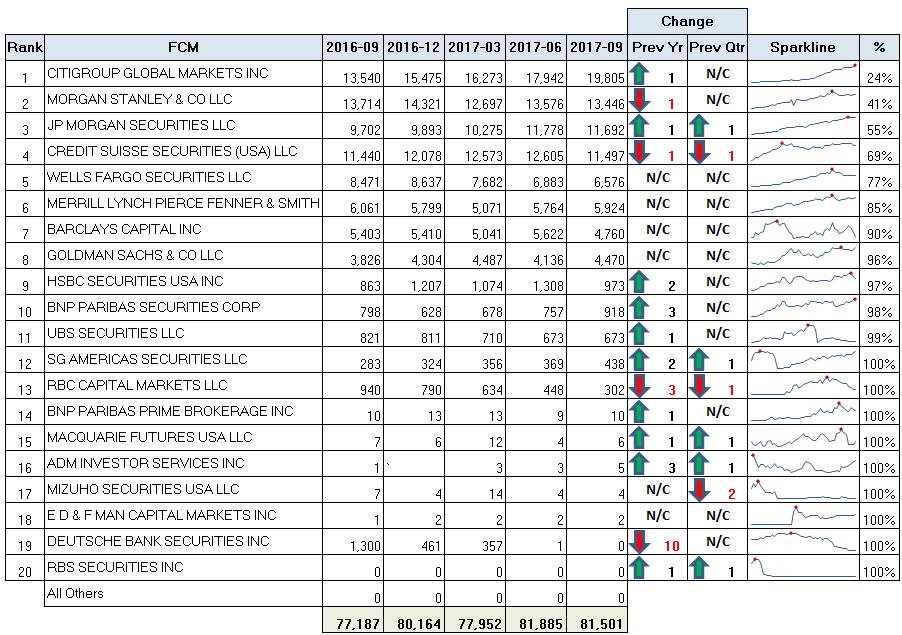
Some small changes this quarter between JP and Credit Suisse, but other than that, the real notable metric is the performance of Citigroup, with nearly 20 billion of client funds. Nearly a quarter of the swap business. The Sparkline shows smooth, constant growth since 2014.
Also notable that we’re down to only 8 firms with $1bn or more in customer required funds.
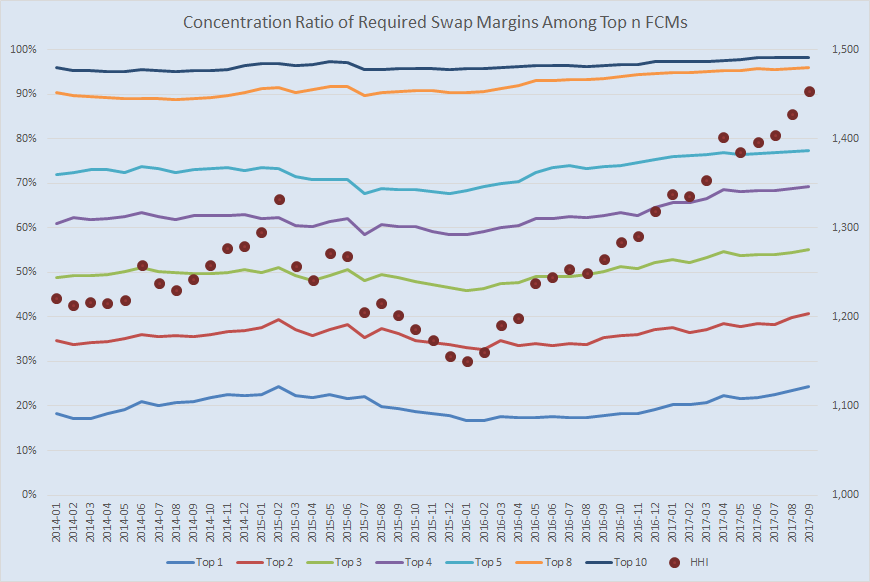
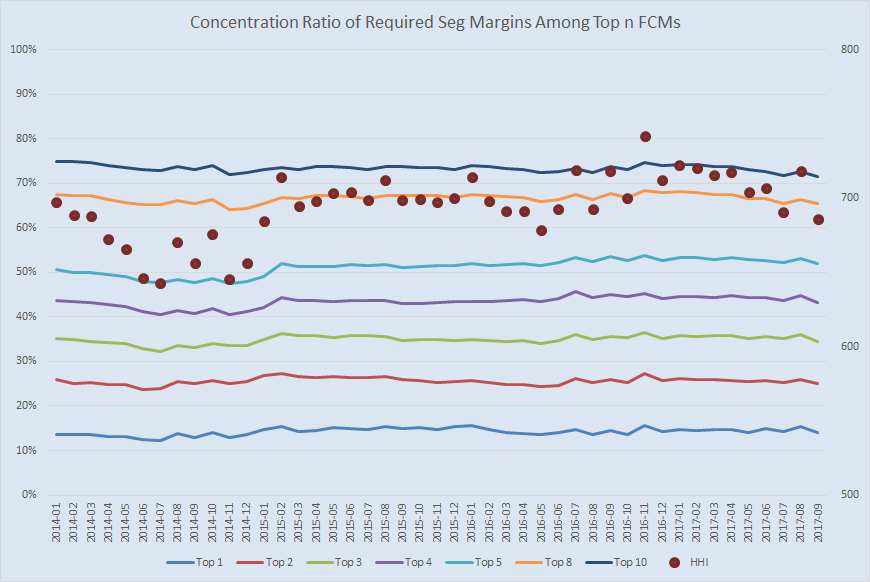
Of course it wont take long for someone to cry “over-concentration”. For which we have the graph below, showing trends in FCM concentration (for swaps), along with the Herfindahl-Hirschman Index (HHI) concentration metric. Citigroup’s performance is responsible for the tick up in this HHI reading.
Remember the US Department of Justice seems to say that a reading of under 1500 is still “competitive”.
Seg League Table
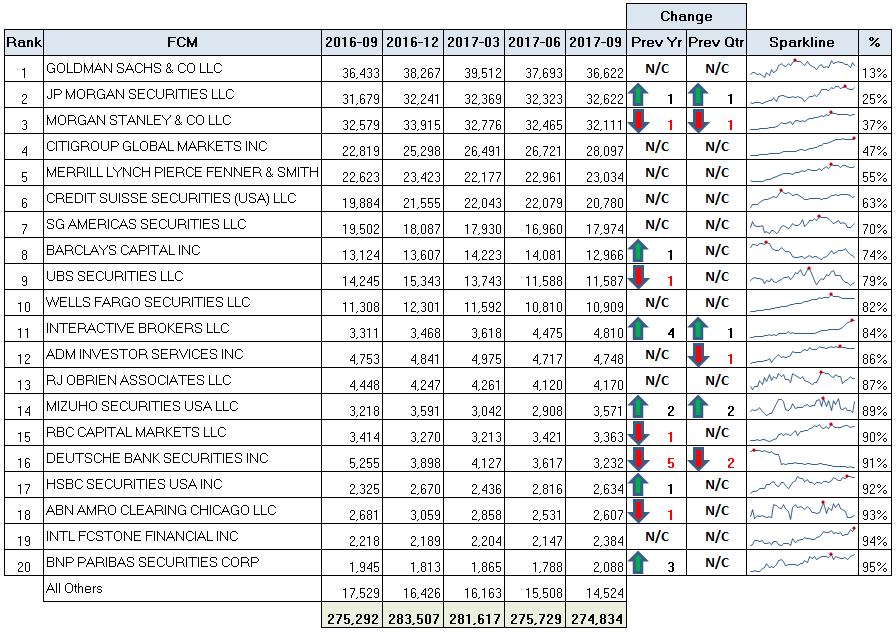
Next is the Seg Futures league table.
Few notable points here can be gleaned from the Sparkline from 2014 to present:
- Citigroup, while up in swaps, has seen a decrease in Futures
- Wells Fargo and RBC with consistent growth, setting another top on their sparklines
- Interactive Brokers (not direct competitors to the bank FCMs above I wouldnt think) also with a clear trend
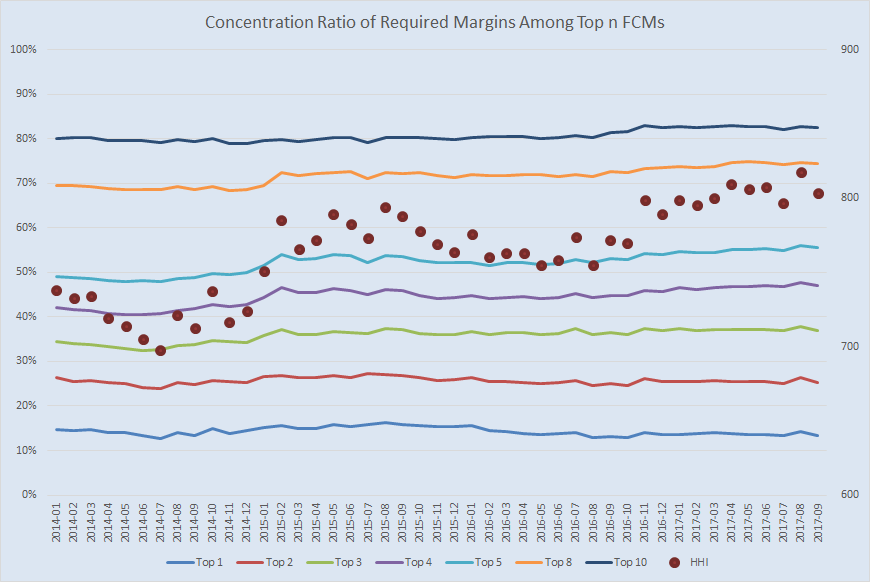
The concentration story here not nearly as sensational:
Overall Combined League Table
And when we put all of these together, we include swaps, seg futures, and 30.7 (foreign futures) into one pot:
And the Concentration ratios:
Summary
What I glean from this quarters data:
- Citigroup with a great increase in swaps funds, however a similar drop in futures (is swaps clearing more profitable now!?)
- Despite the increased concentration in the swaps business, the HHI reading could be interpreted as competitive
- Swaps now only has 8 firms with $1bn or more in customer funds.