In a Galaxy FRA, FRA away….the OTC FRA markets were murky places with no one really knowing how much traded during weekly volume matching sessions, or at what price.
Enter Dodd Frank, Trade Reporting and Clarus Financial Technology.
Now we can produce whole pricing curves from publicly disseminated data. With the right analysis, we can even get a glimpse of the dark side (stop now I will) and work out what positions the market has put on.
As a short-end trader myself, I chortle when the market is so quick to dismiss the data embedded in FRA reporting – to date, I’ve not seen any analysis of the market on the Internet (or elsewhere). And yet, the ECB has cut rates and the FRA market gives us the tools to trade precisely these decisions. Therefore, let’s recap what we’ve seen coming through in both SEFView and SDRView for FRAs.
There is a huge granularity in the data for FRAs that is not captured elsewhere in the Rates world. It is most easily accessed using SEFView. All of the dates traded on the ICAP and TP SEF volume matching platforms are reported, along with their prices, and volumes. This allows us to reverse engineer the whole pricing curve being presented to the market. For example, we can see the evolution of the curves prior to the ECB’s June meeting:
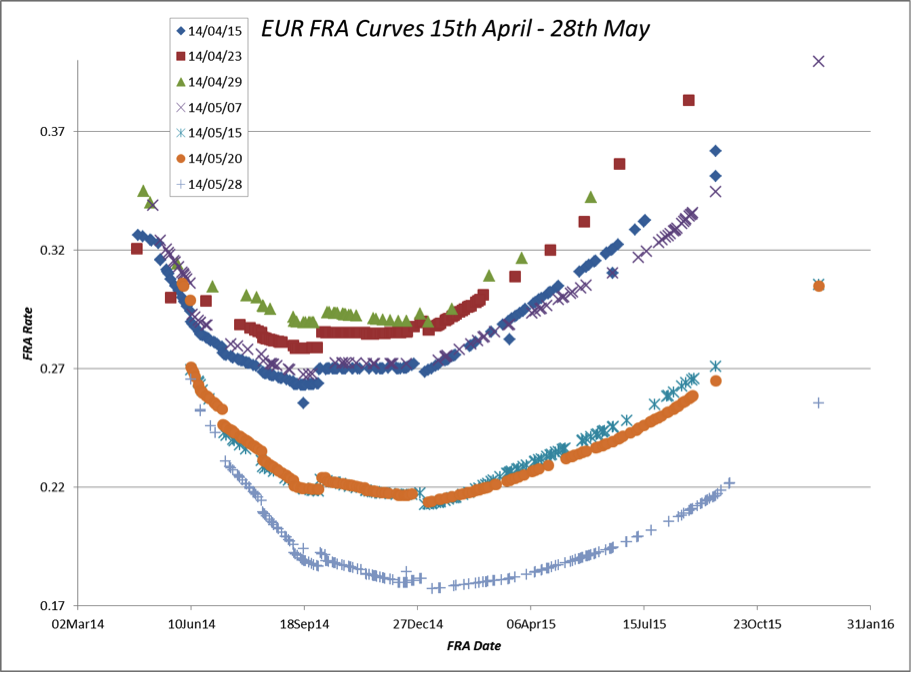
We can see a big re-pricing between the weekly curves as a result of the ECB meeting on 8 May (rates moved down by around 5bps), and this accelerated in the session directly before the June meeting on 28 May (another 4bps).
What of the volumes themselves? Looking at the time series since the start of the year from SDRView, volumes are gradually declining:
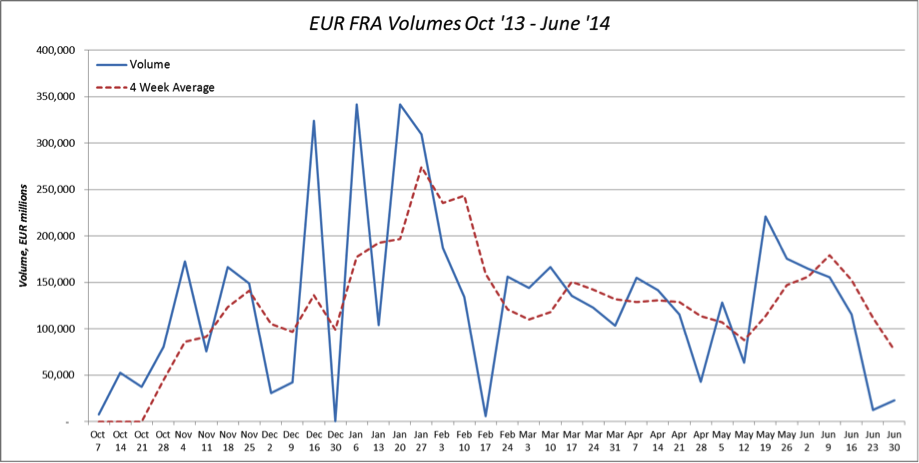
Note the spike in volumes during January. It was a volatile month for interest rate futures, but not significantly more so than March. However, January is a particularly interesting month for FRA traders, with a typical trading strategy evident in the data. Let me explain.
The most difficult part of the interest rate curve to hedge is the one short of the first Interest Rate future. This is the area of the curve most sensitive to actual rate cuts, and yet liquidity is nowhere near comparable to what is available in futures. Generally speaking, in a rate cutting environment, traders want to buy FRAs that fix just after the expiry dates of the quarterly futures, enabling them to have a “received” position in the very short end of the curve. However, this strategy is delayed by a couple of weeks around the “turn” of the year, as cash can trade expensive around year-end, creating the risk of higher fixings. We can see this in the simple volume data above – there was a bout of FRA re-positioning during January.
The most recent data allows us to drill down further into the details. We can see the volumes traded for exact dates. Getting down and dirty with these details, we can see which dates were active whilst the ECB were signalling their intent and ultimately cutting rates:
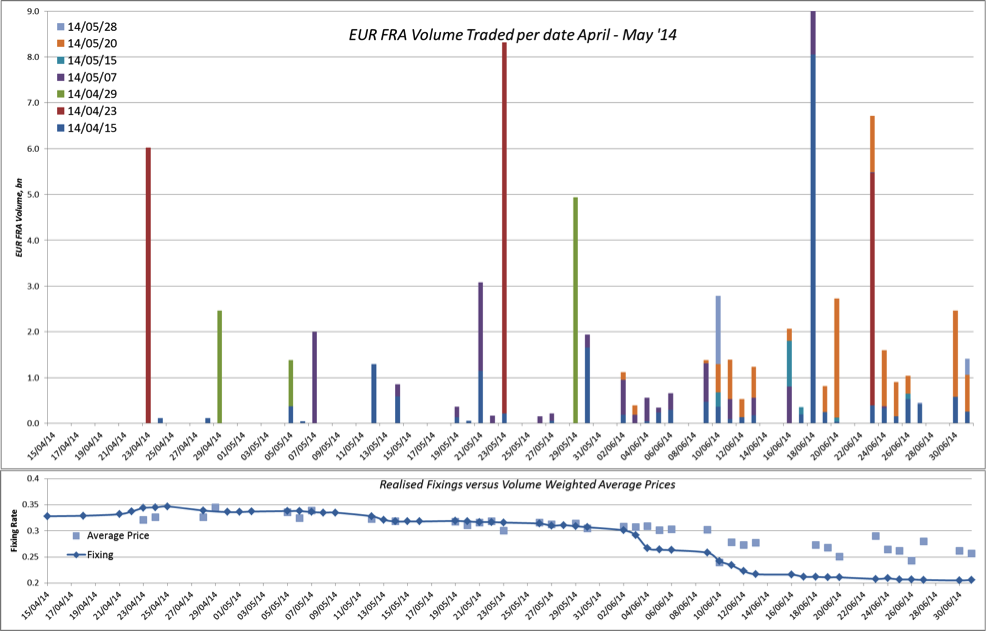
The charts above show the volumes traded per session and per date as coloured bars, whilst the lower chart shows the weighted average price of these trades, plus the realised Euribor 3 month fixing. We can see that:
- The week of 23 April was the most active session for FRAs – before the ECB’s rate signals.
- In the 7 weeks’ worth of data, the Average FRA volume hedged on any given day was approximately €1.4bn.
- The largest volume by far is the IMM date (18 June 2014, €25.7bn traded), as market participants look to move FRA risk into the most liquid buckets.
- One large trade is apparent: a 0x3 vs 1×4 vs 2×5 butterfly trade of €8bn, transacted before the ECB May meeting. For the buyer of this ‘fly, if kept to maturity, the trade would have yielded a PnL of over 11bp, or €2.3m.
- There is a remarkable lack of FRA activity around the ECB dates themselves. The curves in Fig 1 show the discontinuities that are included in the pricing curves – but market participants generally avoid trading on such prices.
- The volume weighted average prices across the trading sessions were higher than the realised fixings. The market did not efficiently price the ECB rates decision, with the 23 June fixing (just after the IMM date) clearing 8bp above the eventual fixing.
- The demand from the market to be “received the stub”, is apparent in the data. This means there is a clamour to buy FRAs that expire just after any IMM roll date in a rate cutting environment. For example, for the 10 days after the June IMM date, the FRA volume traded per day is in excess of €2bn, 40% higher than average.
The evidence of this “stub” positioning presents somewhat of a double-edged sword – and may present the type of positioning that regulators are particularly interested in. On the plus side, it shows that the market is focused on its’ stub positions – particularly important when central banks are active.
However, what if these trades are speculative in nature? We all remember what happens when a credit event occurs – short term rates spike immediately higher, which would hurt the positioning evident in this data. There is therefore a real risk that as volatility continues to decrease, these stub positions get ever larger – both through putting the positions on (as seen in the data) or a reduction in hedging due to the ongoing regularity and margin charges involved in FRA trading. The end result could be a financial system with more risk and traders less prepared for a front-end shock in rates.
Indeed, are we seeing the ECB and regulators unwittingly lay the foundations for the markets’ very own Death Star…?