FX Options clearing volumes data show a marked jump in Q1 2019 – quadrupling cleared notional outstanding from the end of 2018, unlike IR Swaptions and CDX Swaptions, which show little traction. In this article I will look into the detail of this jump in FX Option volumes.
Options Clearing Overview
To recap my prior post, the end of 2018 saw Swaptions clearing come to a standstill. What happened in Q1?
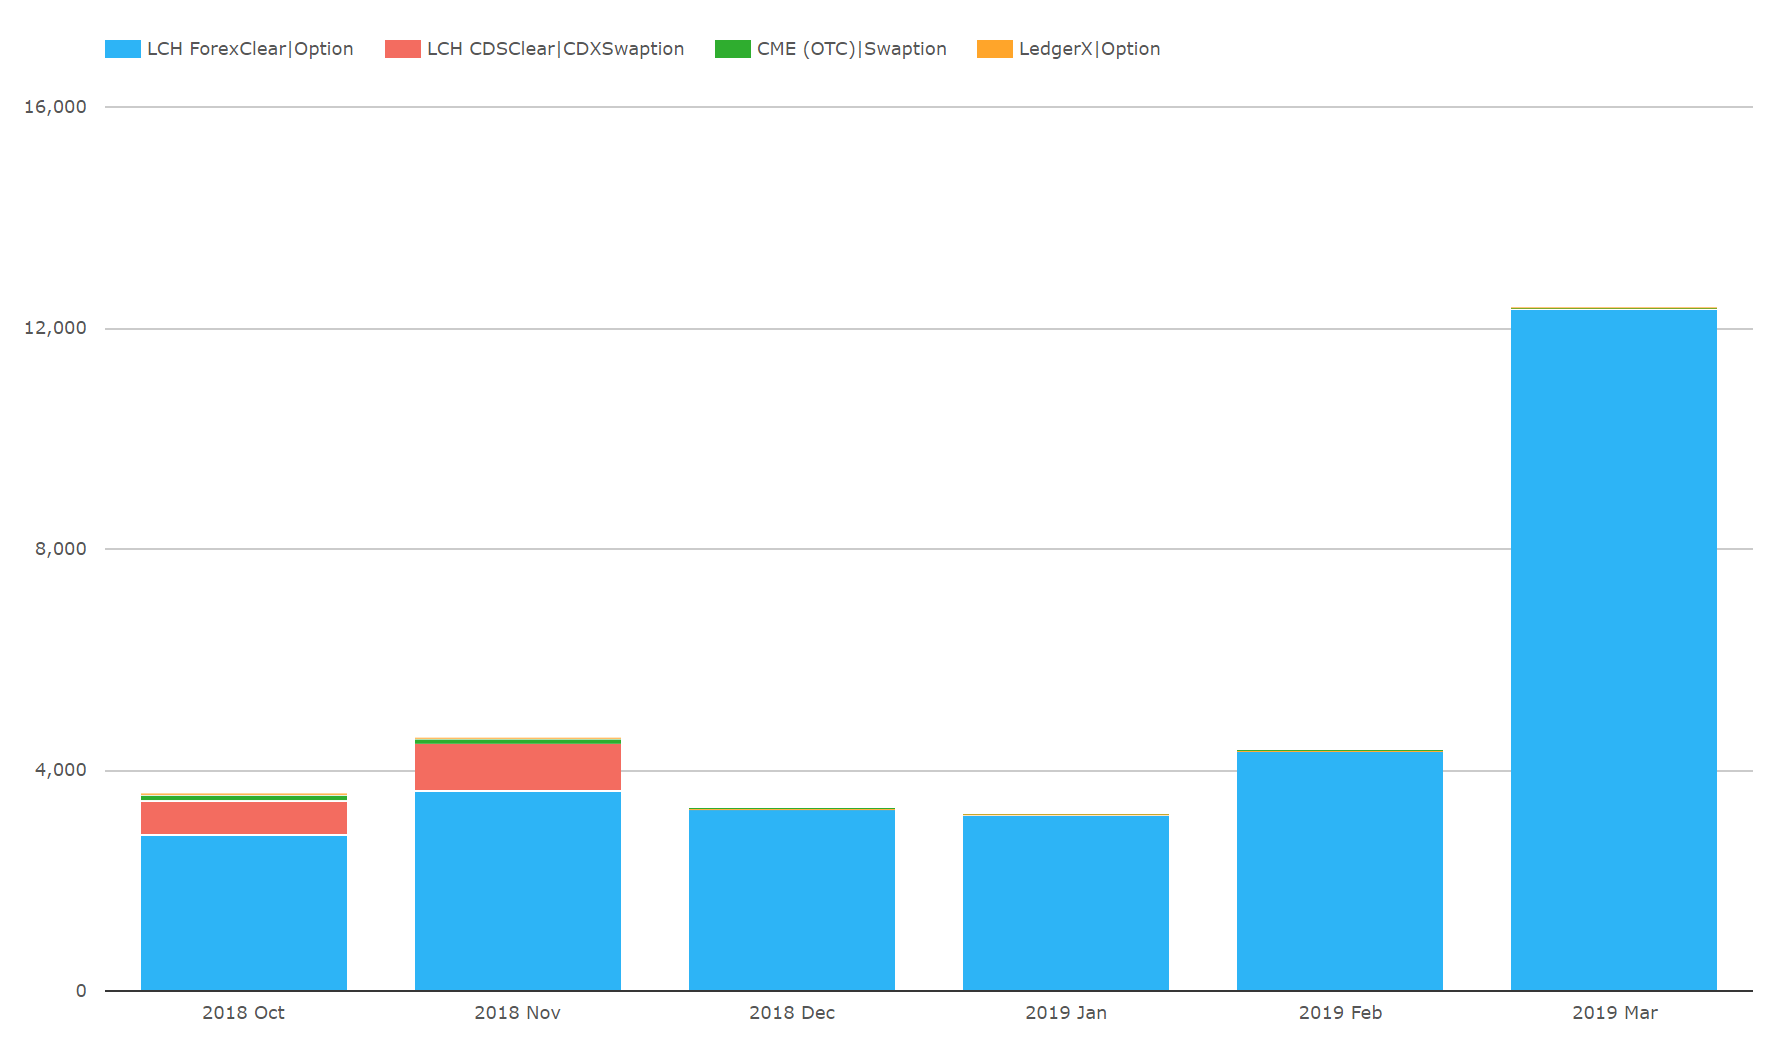
The chart shows:
- LCH CDSClear CDX Swaptionsand CME IR Swaptions remaining absent
- FX Options notional jumping to over $12bn.
FX Option Volumes
So let’s look at FX options more closely.
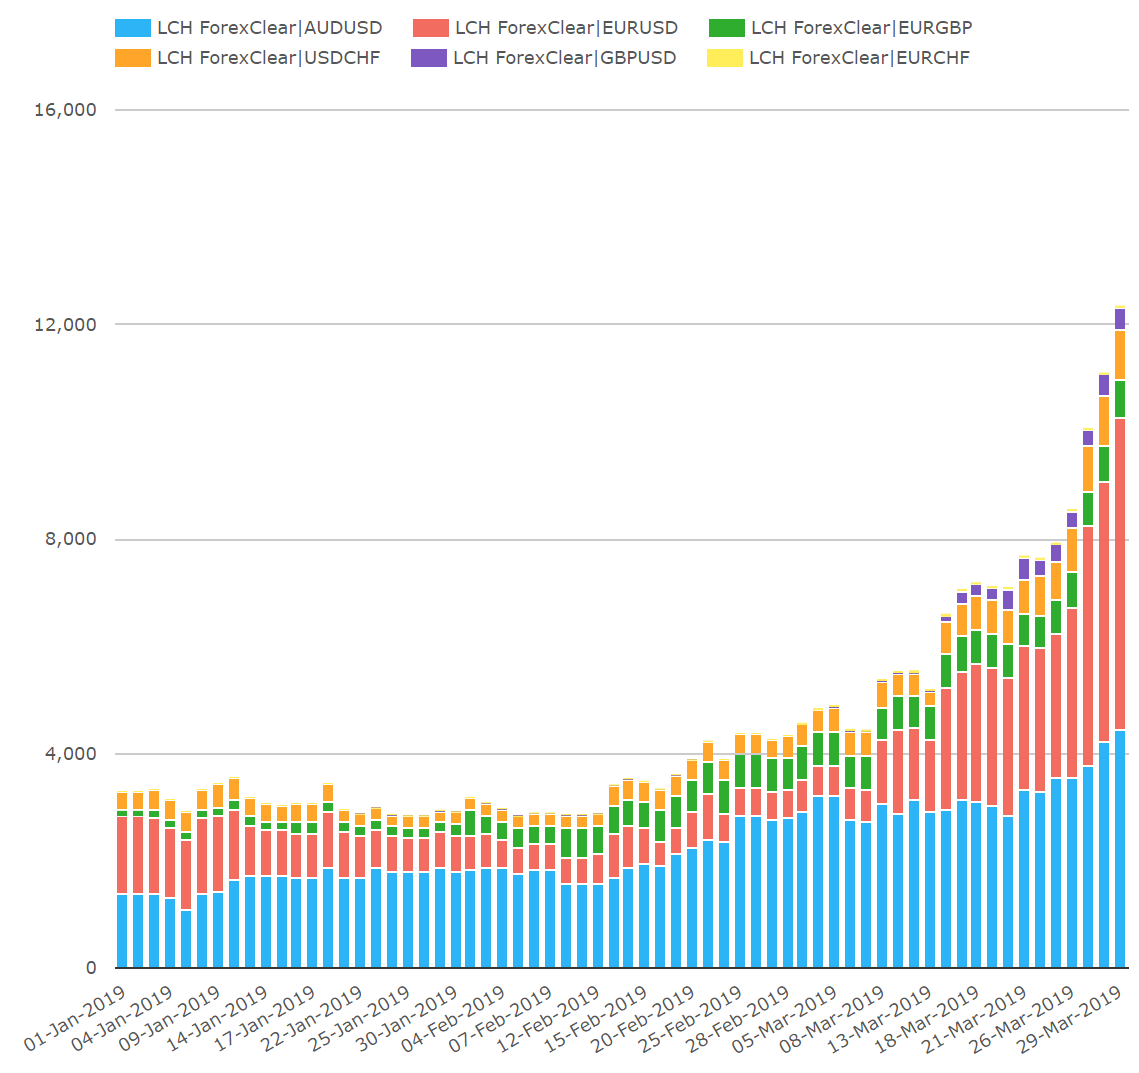
We can see that in late Feb / March:
- Notional outstanding reaching $12bn for the first time on March 29th
- AUDUSD and USDEUR dominating with CHF and GBP pairs forming the balance
- GBPUSD and EURCHF becoming visible
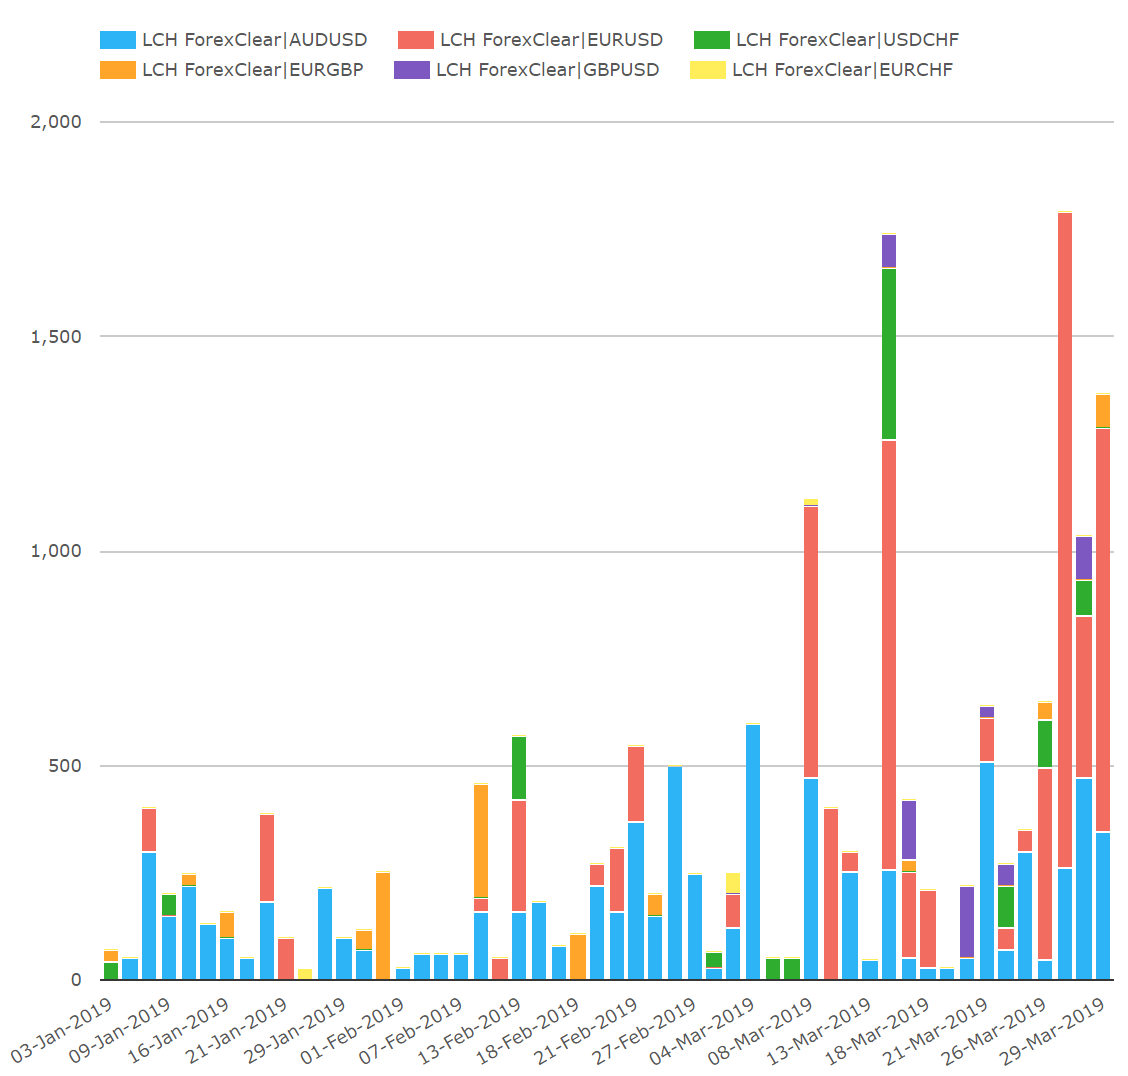
Showing for daily volumes:
- 5 days in March with over $1bn cleared
- Daily peak volumes close to $1.8bn (Mar 27th) of which about $1.5bn was USDEUR alone
- USDEUR and AUDUSD clearing every day for the last 10 business days of March
- Other pairs are more patchy
- JPY is noticeable by absence
So how does this compare with the whole FX options market?
A good start point is to compare with the US market, where we have granular data on same the specific pairs cleared at LCH ForexClear.
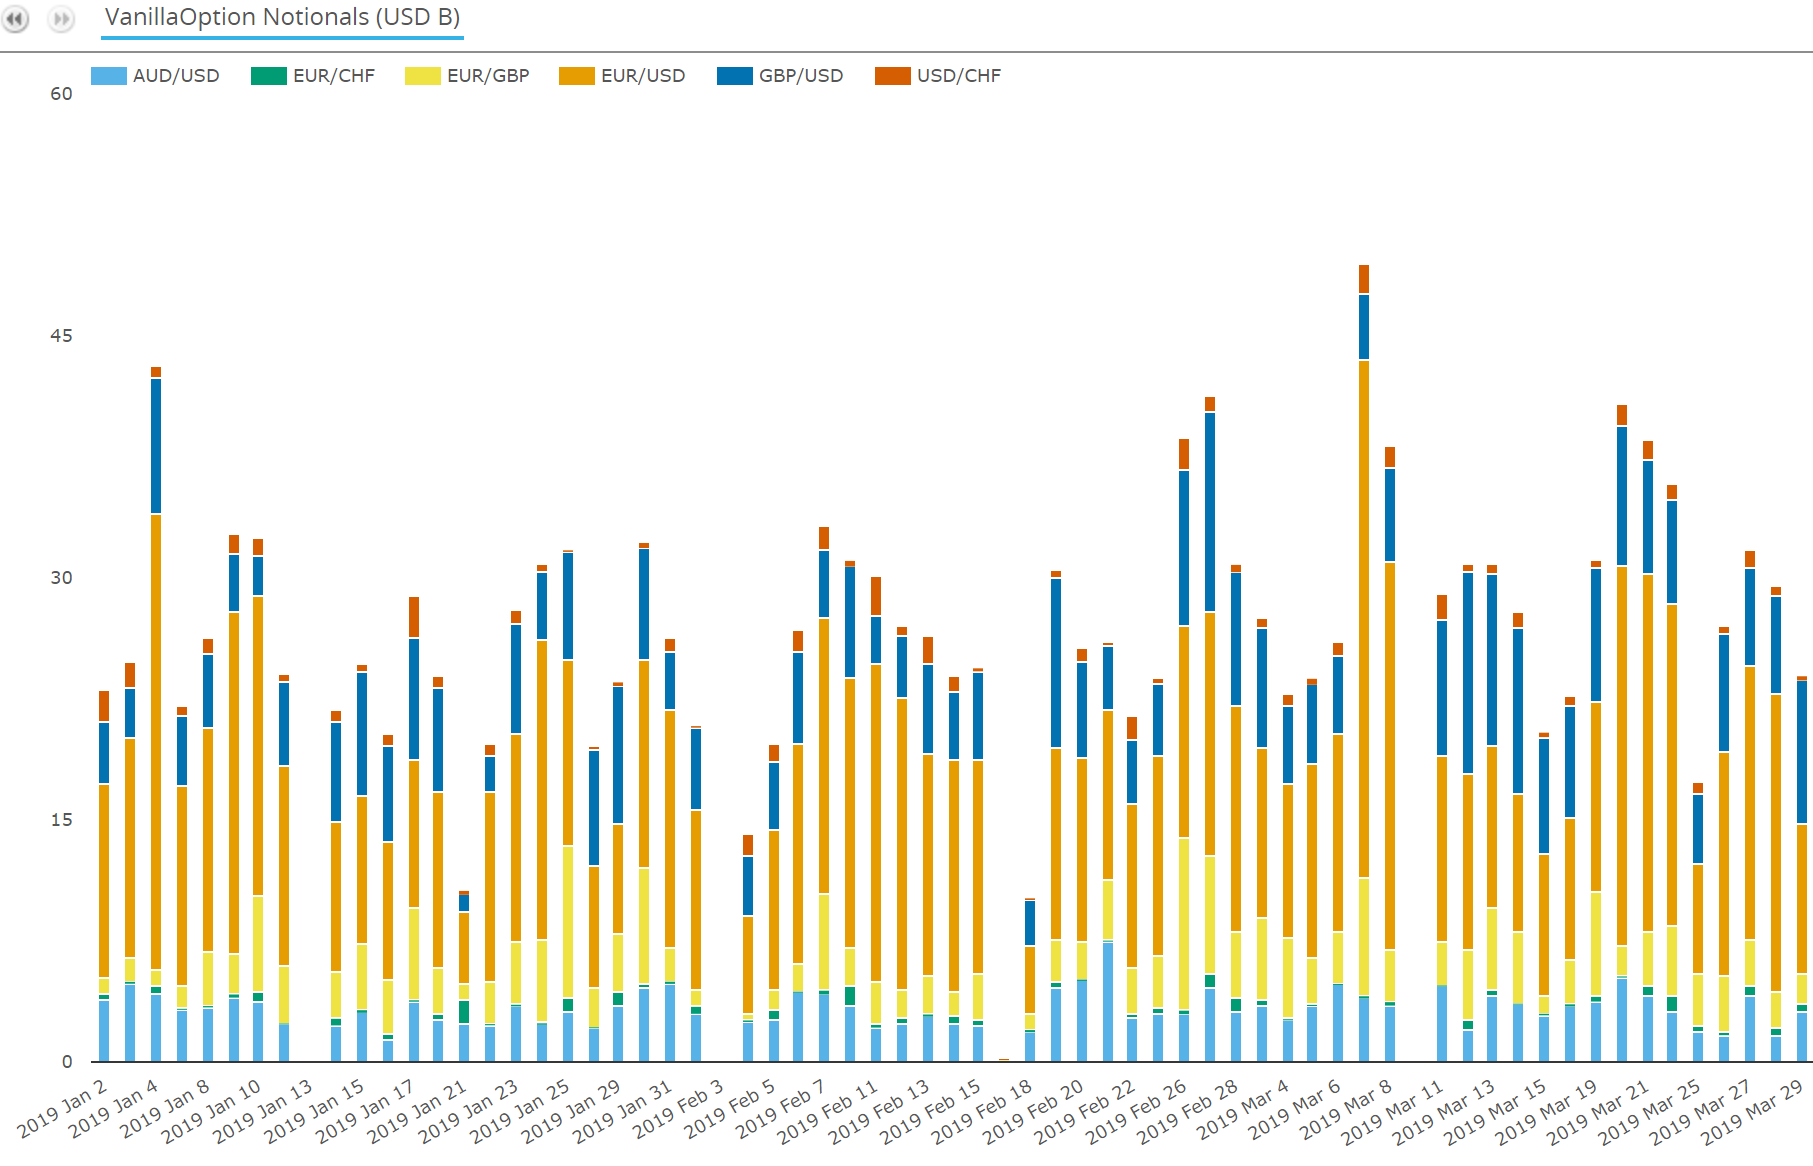
To emphasize this is volume only for the cleared pairs with volume at LCH ForexClear. We can see:
- March average daily notional traded around $30bn suggesting a lot more globally (trades where neither party has a US reporting obligation)
- No apparent correlation of clearing volume with US trading volume
- Clearing is a small fraction (less than 10% of the US total and will be smaller still, <5% as a percentage of the global volume of these pairs).
One final thing as context: the size of the counterparty risk mountain we are climbing here is $13.3tn uncleared FX option notional outstanding as at the end H2 2018 (see my prior post). Here we are showing $12bn cleared notional or $24bn two-sided i.e. on a counterparty risk comparable basis – about 0.2% of the total. Let’s see what the new BIS numbers show in May when released.
Questions prompted by the stats
- Why no JPY? Not sure. USDJPY is the second largest pair in SDR data.
- Have clearing member banks turned on USDEUR and AUDUSD automated clearing? Perhaps – though spiky volumes lead to doubt. At least the last 10 days of March had volume. It is unlikely compression or backloading could be daily. Let’s see what April shows us.
- Are the spikes caused by ad-hoc backloading or periodic compression? Compression vendors are likely on a weekly or twice a week schedule but no pattern is evident in the cleared volumes. The most likely is this is a glut of backloading into quarter end.
- How much of this is quarter end effects vs daily upswing? Hard to tell. We need to see post quarter end volumes to get a feel for this.
- How significant is this? It’s significant that we see an upshift but, for example, 50% of the 13.3tn would be cleared in 2 years if we averaged 15bn a day. By this rule of thumb we need to get to 10x or 20x the current daily clearing volume to believe clearing is a key feature of the solution.
- What’s different about FXD from IRD? FX deliverable pairs in FX forwards and swaps are exempt both clearing mandate and SIMM IM. From my prior post, banks could be using delta hedged trading, risk compression and delta clearing – all much more mature than at the equivalent stage of IRD clearing development. We need to look at NDFs and FX forwards too as ways to hedge SIMM IM FX delta.
Conclusion
Even with the quarter end uptick, FX options trading volumes are still dominated by uncleared trades. The clearing in Q1 was mostly spiky in volume for AUDUSD and USDEUR and patchy for other pairs – suggesting mainly selective backloading to reduce SIMM IM or non-SIMM portfolio ccRWA perhaps specifically into the quarter-end RWA reporting.
However, it’s hard to dismiss such a pronounced uptick and also consistent daily clearing for AUDUSD and USDEUR since it is challenging for compression vendors or bank backloading to run every day.
The next few months will show whether this is sustained and expanded upon or whether it was mainly a quarter end RWA optimization phenomenon. Dealers may still be on the fence – considering whether there is a way to make FX Options SIMM IM efficient without heading headlong into clearing. Or maybe a small group of dealers have turned on automated clearing for AUDUSD and USDEUR FX Options.
In my next post, I’ll look at putting taking my prior post into FX option SIMM IM optimization specifics – including FX options, NDFs and FX forwards – to see if this shows an outline which lines up with the volume statistics.
Take-aways
- LCH ForexClear shows a promising jump in Q1 2019 for FX Options clearing.
- Spiky volumes suggest this is dominated by ad-hoc backloading
- Consistent daily clearing for AUDUSD and USDEUR could mean the turning on of automated clearing by a small number of dealers has happened.
- FXD has regulatory exemptions, in part from SIMM IM and in full from the clearing mandate, which imply different algorithmic solutions for risk reduction than established risk compression runs.
- In a future post I will look into FXD specific analysis on how this may be happening.