Continuing with the theme of Uncleared Margin, I wanted to look at how large the Initial Margin for Uncleared Swaps and Other Derivatives could become at the end point in 2019.
ISDA Research
Lets start with this interesting document from ISDA, Initial Margin for Non-Centrally Cleared Swaps.
In which ISDA estimates that, with the $50 million counterparty threshold in place, total IM will be $800 billion, assuming all firms use approved internal IM models.
Much lower than the wide range of $1.7 to $10.2 trillion without IM thresholds given in the same document.
However as IM thresholds have now been adopted, meaning that a firm only needs to collect IM amounts greater than $50m and similarly for posting, the $800 billion figure is the one to go with.
ISDA Margin Surveys
ISDA’s annual Margin Surveys are another widely read source of data, with the 2015 Survey currently available.
This estimates a $5 trillion value for the amount of collateral for non-cleared derivatives as at Dec 31, 2014.
While Independent Amount (IA), which is synonymous with Initial Margin, is included in the document, there is no estimate of the proportion of this compared to Variation Margin. We may assume that IA is not as prevalent under ISDA CSAs as VM and so VM balances will form the bulk of the $5 trillion figure.
Hopefully in future Margin Surveys, we will start to see data broken out by VM and IM.
Cleared Swaps
While there is BIS data on the outstanding gross notional of derivatives, to get from those to an IM estimate reminds me of the joke about being lost in Dublin and asking a local which way to your hotel and being told “well I would not start from here”. 🙂
So lets turn to products for which we do have good data on Initial Margin; Cleared Swaps.
CCPView has the latest CPMI-IOSCO Disclosure data for Swaps IM.
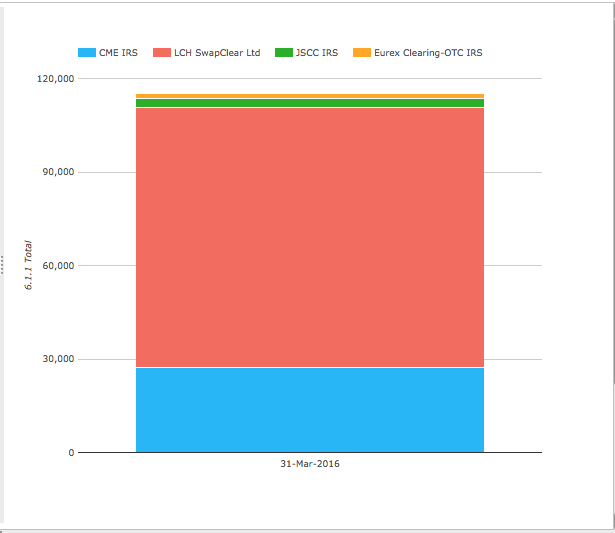
Showing a total of $115 billion, the majority at LCH SwapClear, followed by CME.
Next Credit Default Swaps.
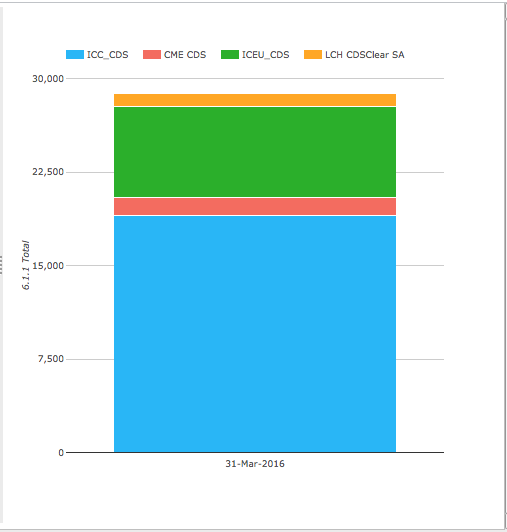
Showing a total of $29 billion, the majority at ICE Clear Credit.
So lets call the sum a grand total of $145 billion of IM for Cleared IRS and CDS.
Can we compare this to the $800 billion ISDA estimate?
Not without some adjustments.
Margin Period of Risk
We know that the above CCPs use a 5-day margin period of risk for IM, while UMR require a 10-day period.
Assuming a normal distribution (well have to assume something), we need to increase the $145 billion by the square root of 10 over 5; which comes to $205 billion.
So we are moving in the right direction to get closer to $800 billion.
Product Netting vs Counterpart Netting
As just three CCPs dominate these products, there is significant netting as all trades held by a firm in that product in any clearable currency are netted together before IM is determined.
Contrast this with Uncleared trades, where all my trades with a counterpart may net, but I have a large number of counterparts. Given the $50 million threshold, this should not be thousands but may be hundreds of separate netting sets.
Unfortunately I don’t know of a good way to estimate the ratio of product netting to counterpart netting that reflects reality, except to say that we should be scaling up the $205 billion.
This gives us the Cleared part of OTC Derivatives but what about the UnCleared part; Swaptions, Cross Currency Swaps, FX Options, Equity Options, Commodity Options etc that we need to include?
Listed Derivatives
One idea is to look at how large the existing Listed Derivatives market is and draw a comparison with that.
CCPView has this data for the the largest CCPs.
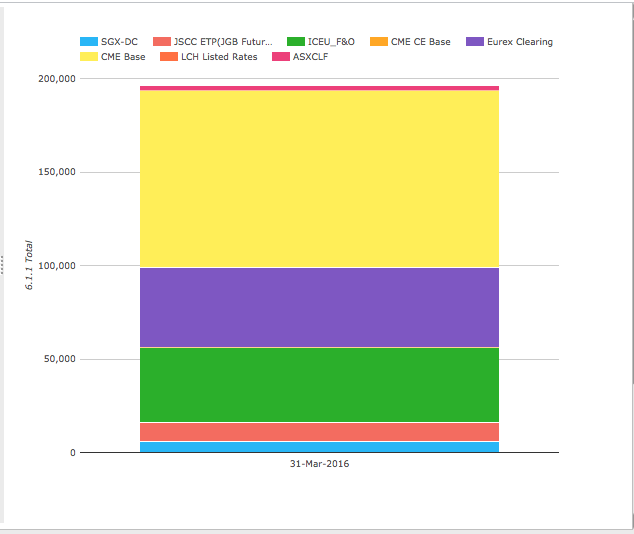
Showing a total of almost $200 billion, the majority at CME, then Eurex and ICE.
These products predominantly use SPAN with an MPOR of 1 or 2 days.
Assuming 2 days, we need to scale the $200 billion by the square root of 10/2, giving us $450 billion equivalent.
Lets assume that UnCleared OTC Derivatives are equivalent to this.
Cleared OTC and Listed Derivatives
Combining these figures we get $650 billion as a number to compare with the $800 billion ISDA estimate.
And given the comments above on scaling up for counterpart netting versus product netting, we would scale up the $650 billion, if we could get an estimate of this factor.
So the two numbers are ballpark.
And the ISDA estimate of $800 billion, looks a reasonable one.
Final Thoughts
It will be interesting to see how Uncleared IM develops over time.
No doubt ISDA Margin surveys and other research will provide this data.
It will also be interesting to see if Cleared IM increases in this period.
Driven by the efficiency of Clearing.
CCPView data should give an insight into that.
Lets take at look at LCH SwapClear volumes for Inflation Swaps.
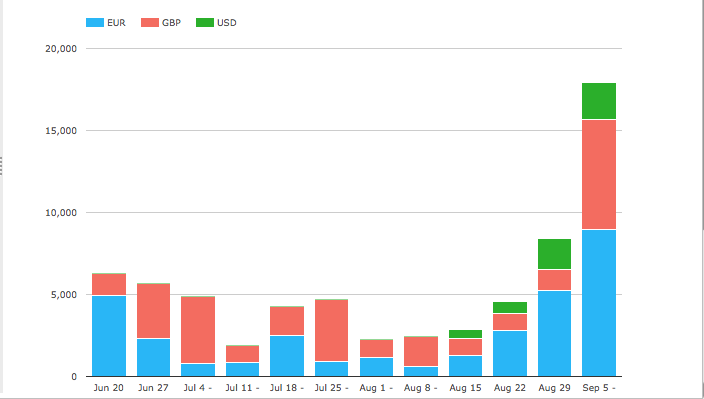
Significant increases leading up to 1 September 2016, the first date for UMRs in the US.
Volume in the week starting 5 Sep at $18 billion, has increased from $5 billion or below in prior weeks.
A product shifting from Uncleared to Cleared for margin benefit?
Could be a sign of things to come.
Only time will tell.