We last looked at ISDA SIMM Concentration Thresholds in January 2017, when ISDA SIMM version 1.2 introduced the concept. That blog detailed an Excel implementation of the concentration threshold calculation for interest rate delta risk and proved very popular. The methodology in SIMM v2.2 remains the same, just the thresholds themselves are changed.
Today I will look at how the SIMM concentration thresholds compare with Liquidity AddOns for Cleared Swaps margin, each of which serve the same purpose; increasing margin for large concentrated risk exposures.
Overview
From the ISDA SIMM methodology document, we can extract the following:
The Concentration Risk Factor (CR) serves to increase the risk weights and is determined per currency using the equation above; which states to take the absolute value of the sum of all deltas in each currency and divide by the Threshold (Tb) for the currency and take the maximum of either the square root of this term, or 1.
SIMM v2.2 has calibrated Tb for each currency according to the table below:
Initial Observation
In the January 2017 blog, we stated that the $250 million per basis point, as it then was for USD, EUR & GBP was huge and we had to create positions that were a bit ridiculous in size to see the effect. That remains true with the threshold in SIMM v2.2 at $230 million.
Put another way, a threshold of $230 million per basis point means that for a 50 bps rate rise, such a position would gain or lose $11.5 billion! There can’t be any derivatives portfolios with that size of risk, certainly not uncleared OTC derivative ones, as the largest derivatives IR delta or DV01 is from interest rate swaps, which are a cleared product.
Which brings me to the gist of todays’ blog; how do SIMM concentration thresholds compare with liquidity risk add-ons in cleared swap margin models.
LCH SwapClear IM
As a comparison I will use LCH SwapClear margin, which I can run in CHARM or the LCH SMART tool.
Let’s take a simple USD 10Y IR Swap with DV01 of $100,000 (roughly $100m notional).
The SIMM risk weight for regular volatility currencies and 10Y is 51, so the SIMM margin is $5.1 million.
The average of pay and receive fixed 10Y IRS of $100K DV01 at LCH, is $4.3 million. (We need to average as SIMM IM is the same for pay or receive, while LCH and other CCPs use Historical Simulation, which results in a different IM for pay vs receive, depending on the history of up and down moves).
So $5.1 million vs $4.3 million, makes the SIMM margin 18% higher than LCH, which look reasonable given the 10-day vs 5-day margin period of risk and 99% VaR vs 99.7% Expected Shortfall used by these respectively.
IM as DV01 increases
Lets now increase the size of our 10Y DV01 from $100k, to $1m, $5m, $10m and beyond and plot the LCH SwapClear IM (average of pay/rec) versus DV01.
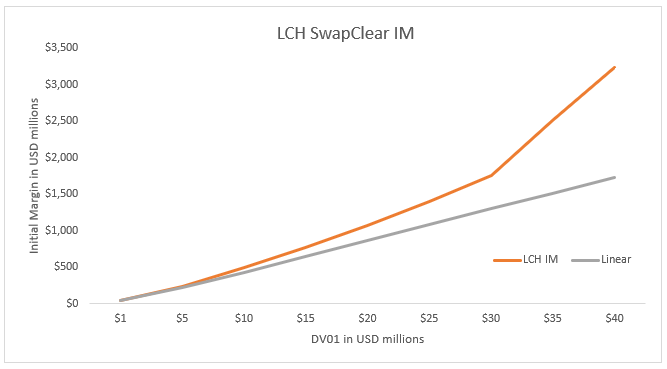
The grey line, marked Linear, is the IM for $100k DV01 scaled to $1million, $5million, up to $40 million, while the orange line, marked LCH IM is the actual IM. This shows the behaviour that we would expect, an increasingly large position attracts an increasing liquidity addon (the lines diverge) and at very high values such as $30 million DV01, the increase becomes markedly steeper.
Next lets add the SIMM margin line to this chart.
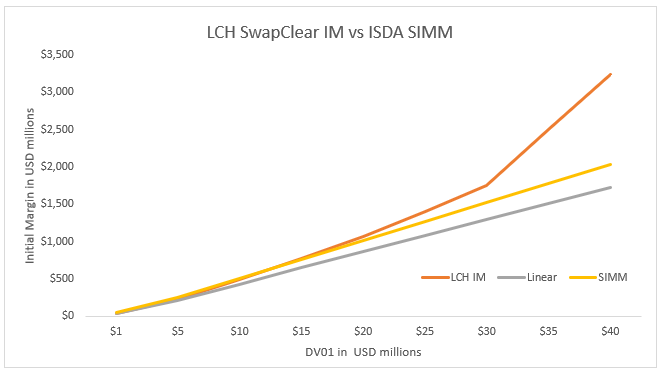
The SIMM margin increases linearly, so the margin for $40 million DV01 in USD interest rates is simply 400 times the margin of $100k DV01. It is only when we get to more than $230 million, that this relationship would no longer hold for USD interest rate risk. (For other currencies the threshold vary for AUD it is USD 30 million DV01, for MXN is is USD 6.9 million DV01).
Next lets plot the ration of SIMM IM over LCH SwapClear IM by DV01.
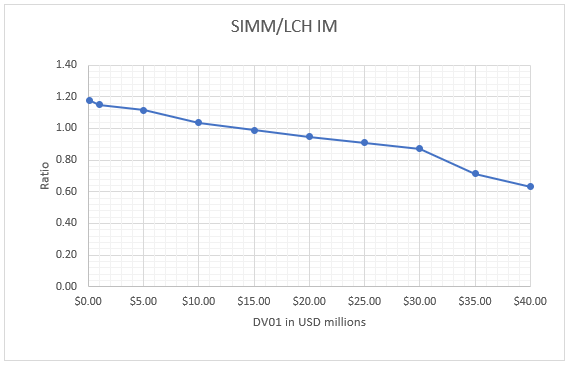
The interesting point in this graph is that somewhere close to $15 million DV01 the ratio falls below 1.0, meaning that SIMM margin becomes lower than LCH IM.
Not desirable behaviour and generally either as a best practice recommendation or a regulatory requirement in some jurisdictions, firms captured by UMR should ensure that the margin they collect is at least as high as an equivalent cleared margin for the same risk.
If you need help with that, please reach out to us for demo of CHARM, as real portfolios introduce much more complexities to correctly model.
Final Thoughts
I don’t want to overstate this as an issue, as $15 million DV01 is huge and I very much doubt that any firm has anything close to such a number in any of their UMR margin agreements.
Even $2 million would be large and firms are unlikely to approve such large counterparty credit limits, even less so for uncleared OTC derivatives such as Swaptions, Cross-Currency Swaps, CapsFloors, Callable Swaps and Exotic Rates Derivatives.
So the Threshold of $230 million is not a pressing issue, but a low priority one, however it is one that stands out conspicuously when compared with cleared margin models. We do expect that in future calibrations, ISDA SIMM working groups will lower this and other currency interest rate risk thresholds.
Did I mention the IR Vega Concentration Threshold of $2.3 billion?
Another one to look at in a future blog.
January 2017 to November 2019, almost a 3 year gap in our two blogs on this topic.
I wonder if I will get there before the next ISDA SIMM calibration of concentration thresholds.