- Total Initial Margin across the industry now stands at $1,394bn an all time high.
- Initial Margin requirements across the industry have increased by $959bn since 2016.
- Uncleared Margin increased particularly sharply in the past 12 months, probably as a result of the two recalibration exercises of ISDA SIMM in v2.5 and v2.5a.
- We look at the latest ISDA and CCPView data.
Initial Margin
ISDA have just published the latest edition of the “ISDA Year-End Margin Survey”:
We have covered previous versions of this survey, which are always worth a re-read because you can laugh at any predictions we made in the past!
- IS NOW THE TIME TO OPTIMISE YOUR INITIAL MARGIN?
- FOR THE FIRST TIME, WE SEE OVER $1TRN IN INITIAL MARGIN
- HOW MUCH MARGIN? 2019 EDITION
- ISDA MARGIN SURVEY 2018
- MARGIN FOR NON-CLEARED DERIVATIVES (2017 Margin Survey)
- HOW LARGE WILL INITIAL MARGIN BE FOR UNCLEARED SWAPS?
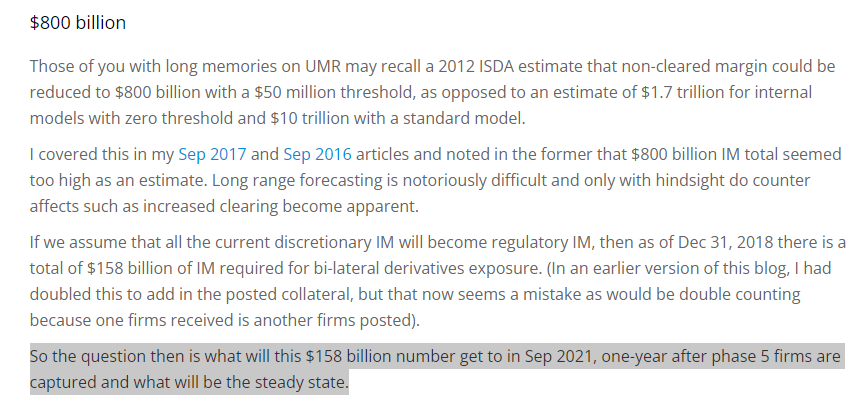
Sifting through all of those reveals that between $650-800bn in extra IM was anticipated by ISDA as a result of the Uncleared Margin Rules:
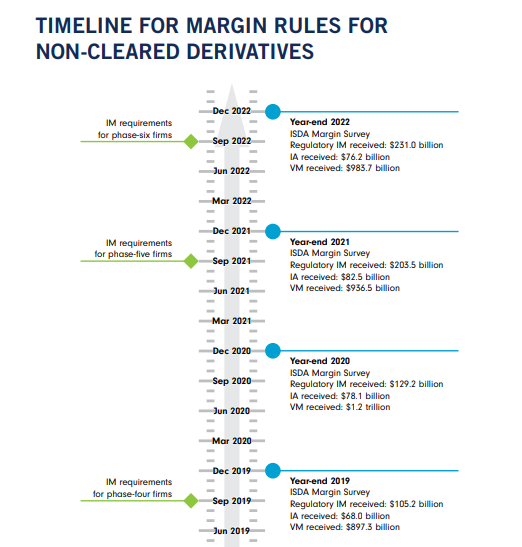
The final roll-out of the Uncleared Margin Rules took place back in September 2022, with Phase Six firms going live in September of that year. I still find the ISDA timeline a helpful resource to look at how impactful each Phase has been in terms of Initial Margin:
$462 Billion
Summarising the latest ISDA report in 4 bullets is pretty straight-forward this year:
- The survey covers 32 firms – 20 phase-one, five phase-two and seven phase-three entities (which is the same as in 2021).
- (In total, there are six phase-two and eight phase-three entities. So who are the only two hold-outs not participating in the survey? I think we should name them!)
- These 32 firms collected $462bn of Initial Margin in 2023.
- This is a 42% increase (+$136bn) on last year (2022 saw $326bn collected – see my previous blog here).
The chart nicely shows the huge increase we saw for uncleared initial margin in 2023 – the largest on record. It is highly likely that most of this is due to the recalibration higher of interest rate risk weights that Amir covered under ISDA v2.5a.
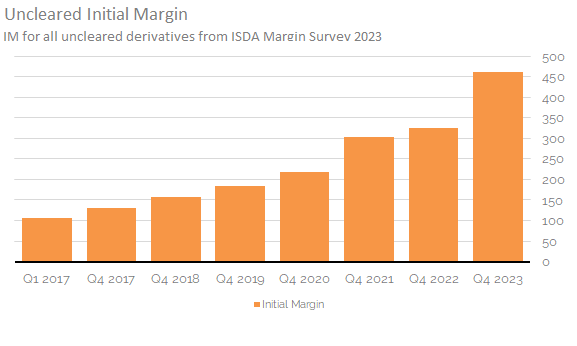
The Clarus chart above shows;
- Total Uncleared IM has more than doubled in the three years from 2020 to 2023, from $218bn to $462bn.
- The increase from 2022 to 2023 was the largest increase on record, despite the fact that no new counterparties were captured by the rules (unless they only went over the thresholds after the September 2022 implementation date).
- Recall that the last big jump we had was in 2021. This was largely due to the increase in number of covered counterparties, with Bloomberg quoting 196 more “firms” (potentially covering more than one legal entity each) being covered as of September 2021.
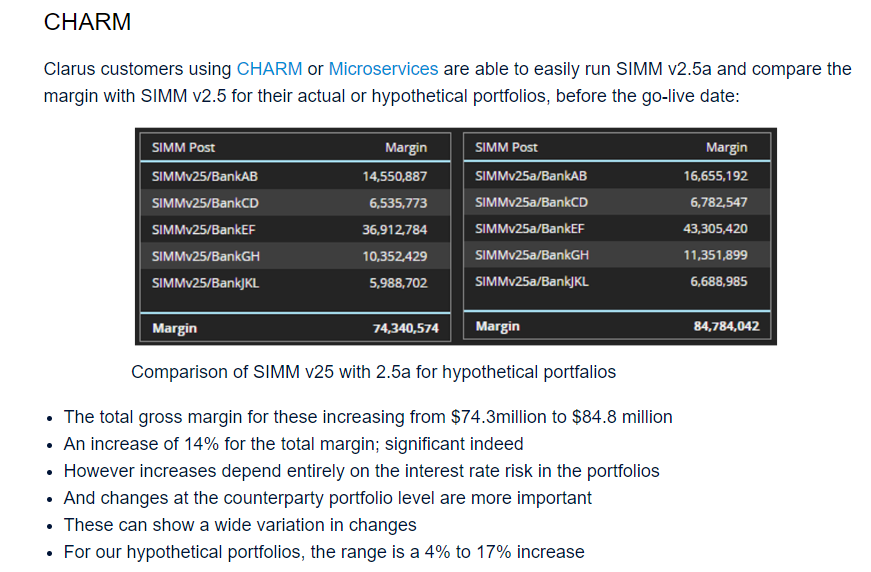
These figures will have captured the recalibration (higher!) to ISDA SIMM that occurred with both v2.5 and the first ever “off-cycle” recalibration in v2.5a. For more on the changes, and how CHARM is used by firms to analyse the effects of these calibration exercises, please see Amir’s earlier blog:
Total Initial Margin is nearly $1.4Trn
This large increase in Uncleared IM also needs to be put in context with what has happened in other product areas over the same time period. How did Initial Margin change in Cleared OTC Derivatives and in Exchange Traded Derivatives (futures)? Maybe the Uncleared Margin Rules are causing more counterparties to choose Cleared products (to enjoy more netting for example)?
CCPView provides all the data you could ever need on Initial Margin. Since 2016, CCPView shows the following:
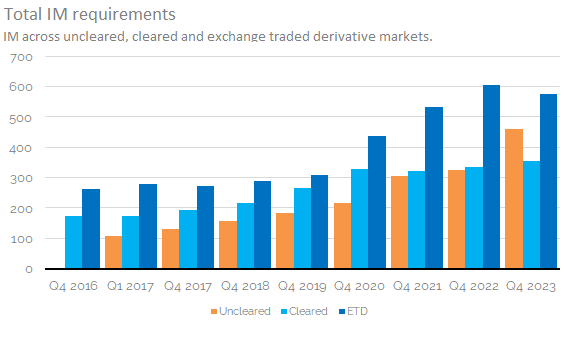
Showing;
- From 2022 to 2023, uncleared IM increased by $136bn to $462bn (+42%).
- Cleared IM increased by $21bn to $356bn (+6%).
- Both Cleared and Uncleared IM amounts are new year-end records.
- ETD IM decreased by $30bn to $575bn (-5%).
- Total Initial Margin now stands at $1.394Trn.
- The total IM in the market increased from $1,267bn in 2022 to $1,394bn in 2023, a total increase of $127bn (10%).
Putting further context on this, let’s look at how the relative portion of the IM burden has evolved:
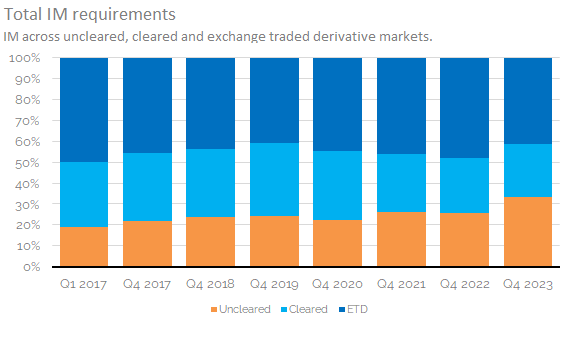
Showing;
- Uncleared IM made up 26% of the total IM burden when we last looked at this for 2022.
- This has risen, and now rests at 33% as at the end of 2023.
- Cleared OTC accounted for 26% in 2022 and remained at 26% in 2023.
- The share of IM posted versus Exchange Traded Derivatives (futures) continues to decrease. It was at 48% in 2022 and has now decreased to 41% of the total.
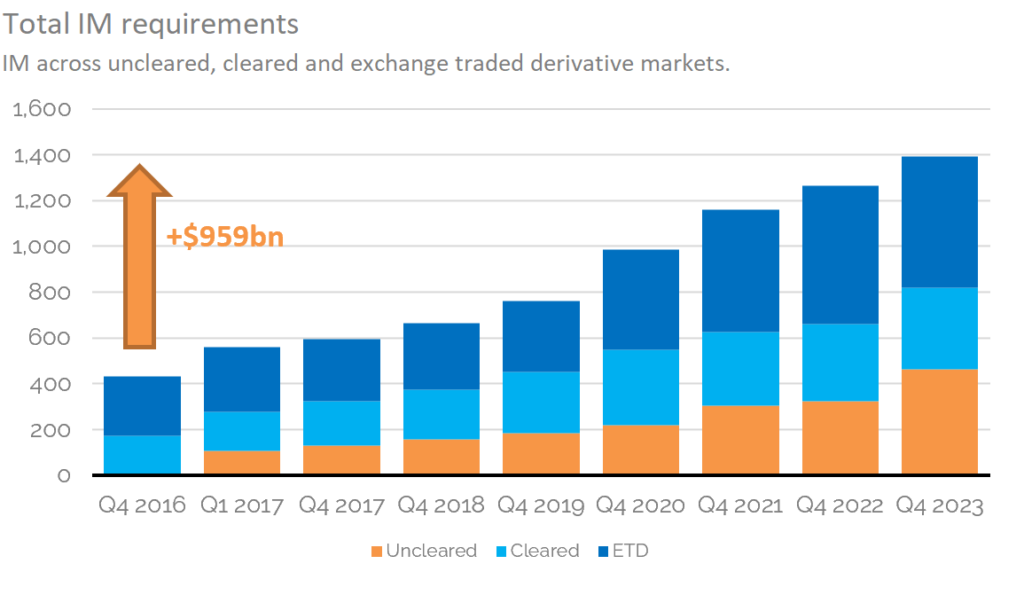
Total Initial Margin
As stated earlier, we looked at the ISDA estimate of “$800bn” in IM, and thought maybe $650bn was more reasonable. As highlighted above, we should not only look at the amount of Uncleared IM. This is because the Uncleared Margin Rules are as much an economic mandate to clear as they are to generate more IM in uncleared markets. What we can say is that between Q4 2016 (when there was no bilateral IM) and the end of 2023 the total IM collected by the derivatives industry has increased by $959bn:
In Summary
- Total Initial Margin now stands at $1,394 billion.
- This has increased by $959bn since 2016.
- The biggest contributor to the increase in IM from 2022 to 2023 was Uncleared OTC derivatives (+$136bn, 42%).
- It is notable that Initial Margin posted against Exchange Traded Derivatives decreased by 5% during the same time-period.
- Most of the increase in Uncleared IM is likely due to the recalibration higher of interest rate risk weights that occurred in ISDA SIMM v2.5 and v2.5a.