- Uncleared Margin Rules (UMR) come into effect as of 1st September
- So let’s play a fun little game.
- Take the SDR data for Uncleared Derivatives.
- Import this data into CHARM, our Initial Margin and Risk tool.
- Make a few broad assumptions about the trades and the Dealer market.
- We end up with an estimate of how much IM each Dealer will have to hold under the new UMRs.
- This number is calculated on the basis of 1 month’s worth of trading. Positions will only gross up over time.
- There is no way to arrive at a correct answer, but we will show some of the issues along the way.
Uncleared Margin Rules
This article from Bloomberg is a decent overview of what is going on with the uncleared margin rules. In short, it’s possible that US and Japanese swaps dealers will have to begin posting Initial and Variation Margin against uncleared derivatives as of 1st September. Amir’s blog this week covers some of the detail.
Below, we look at the numbers. How much Initial Margin could the incoming rules require?
Collecting the Data
We use SDRView to extract all Fixed/Float swaps that went uncleared during the month of July 2016. Using TenorView, we see the chart below:
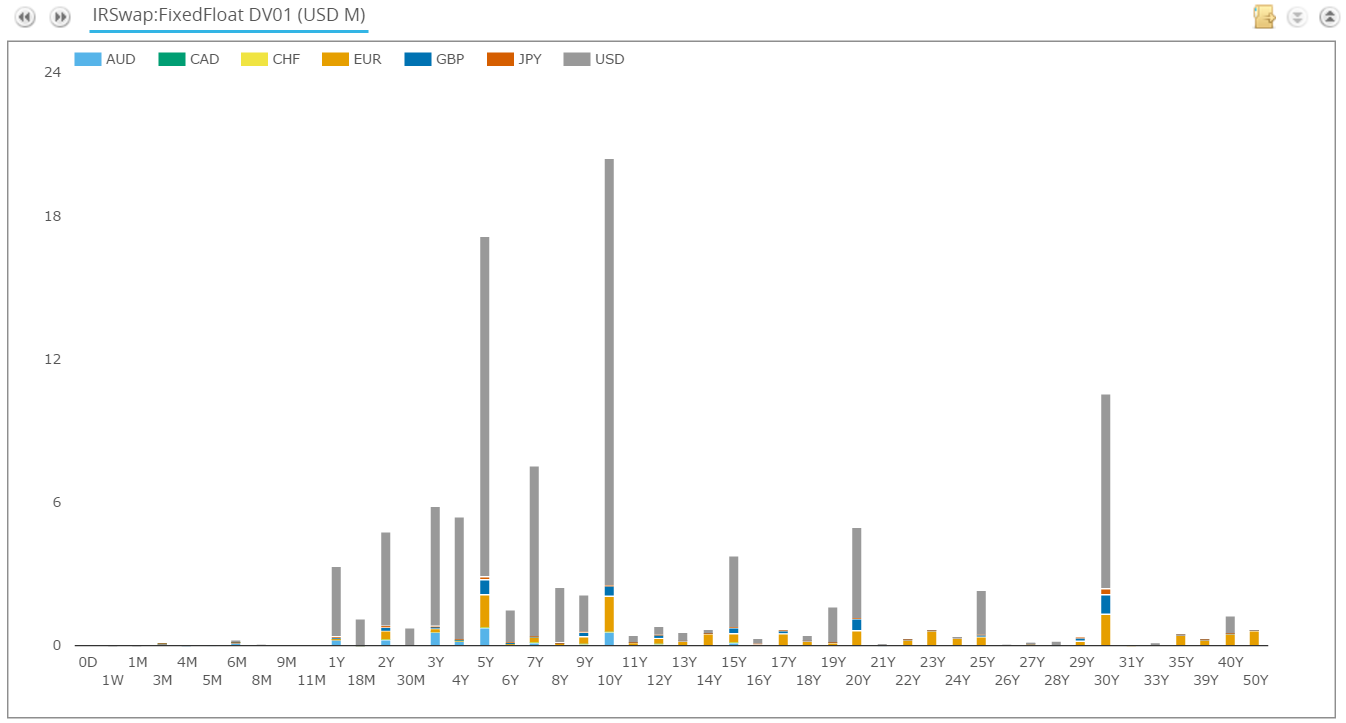
Showing;
- A total DV01 of $104.77m.
- There were 4,629 trades during the month for vanilla Fixed/Float IRS in AUD, CAD, CHF, EUR, GBP, JPY and USD swaps.
- By both DV01 and trade count, 80% of the trades were in USD (grey bars above).
Putting those numbers into perspective, there was over $1.4 billion in DV01 traded for the Cleared market. That means we are talking about less than 10% of the overall market. That makes it sound quite manageable. Will the IM also be manageable?
How much risk?
In trying to estimate how much IM these uncleared trades will generate, we need to make some allowances for the data:
- We do not know the direction of each trade
- We do not know the identities of the counterparties to the trades
We therefore have to make some assumptions. For the purposes of this blog I have randomly assigned pay/receives to each trade in the SDR. Equally, I have randomly assigned each trade to one of 15 “dealers”. This means that the market as I have modelled it is not risk neutral – this seems a fair assumption to make to me, because some of the risk will have been recycled into Cleared products anyway.
How much margin?
The data does not tell us what model will be used to calculate bilateral IM. To make comparisons with the Cleared market simple, we will use a simple HistVaR Expected Shortfall model, which is broadly in line with how LCH and CME calculate margin. We maintain the 5-day observation window, so strictly speaking we should multiply these numbers by √2 to allow for the 10-day observation period in bilateral space. But I’m trying to keep things simple here!
The Overall Market
The simplest place to start is to assume that all trades are conducted by one dealer and a single client. We can therefore upload all 4,600+ trades into CHARM and look at both the risk and the Initial Margin:
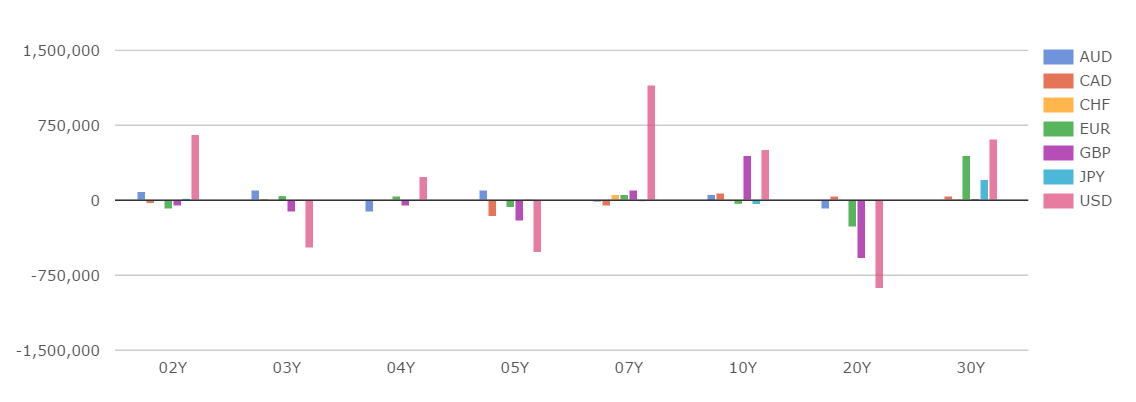
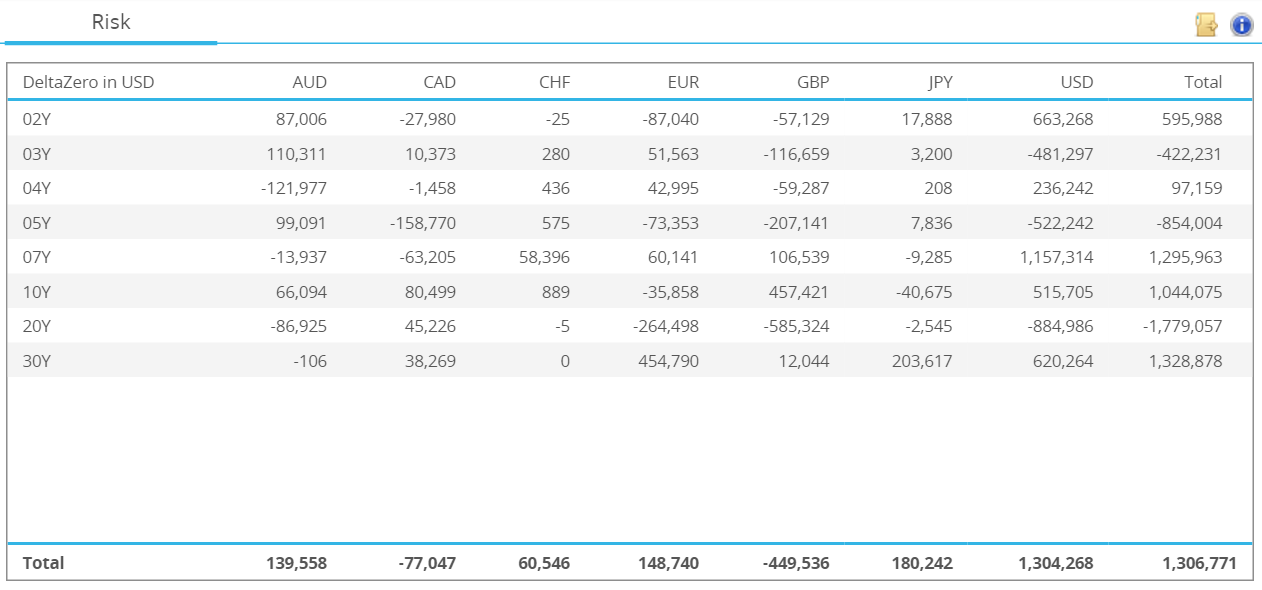
As we can see, we have a net delta of “just” $1.3m in DV01. This is concentrated in USD, as we would expect. What does this risk profile give us in terms of IM?
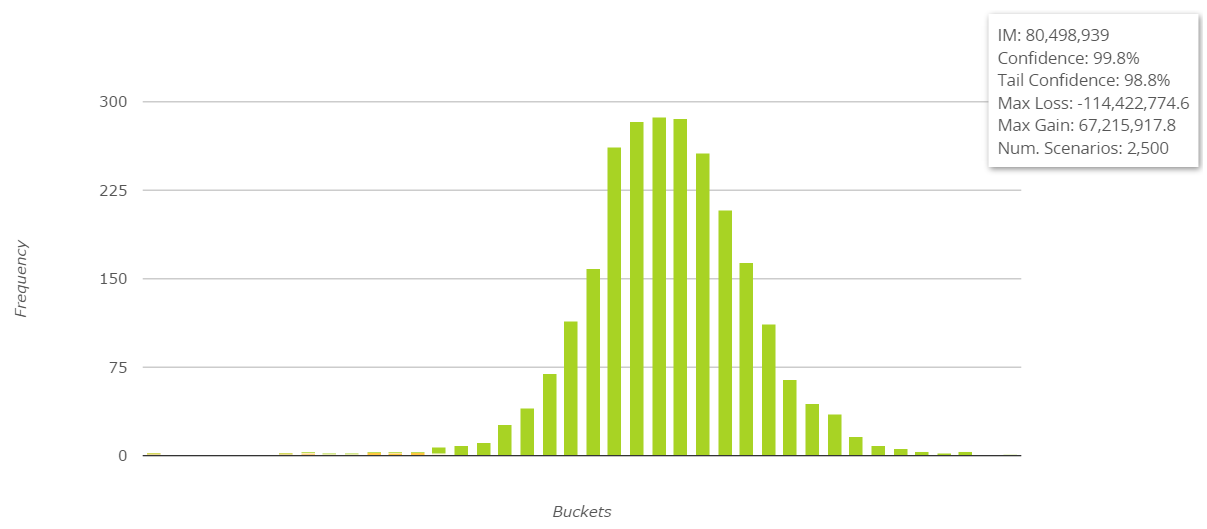
Grossing it Up
This IM figure of $85m makes an unrealistic assumption that all trades are done between one dealer and one client. We clearly need to refine this.
So let’s confine the market to 15 active dealers. We can split the portfolio, again randomly, amongst these 15. In doing so, we fundamentally change the IM number calculations. The results per dealer are shown below:
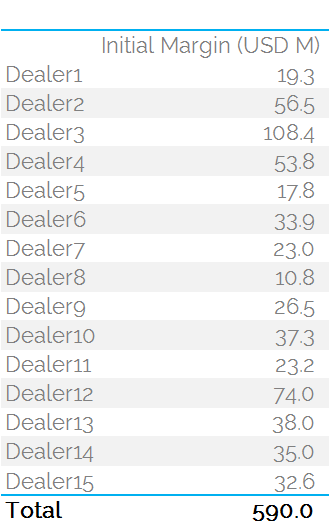
These figures are not necessarily intuitive. But splitting this risk across 15 dealers results in an IM figure across the network of $590m – nearly 7 times greater.
This is because offsetting risks between portfolios can no longer be netted together.
Exercises like this bring to the fore the economic importance of netting. Offsetting as many similar risks as possible is paramount to effectively manage IM exposure.
But there’s even more grossing up to be done….
The increase in IM from $85m to $590m occurred because we considered the existence of 15 dealers across the network. This resulted in a seven-fold increase in IM.
But hold on. For Dealer 1, we are still assuming they ONLY HAVE ONE CLIENT (or are all facing one other dealer). We explicitly net all of the risks within the Dealer 1 portfolio to calculate the IM number of $19.3m above. What happens if those trades are not all with one client?
Let’s repeat the exercise for the Dealer 1 portfolio then. I randomly assume they have 15 counterparties – some may be dealers, some clients. Let’s see how this portfolio grosses up the IM:
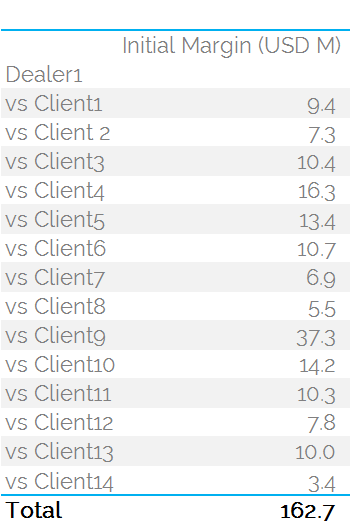
Surprise, surprise! We are now at an IM of $163m for a single dealer! Having started at just $19.3m, Dealer 1 is now on the hook for over 8 times that amount.
If we think it is likely that the same multipliers apply to every dealer account, we are going to see some very large IM values very quickly.
If we multiply every Dealer IM by 7, we end up with an IM requirement of $4.1bn.
If we multiply every Dealer IM by 9, we end up with an IM requirement of $5.3bn.
One Good Thing….One Bad Thing
This analysis does assume that all Dealers and all clients will become subject to the UMRs on the same day. In reality, this increase will be phased in for Tier 2 and Tier 3 firms over the coming years. So hopefully Uncleared IM won’t be quite so large in the first month…..
…however, this analysis considers only the $225bn of uncleared Fixed-Float vanilla swaps traded in July. We take no account of the $165bn of Swaptions traded. Or the $258bn of Cross Currency swaps.
In Summary
- Our analysis of just one month’s worth of trading data of uncleared swaps shows an Initial Margin requirement of between $4 and $5 Billion.
- This excludes trades which are not even clearable. Swaptions and Cross Currency swaps are the largest markets which remain uncleared.
- This number is probably lower than reality by a factor of √2 if the market were to implement HistVar methodologies for IM calculations.
- We can see how powerful the concept of netting is.
- It also points naturally towards a single node for netting….
- Fortunately we have those. They are called CCPs.