- We analyse how much Initial Margin is being held versus derivatives in 2019.
- This covers cleared and uncleared OTC derivatives, plus exchange traded contracts (Futures and Options).
- It is difficult to perform the same analysis for Variation Margin.
- We take a look at the latest ISDA Margin Survey to see if it holds the answers.
Rehypothecation
It’s never a great idea to start a blog with a really long word like that. It’s a bit off-putting and can put an unnecessary demand on the reader’s brain. Doh.
But in this case, it carries a key concept, and highlights a key difference between Variation Margin and Initial Margin so it’s a necessary evil – much like margin!
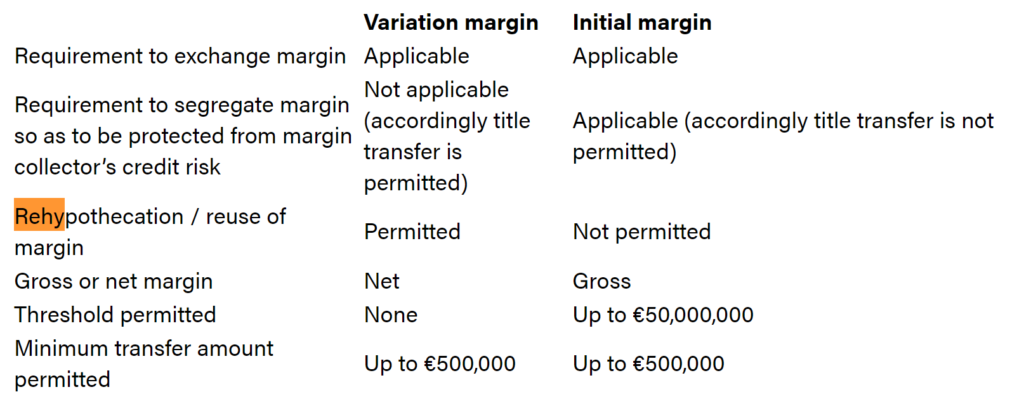
Under the Uncleared Margin Rules, Variation Margin is allowed to be rehypothecated (legally this is different to “re-used”, but let’s keep it simple here). Any VM cash that I receive can be posted as VM versus another counterparty.
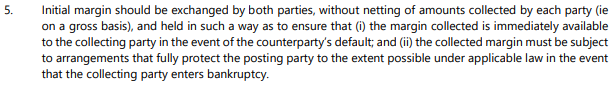
However, the Uncleared Margin Rules dictate that Initial Margin cannot be rehypothecated:
What does this mean to a trading business? Broadly speaking, if I have a balanced portfolio in the uncleared space, then posting VM should be relatively painless. If I have zero access to intraday credit (unlikely) then I could even wait until I receive all of my VM for the day before posting the amounts I owe.
For IM, I need to fund the margin that I estimate will be held for the life of the portfolio. That is expensive as I cannot do anything with the IM that I receive.
That is why we see lots of analysis on Initial Margin and not so much on Variation Margin. With the recent market volatility, there is likely to be a strong focus on both aspects of Margin.
Variation Margin in Uncleared Markets
We start with an analysis of the cheaper of the two forms of Margin – Variation Margin, VM.
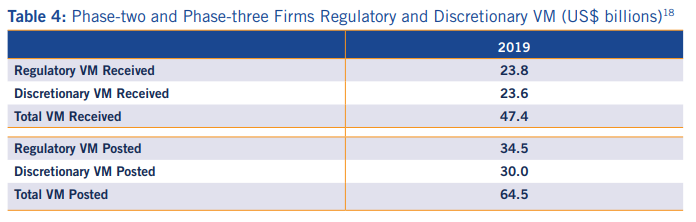
According to the most recent 2019 ISDA Margin Survey, cumulative VM has now breached $900bn:
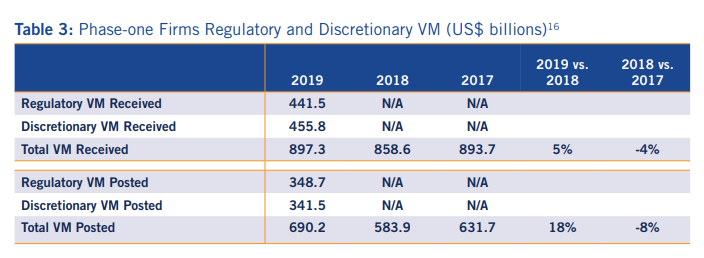
What does this huge amount of VM – over $900bn – actually represent for derivatives markets?
This is the cumulative mark-to-market of counterparty-netted portfolios since they started accumulating Variation Margin. Recall that the VM “big bang” occurred back in March-September 2017, covering all counterparties. Therefore it is pretty safe to assume that if you are trading OTC derivatives you will be subject to Variation Margin (exempt counterparties aside, such as corporates and sovereign entities).
If you consider that these numbers are grossed-up across the number of trading counterparties that a dealer is active with, it is understandable why they are such large numbers.
This amount of collateral does not flow between market participants each day. Only the one day change in mark-to-market is exchanged on a daily basis. Therefore the amount of collateral exchanged as VM on a daily basis will be a tiny portion of this total amount. Maybe as much as 5%, but I would estimate even lower.
And remember, in the (overly simplified) case that all VM is cash-only, whatever is received can be posted.
Variation Margin in Cleared Markets
Looking at CCPView Disclosure data, the two measures we have for VM are not directly comparable to these figures for Uncleared markets. The disclosures require CCPs to report both the Average and Maximum amounts of VM paid each quarter.
The maximum amounts have reached over $30bn just for the Rates CCPs:
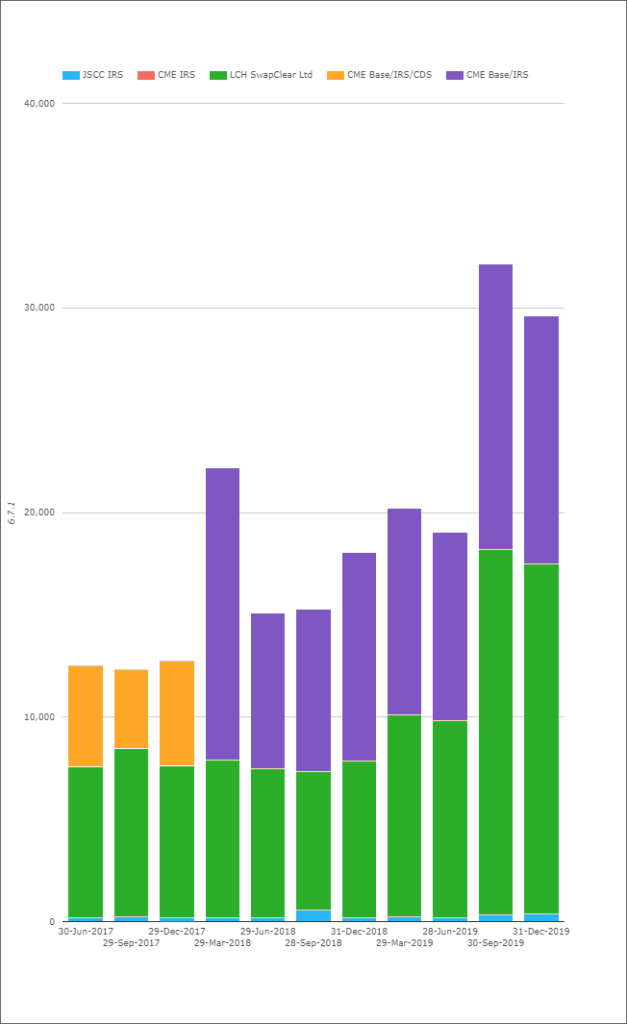
However, this is a distinctly different measure to the cumulative amount of VM called on a portfolio. This is the maximum one-day move in the value of a portfolio, not the cumulative amount of VM posted against a portfolio.
Shame we cannot directly compare the two markets. Particularly when there is bound to be an acute focus on margin calls during the post-mortem of COVID-19.
Initial Margin in Uncleared Markets
However, we can directly compared Initial Margin being held in Uncleared Markets and Cleared Markets.
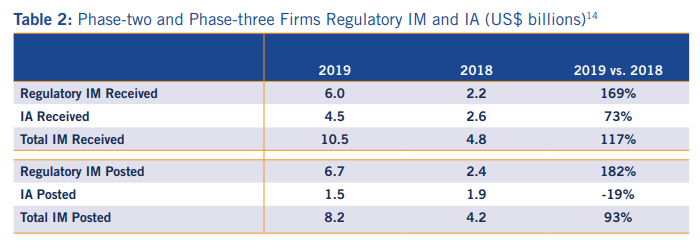
From the ISDA survey:
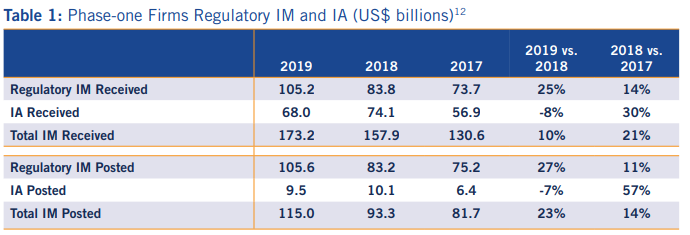
As Amir has written about in the past, it is not 100% clear in the survey data whether we should consider the total amount of IM in these figures or just one side e.g. the Received amounts.
For me, if I execute an uncleared Cross Currency Swap, both sides of the trade must post Initial Margin to a third-party:
So if I surveyed both of the banks involved in this swap, both would report a posted and a received amount (which would be equal under ISDA SIMM).
By extension, we should therefore only look at one side of the margin figures. Let’s take the “Received IM” amounts, as they also include IM posted as part of one-way agreements.
Overall, we can say that the firms included in the survey had received ~$184bn in IM as at the end of 2019. That is an increase from $163bn last year, a relatively small increase of 13%.
How does this compare to IM held in Clearing?
Initial Margin in Clearing
ISDA include a chart on IM for Cleared Derivatives, but I want to take it further:
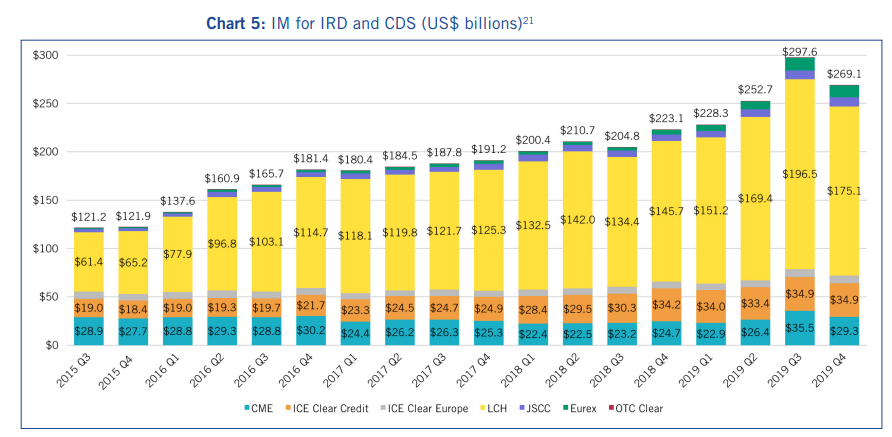
At a high level, it is useful to know that cleared derivatives have now consumed nearly $300bn in Initial Margin at some points in time, which is substantially higher than the current $184bn total in Uncleared markets.
However, I’d like to monitor the relative changes over time, and include Futures (Exchange Traded Derivatives) as well. CCPView allows me to do this.
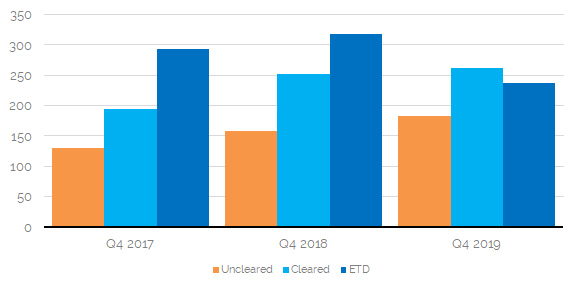
It is interesting to consider the components for this chart:
- Uncleared derivatives cover everything – equities, rates, credit, commodities.
- Cleared OTC derivatives cover only Rates and Credit.
- ETD covers a lot of things – including commodities and equities at CME, oil at ICE for example. As well as the major Rates and Credit futures.
I think this is still a representative chart of the overall IM requirements of the industry, even if each sector is covering slightly different products. This is particularly the case as there are no meaningful volumes in OTC cleared equities or commodities contracts (that I am aware of?).
The chart shows that:
- Total IM required was $682bn as at end 2019.
- Total IM only increased by 10% from Q4 2017 to Q4 2019.
- This is largely thanks to a reduction in IM held against futures (ETDs) offsetting the increase in IM held versus Uncleared positions.
- The increase in IM held for Cleared derivatives was just 4% from 2018 to 2019.
- As more and more counterparties are captured by the Uncleared Margin Rules, we expect the Uncleared portion of the chart to continue to grow. It must at least equal the Cleared portion due to the lack of multilateral netting, right?
I’ve produced this chart now because it is going to be really interesting to see what happens to the ETD and Cleared portions of this chart as a result of COVID.
Amir has covered what has happened to IM for some cleared markets as a result of COVID. He found that 30y USD swaps will now consume an extra $1m in IM per $100k DV01 cleared.
And what will happen to ETD margins as a result of recent market moves? These tend to be more reactive to recent volatility (shorter look back periods, one-day moves) and of course oil went negative!
I’m already looking forward to updating this blog in July 2020 for those March 2020 disclosures!
In Summary
- Initial Margin for derivatives across all asset classes now stands at $682bn.
- About a quarter of this is generated by Uncleared markets.
- The remaining amount is roughly split 50/50 between Cleared OTC derivatives and Exchange Traded Derivatives (aka Futures and Options).
- The total amount of IM has grown by 10% since 2017.
- A similar analysis for Variation Margin is not possible.
- Comparable data for Variation Margin between Cleared and Uncleared markets would be extremely valuable for market transparency.
Do you have a comparison of these numbers with predictions made when EMIR was being implemented?