In last weeks blog, SEF Package Exemptions, So Far So Good, I included a chart showing that 52.5% of USD IRS were On SEF and mentioned that there were lots of Forward Start Swaps that were Off SEF.
Today I will take a look at these and provide a breakdown on the USD Swap types that are traded Off SEF.
Forward Start
In SDRView Professional we now have a feature to show these Forward Start Swaps.
So lets change the subtype from Spot to Forward and start with a chart for the business day May 30, 2014. 
The same information in tabular form: 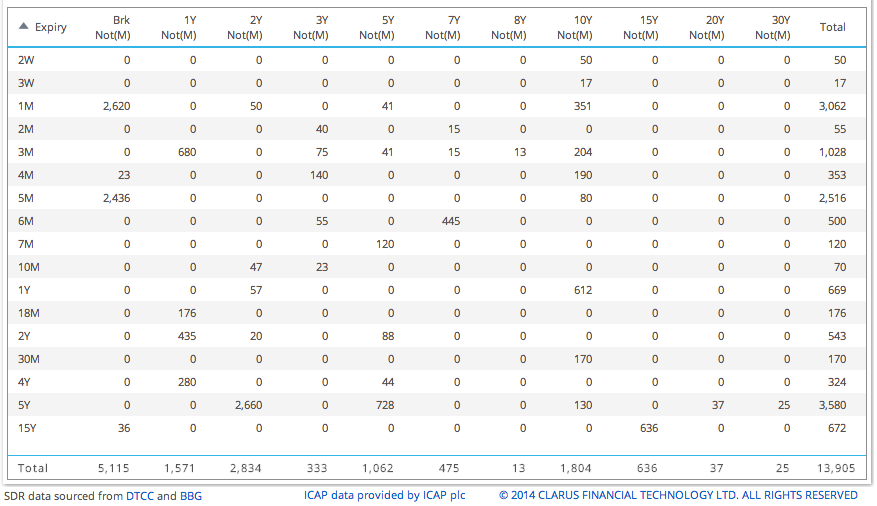
- Almost $14 billion is traded in Forwards that are Cleared.
- The Forward Period (Expiry) is on the y-axis
- The Swap Tenor is on the x-axis
- Brk column are broken date tenors (not whole years) which represent $5 billion
- Of which 1M and 5M are the largest forward periods
- 5Y into 2Y is the largest single point with $2.66 billion traded
Drilling down on the 1M vs Brk of $2.62 billion, shows that just a few end dates dominate; 2016 Mar 31, 2018 Aug 31, 2021 Feb 15. 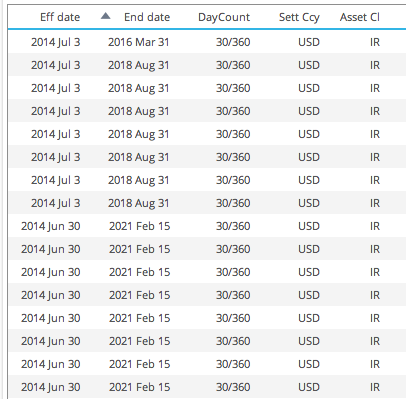
IMM Swaps
SDRView Pro also has a new subtype IMM, so we can now look specifically at these.
Recall that IMM and MAC Swaps are MAT ( for the first two IMM dates and specific tenors, see CFTC). 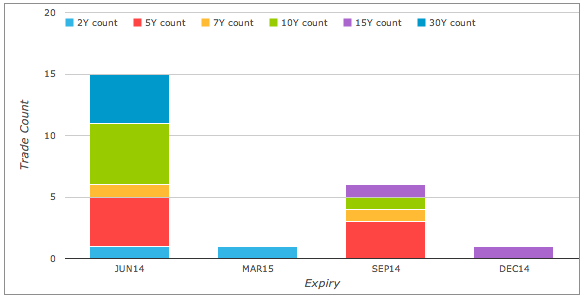
Which shows:
- The first IMM Date (June 14) has 15 trades On SEF, with 2Y, 5Y, 10Y being most common
- The second IMM Date (Sep 14) has 6 trades on SEF
- There is also one trade in each of the next two IMM dates, even though these are not MAT
The SDR data does not provide a convenient way of distinguishing IMM from MAC trades. One has to look at the fixed rate and decide if it is a MAC coupon e.g. 3.% for 10Y. (which can be done in the drill-down).
Now lets look at the Off SEF IMM trades on 30 May; this time in table form. 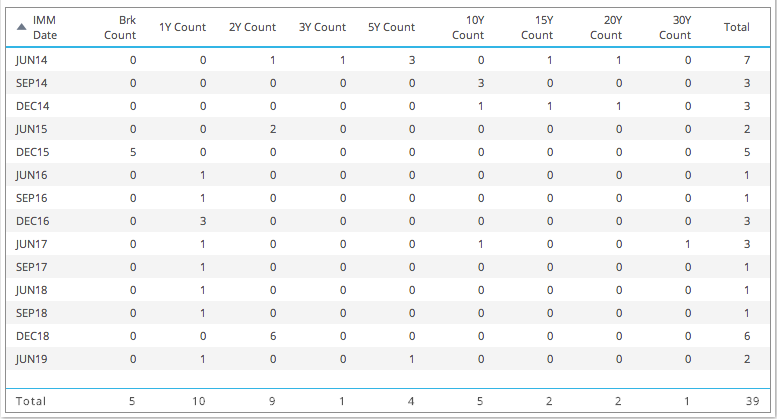
Which shows:
- More trades, 39 Off SEF to the 23 that were On SEF.
- Many more IMM Dates are traded
- In-fact all the way out to 5Y
- With 1Y, 2&, 5Y, 10Y being the most common Swap tenors
A Digression
Before we move onto the question posed in the title of this article, lets take a digression on what else is new in SDRView Pro
- Floating Indices selection is now based on a clean normalised list of indices (so Libor 3M, will find different naming conventions that all mean Libor 3M)
- Fixed rate frequency is also a selection, allowing us to isolate Libor 3M SA 30/360 Swaps from Libor 3M PA ACT/360 Swaps.
- The subtype Non Standard (NStd), isolates those trades that are non par or have a price affecting term that is not in the public dissemination
Which brings me on to the subtype “Old”.
We have used this to select trades where execution time is today but effective date (start date) is in the past. Surprisingly there are lots of these trades; 91 on 30-May alone. We are not sure why these would be disseminated late, in many cases the effective date is in 2013. The only clue is that in the drill-down the vast majority are Off SEF and a high portion are block trades. I would guess one of the following:
- These trades were not reported originally, have now been found and as the execution timestamp is not known, this has been set to the date of reporting.
- They are being back-loaded into reporting for a specific business reason.
- Which could be portfolio reconciliation, back-loading to clearing or assignment, take your pick.
If anyone knows, please add a comment at the bottom of the article.
(As an aside, if trades have an execution timestamp with a date in the past, we allocate them to that date and not the report date, otherwise they would inflate the volume and distort the price analysis for the report date).
Spots vs Fwds
Back to Spots vs Forwards.
Rather than a single day, which can distort the data, lets look at the 20-day period from 1st May to 29 May inclusive (apologies for excluding May 30, but I did this analysis before these figures were available and do not have time to update now).
So USD IRS separated by Spot and Forward (inc IMM).
![]()
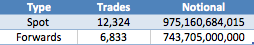
Shows that while Forwards volume is less than Spot, it is substantial.
55% in trade terms and 76% in gross notional terms compared to the Spot volumes.
It is also interesting to look just at Off SEF Volumes
. ![]()
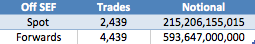
So the answer to our question, “Spots vs Forwards, which is greater?”, is most certainly Spot.
However Forward volume is much larger than you would think and dominates the Off SEF figures.
Good to know and a reason to use the new Fwds subtype in SDRView Pro.
On SEF vs Off SEF
Lets now provide more detail into the USD Swap sub-types that make up the 47.5% of trades that are Off SEF.
Again lets use data for the 1 May to 29 May period.
. 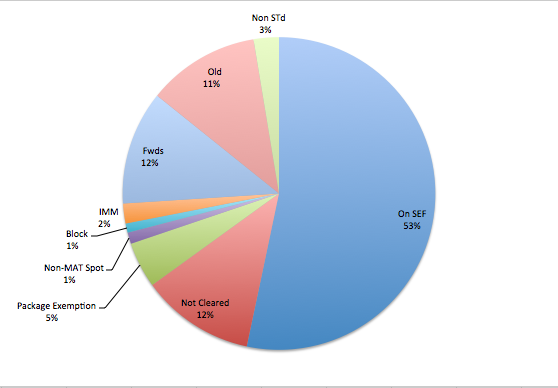
Which shows that:
- 12% are Not Cleared, due to clearing exemptions (e.g. corporate) and trade specific details.
- 12% are Forwards
- 11% are Old (see the Digression section above)
- 5% are Package Exemption, so Spread over Treasuries, Invoice Spreads, etc.
- 3% are Non Standard, so not par or with other terms that impact price (amortising?)
- 2% are IMM, other than the first 2 IMM dates
- 1% are Spot but in Non-Mat tenors (e.g. 8Y, 9Y, 11Y, ..)
- 1% are Block trades
The question of whether the percentage of Forwards has changed since SEF inception and whether market participants are using Forwards instead of Spot to avoid the SEF MAT, I will leave to another day.
Summary
USD Forward Start Swaps trade in substantial volume.
Mostly these trades are Off SEF, as non-MAT and for very specific forward dates and tenors.
IMM Swaps are less traded than forwards.
SDRView Professional now provides a specific view for Forwards and IMMs.
53% of USD Swaps are On SEF and 47% Off SEF (for trades reported in May).
Looking into the Off SEF, we see that 12% of all trades are Not Cleared and 12% are Forwards.
11% are Old trades and 5% are currently Package exempt and will soon be On SEF.
Meaning that around 60% of reported trade volume in USD Vanilla IRS will be On SEF.
Which I think is a good result.
Thats it for today.