- Are negative swap spreads solely caused by balance sheet contraction?
- There should be some hints in the data if this were the case.
- We look at the Open Interest in unfunded Swap Spreads by way of US Treasury Futures….
- …and extend this to look at the product mix that trades between cash bonds, OTC and ETD products.
- The analysis leaves us once again frustrated at the lack of timely data available for US Treasury markets.
After the hoo-hah over negative swap spreads last week, it got me thinking about why this is happening now. The prevailing wisdom states that this is due to pressure on bank balance sheet utilisation, therefore not enough accounts have sufficient capital to buy bonds, earn the coupon, and pay a lower fixed rate on the swap.
But! There is also an unfunded way to take advantage of the yield differential – buy UST Futures vs the Swap. This is far more balance-sheet efficient (you don’t need to raise the cash to pay for the bonds).
If the collapse in swap spreads was solely balance-sheet driven, I would have expected to see at least some accounts taking the contrary position in the unfunded equivalent – and therefore to see an increase in Open Interest in UST futures. After-all, why not earn some positive carry when it is available?
If you look at a relatively short time-horizon, we actually see the opposite effect. Since the beginning of September, we have seen Open Interest in the 10 year T-note at CME positively correlated with price moves. As the sell-off in bond prices took hold, swap spreads turned negative and Open Interest actually decreased:
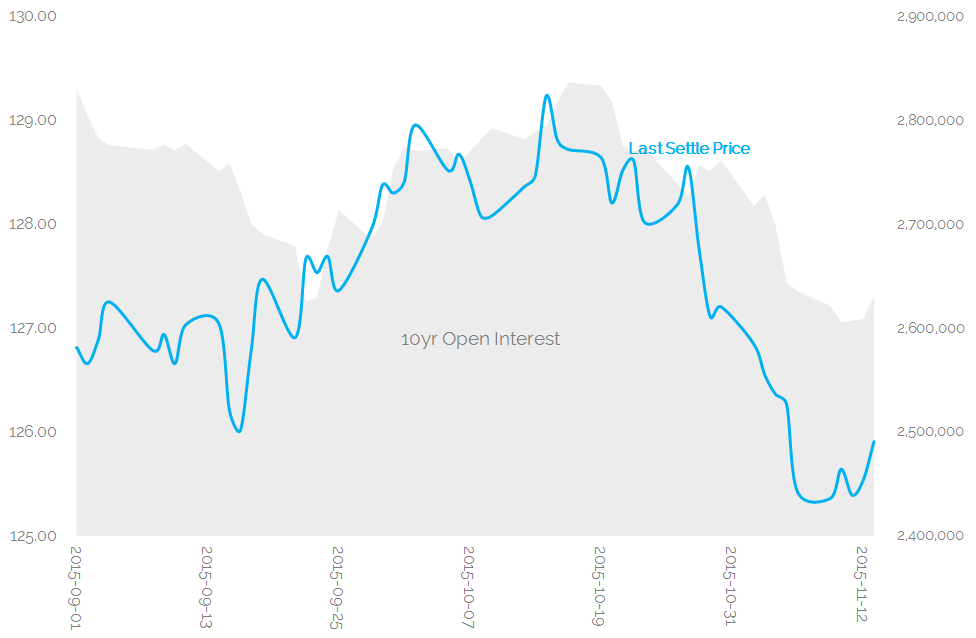
Showing:
- The daily settlement price of the current CME 10yr T-Note futures contract (Dec-15)
- The Open Interest of the same contract, plus any Open Interest in March-15.
- As prices rallied in September and early October, Open Interest also increased.
- Open Interest peaked at roughly the same time as prices in mid October.
- Since then, Open Interest has steadily declined, hand-in-hand with prices.
This got me thinking that maybe a contributing factor to the sell-off in bonds and the contraction of swap spreads into negative territory was actually down to an unwind of a large position in the unfunded contract after all. And unfortunately there was no off-setting interest in the cash products as dealers don’t have sufficient balance-sheet to play with.
That seemed like a valid proposal until I looked at a longer time-series of Total Open Interest across the whole of the T-note complex:
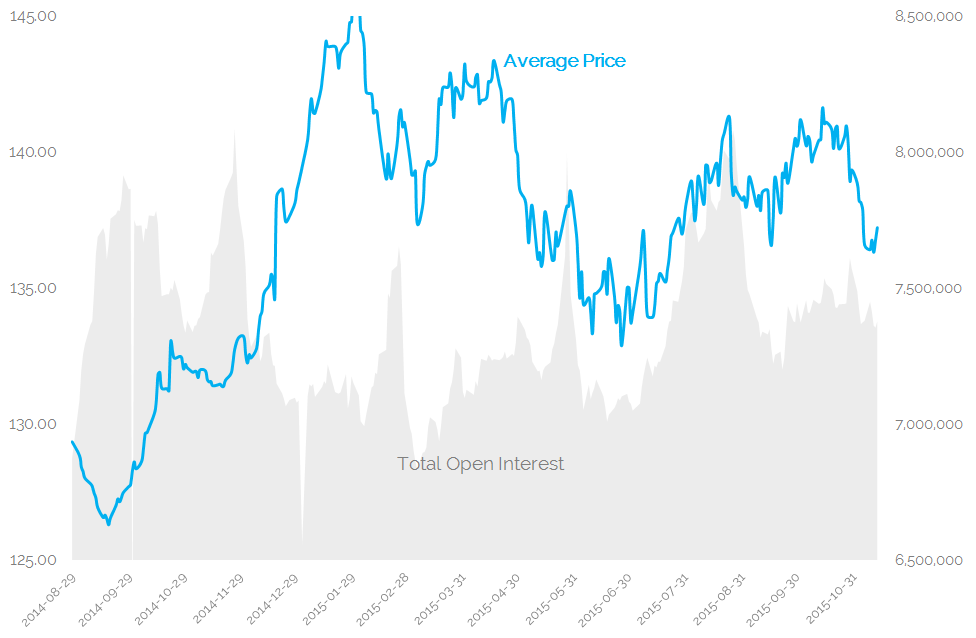
Showing:
- A simple additive Total Open Interest across T-note futures (i.e. it is not risk-weighted).
- A simple average of all T-note futures settlement prices.
- The long-term time-series for the 10yr T-note also looks similar….
- ….sadly showing little evidence of a consistent link between Open Interest, Prices or the steady grind tighter in swap spreads.
CCPView Intelligence
Remembering that correlation does not imply causation, I still wanted to see if we had any evidence in the data that balance sheet utilisation has been decreasing. Or that the mix of products traded has been changing as a result of more stringent capital charges for OTC derivatives at the very least.
Using CCPView, I first took a look at the recent volumes traded in USD swaps at CME. This seemed a natural thing to do, seeing as we’re talking about CME traded US T-notes, therefore the most capital efficient way to trade an unfunded swap spread position should be via portfolio margining.
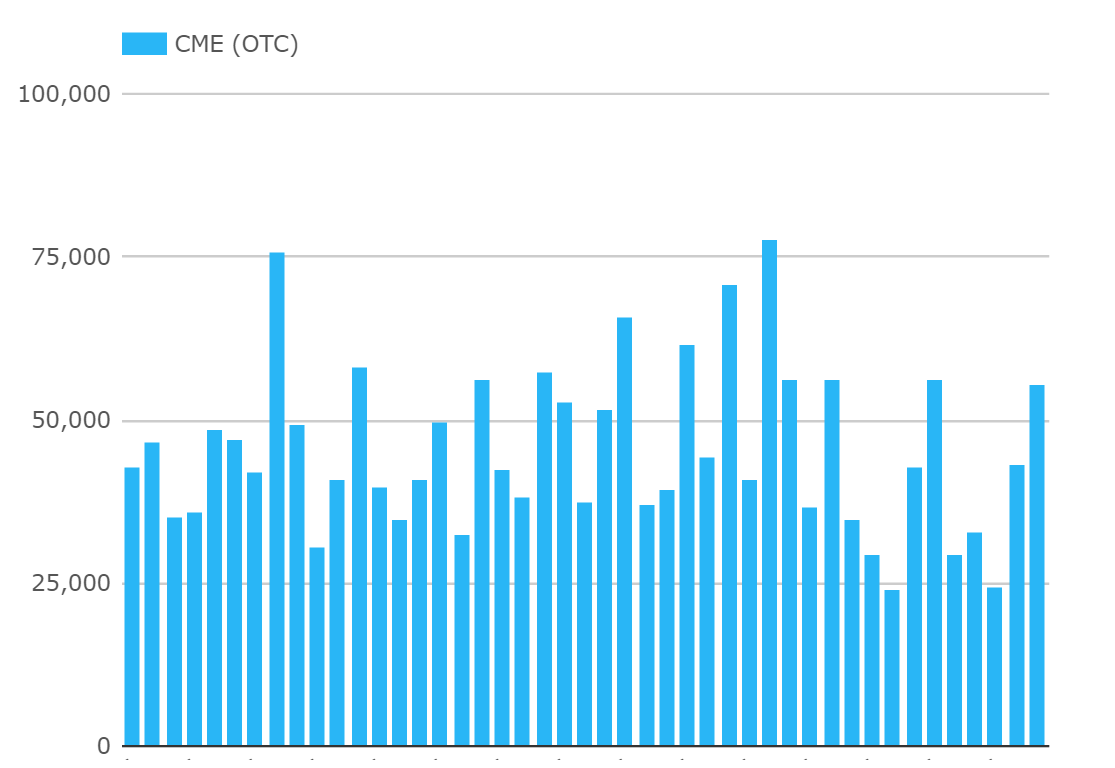
The recent volumes are on the right, showing nothing too ground-breaking in the way of outright volumes.
But, negative swap spreads may have suppressed volumes across the whole industry, so let’s just do a sanity check of CME’s market share in USD client-cleared swaps recently. This shows;
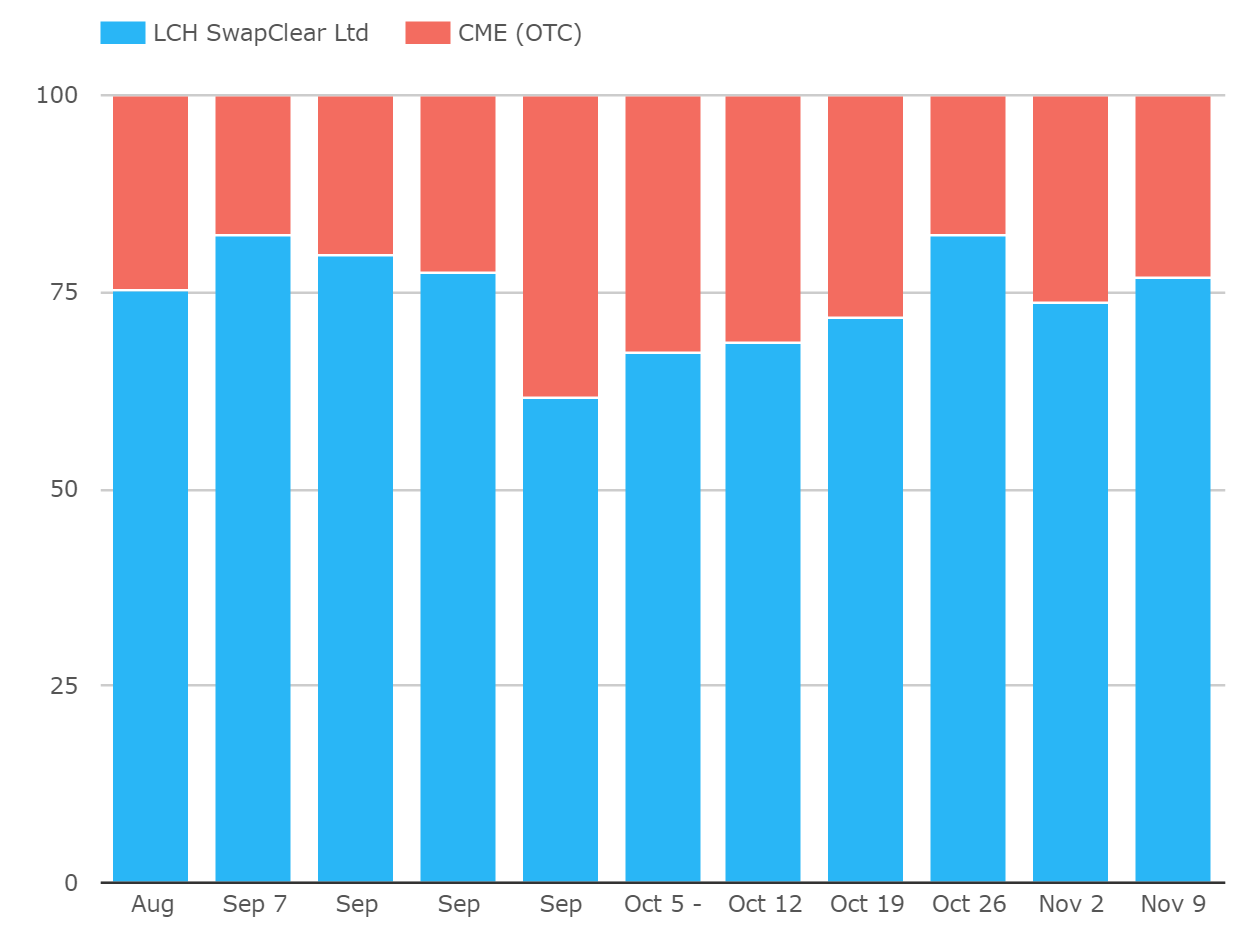
- Market share, per week, of USD client-clearing activity at LCH and CME. Remember, that we assume all CME volumes are client-related.
- Again, there’s not too much to report – CME had a good last week of September in terms of volumes, and LCH has made up ground since.
In a nutshell, the data doesn’t show any particular correlation with the change in Open Interest that we saw for the futures complex.
What about Swaps and Futures?
If balance-sheets are coming under pressure, do we see more positions being taken in leveraged, unfunded products such as futures? Are futures trading in larger volumes compared to swaps because they are (on the whole) more capital efficient?
To answer that, we can use CCPView to compare the product mix of OTC products versus exchange traded futures. In 2015, let’s look at the weekly time-series for USD long-end products (i.e. excluding FRAs, OIS and Eurodollar products):
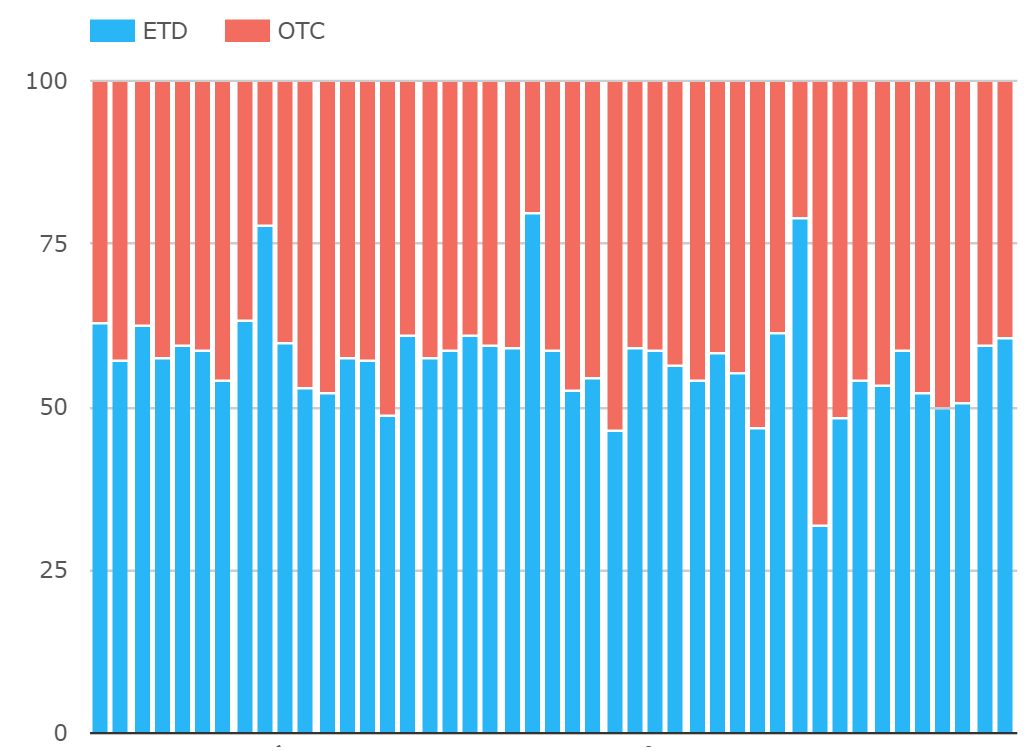
Showing:
- Volumes traded per week of OTC Rates Products and ETD Rates Products, by notional equivalent.
- The split YTD in 2015 has been 58% traded in ETD vs 42% in OTC Rates products.
- Excluding roll activity and the CME tri-Optima compression run, this reverts to 56%/44%.
- That is much closer to an even distribution of risk than I expected. I thought Futures would have been far larger than OTC.
- This is an interesting metric, and it is telling that the distribution per week in 2015 has been fairly constant.
And Finally….
I realised that I could combine the above with the SIFMA data on UST trading as well. By excluding Bills, TIPS and USTs less than 2 years, we have a pretty comparable risk Universe. Given that the OTC/ETD split has also been fairly stable over time, we shouldn’t even lose too much granularity by looking at Average Daily Volumes (the only data available). Again, I was surprised how equitable the split is:
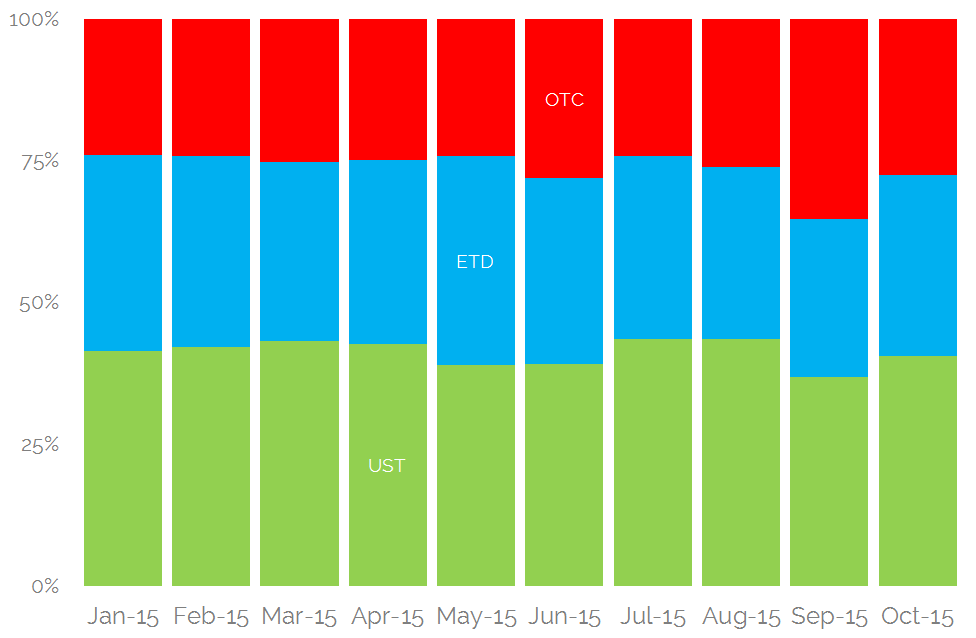
Showing;
- Average daily volumes for US Treasuries, Exchange Traded Derivatives and OTC Rates products on a monthly basis during 2015.
- USTs are consistently the highest volume market, averaging 39% YTD.
- ETDs come in second at 35% of average volumes.
- Meaning we have OTC products in third at 25%.
- Unfortunately, SIFMA only have updated data for October so far. We’ll have to wait for November.
- I can’t spot any meaningful trend in that data…
…so let’s take a look on an absolute basis as well:
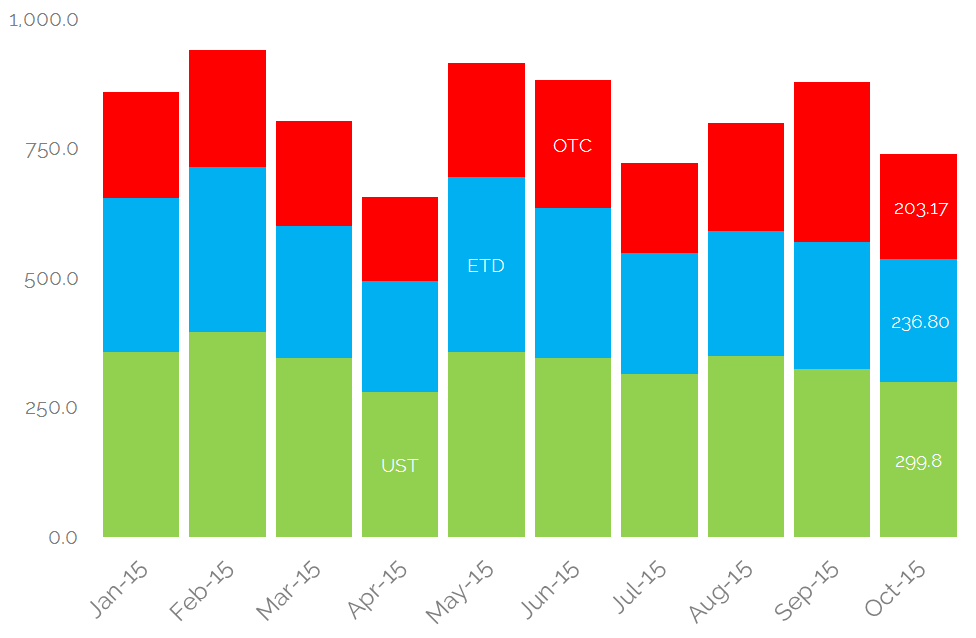
Showing;
- In some month’s, the DAILY average turnover can be over $1trillion notional equivalent. That is for products with a maturity greater than 2 years. That is pretty impressive!
- October saw a drop in volumes, most pronounced in OTC products. This may have been due to IMM-dated products being rolled in September.
- I have performed a crude correction for ETD roll months to prevent roll-related spikes in their volumes, but it works pretty well.
- UST trading volumes have been declining somewhat since August….
- ..if that trend continued during November it would be very similar to the slow grind lower in Swap Spreads…
- ….which would lend weight to the idea that balance-sheets are under pressure and that this has been a strong contributing factor towards negative spreads.
In Summary
- We’ve presented a lot of data here, but deciphering a consistent story throughout is a challenge.
- Maybe the decrease in Open Interest in T-note futures represented an unwind of a long swap-spread position…
- …and the consistent selling in the T-note wasn’t taken up in the cash bond markets due to a lack of balance-sheet available to do so.
- We would naturally expect to see a position of this size changing the relative product mix of cash bonds, futures and swaps….
- ..but we are ultimately frustrated at the lack of timely Treasury volume data to check the November numbers.
- We are therefore once again reminded of the importance of timely reporting of volume data to allow us to make sense of these complicated price dynamics.