- We compare Average Daily Volumes in US Treasury bonds to those in Spreadovers reported to the SDR
- Spreadovers account for about 2.5% of turnover of US Treasuries
- The maturity profiles of trading are broadly similar
- But Spreadovers have a greater concentration of trading in the 5y and 10y maturities.
Half of all trades are not what they first seem!
Amazingly, it’s been over six months since we last took a look at Spreadovers. Back then, I used the identification of package trades to highlight that over half of the SDR trades were linked to at least one other trade. Therefore, without the Clarus identification of their package type, the price information is pretty opaque and the standard coupon yields little value.
Now, we can run that analysis as a single query using SDRView. Reducing my 1,000 words of quality analysis to an executable line of code – such is life in fin tech I guess.
Looking at packages across this year, we can see that this claim stays broadly stable – only around 50% of trades can be attributed to outrights:
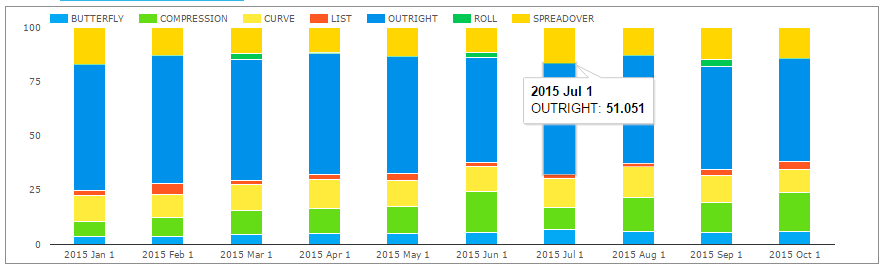
And remember that could be further distilled into spot, forward, IMM etc trades. A point we’ve made before, but it’s worth repeating when considering anything to do with Trade Reporting.
But this week, let’s take a detailed look into Spreadovers.
The Spreadover market vs the UST market
I can’t believe I’ve not done this blog before! Having had a delve into the SIFMA data set on US Treasury Average Daily Volumes, it is high time that we compare the market in US Spreadovers with the underlying US Government bond markets.
Overall Volumes
We at Clarus fully support the recent discussions over UST reporting plans and we think it would bring welcome transparency to one of the largest markets in the World. However, there is some useful data already out there. SIFMA, for example, issue some statistics about volumes. Below, I use this high-level data to compare to some amalgamated statistics of the Spreadover market.
Because SIFMA does not provide trade-by-trade figures, we need to talk about Average Daily Volumes. Whilst this may be a nice large number, it doesn’t account for the subtleties of duration differences between bonds – so sadly we can’t leverage our DV01 stats for swaps to their full potential. However, SIFMA do split the ADVs by maturity, so we can compare like-for-like notional by maturity bucket.
The overarching message is that Spreadovers are a tiny percentage of turnover compared to the underlying cash market:
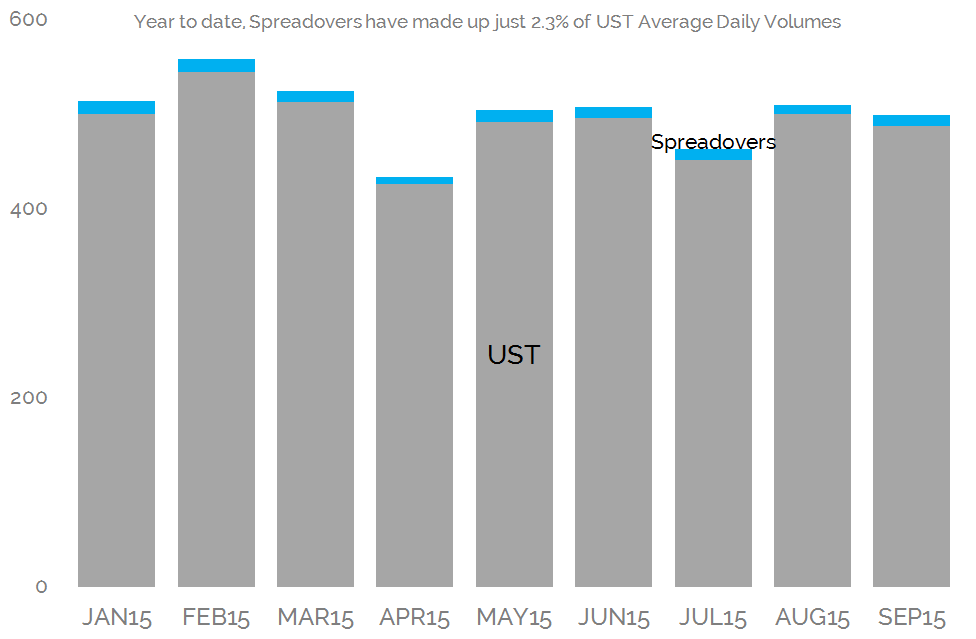
Showing:
- Average Daily Volume in USTs has been as high as $557bn in 2015, during February.
- Of this amount, only 2.4% of the volume is attributable to Spreadovers.
- This has been a remarkably stable portion of volumes all year.
- The peak volume for Spreadovers was $13.9bn in January of this year.
The fact that Spreadovers only account for a small portion of UST trading shouldn’t be that surprising, considering:
- SIFMA aims to capture as much of the market as possible, by using the New York Fed statistics on Primary Dealers as the data-source.
- SDR data is only US Persons, so will not encompass the full market.
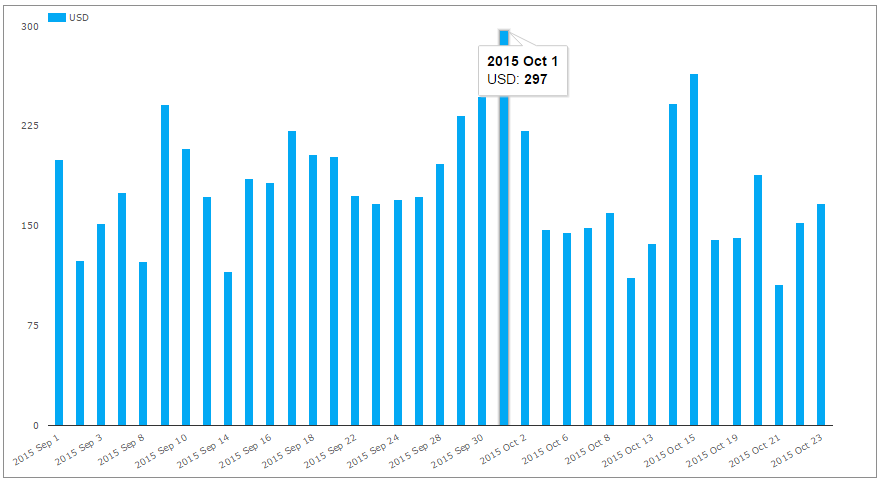
- Turnover in the UST market will be greatly increased by the presence of Primary Trading Firms and other liquidity providers who enter into and exit positions in a much smaller time frame than is (currently) possible in swaps. Remember, we are dealing with relatively few trades per day in Swaps. For Spreadovers, the highest number of trades we have identified in a single trading day since September has been just shy of 300:
And along similar lines….
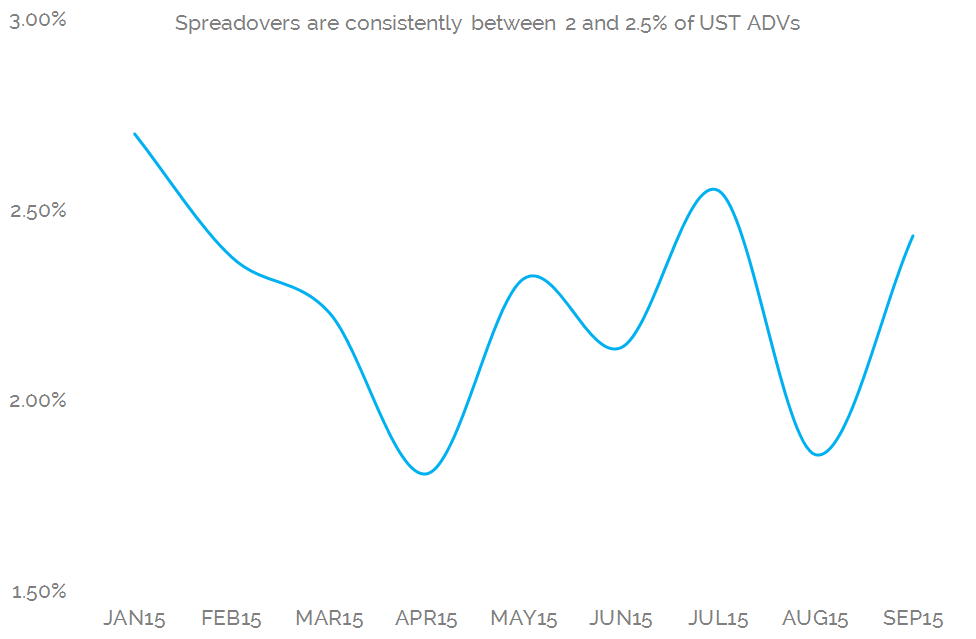
Given the inherent link between the markets and the small proportion of UST trades attributable to swaps trading, it is perhaps not surprising that there are two clear features in the data. Namely:
- Stability: The portion of UST trades attributable to Spreadovers has been remarkably stable between 2 and 2.5% all year:
- Homogeneity: The Spreadover market shows a very similar maturity profile for Average Daily Volumes to the underlying UST market:
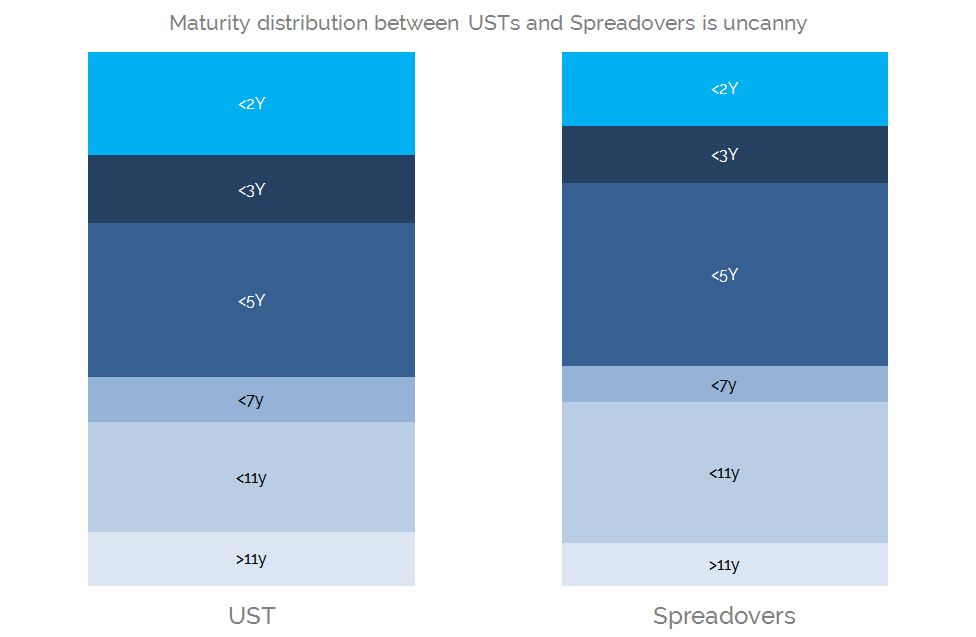
Showing;
- For both markets, 5y and 10y see the largest amount of notional trading per day – despite the differences in duration this implies versus other maturities.
- 5yrs accounts for about 30% of trading volumes
- 10yrs accounts for about 23% of trading volumes
- The maturity profiles Year to Date, in terms of the volumes that have traded, look broadly similar.
Maturity Profile Differences
The chart above can be further analysed to drill-down into the differences between the two data sets – as that is really what is interesting when they are so similar! Below, we show the % differences between the two maturity profiles:
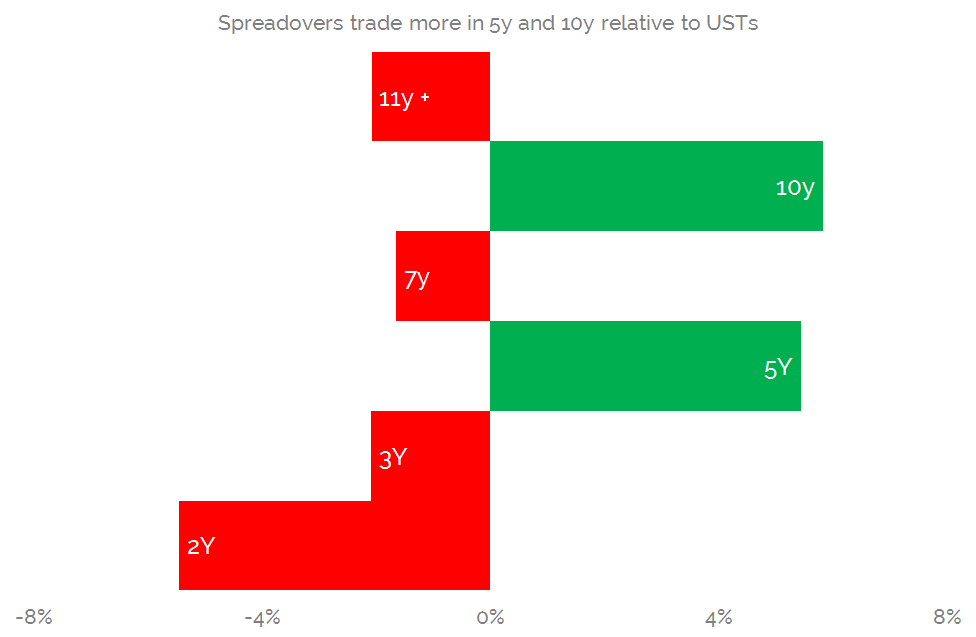
Showing;
- Spreadovers trade 10% more of their volume in the 5y and 10y “benchmark” maturities.
- USTs see a slightly more disparate maturity distribution, meaning that there is comparatively more trading in USTs than Spreadovers outside these two maturities.
- The differences are relatively small – the largest being a 6% difference in the “10y”.
In Summary
- Nothing too ground-breaking or controversial this week!
- It is nice to see that the data backs up the fact that trading in the Spreadover markets is largely a function of the underlying UST markets…
- …evidenced by the fact that their maturity profiles are similar.
- However, maybe because Spreadovers have a much lower turnover than USTs…..
- …their liquidity is more concentrated in the benchmark maturities
- These are 5y and 10y, which have accounted for over 60% of Average Daily Turnover in Spreadovers during 2015
- And if you’ve got this far and are wondering how we identify Spreadovers in the data, then please take a refresher here– and remember to subscribe once you’ve finished reading.