- We take a look at historic data for SONIA and GBP LIBOR.
- ISDA’s work on LIBOR fallbacks allows us to look into the potential values of the historic spread.
- We compare to the forward-looking LIBOR-OIS spreads to the backward looking compounded RFR values.
- Initial analysis shows that the look-back period will be an important consideration.
LIBOR Fallbacks
In the event that an IBOR rate ceases to be available, ISDA have previously publicly consulted to arrive at a suggested methodology for LIBOR fallbacks. Catch-up on our blogs under the topic “Index/Fix“.
This means that if an IBOR rate ceases to publish, it will be replaced with two components:
- A compounded in-arrears risk free rate (RFR) plus,
- A calibrated spread, intended to represent the credit spread inherent in IBOR over the RFR. This spread will be based upon historic data. We do not know the exact methodology yet (look-back period and averaging methodology are the two big unknowns).
When considering what the historic spread might be, I thought we should try to educate ourselves on what is exactly happening during the calibration. There are three things to note:
- We are calibrating a backward looking, realised compounded rate versus a forward-looking IBOR rate that was set at the beginning of the period.
- The spreads are likely to be somewhat different to the quoted LIBOR-OIS spreads (aka LOIS in Bloomberg) that we see traded in the market.
- The spreads vary by IBOR tenor. So the 1 month IBOR of a given currency will have a different spread to the 3 month IBOR.
For this blog, I choose to look at number 2 first – just to see what the market might expect – and then turn to number 1.
GBP markets are very transparent!
First, I have to complement the Bank of England on making SONIA and SONIA markets quite so transparent. On their website, there is a whole section on Yield Curves, and importantly daily data. This means that we can take historic data for both OIS and Libor yield curves to analyse how spreads have evolved.
Armed with this data, I chose to look at a single year – 2017. I did this because:
- There were rate hikes in the UK. This might be a good test therefore to see how forward-looking expectations of rate action combine with realised RFRs.
- 2017 was before we knew what the fallback methodology would be. Andrew Bailey’s speech, announcing that banks would no longer be compelled to submit LIBOR past 2021, was given in July 2017. It might be interesting to compare H1 2017 to H2 2017 in light of that.
GBP LOIS One Month
First off – what happened to the observable spread? Here is how the spread between the 1 month LIBOR fixing and 1 month OIS (SONIA) performed during 2017:
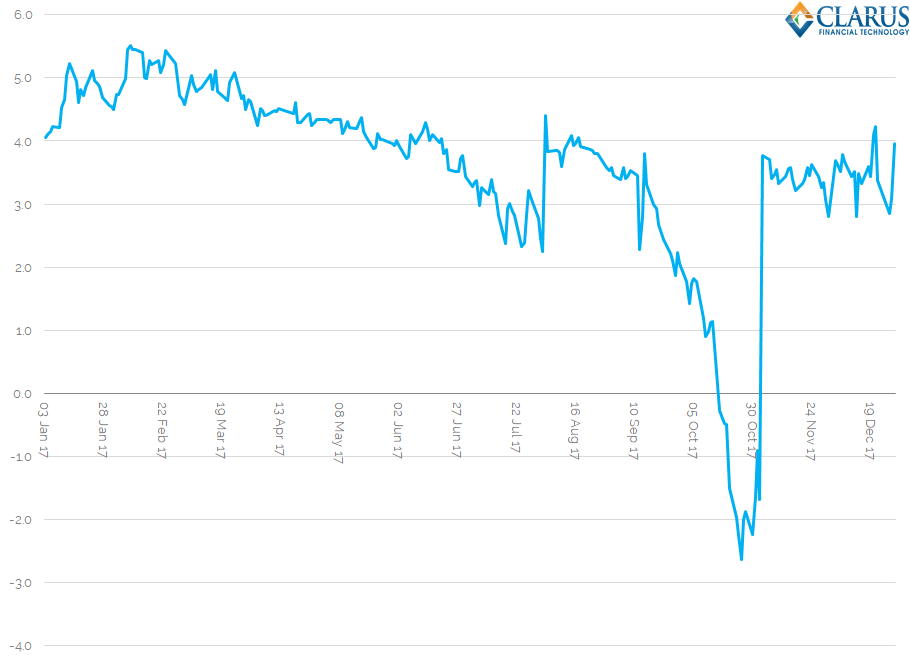
- The Monetary Policy Committee in the UK hiked rates on November 2nd 2017 – see FT coverage here. It was the first rate rise in a decade, lifting rates from 0.25% to 0.50%.
- As we can see, the spread between one month LIBOR and one month SONIA swaps compressed significantly into this event. This always tends to be the case in a rate hiking environment, where LIBOR is slower to react than OIS markets to upcoming rate hikes (assuming they are well telegraphed, as this one was).
- As we can see, LIBOR-OIS spreads can therefore go negative. This generally only happens for a short period of time, because fundamentally Libor has more credit risk associated with it than a collateralised OIS. Therefore, 1 month LIBOR tends to climb relatively quickly after a rate hike to re-establish a positive spread to OIS markets.
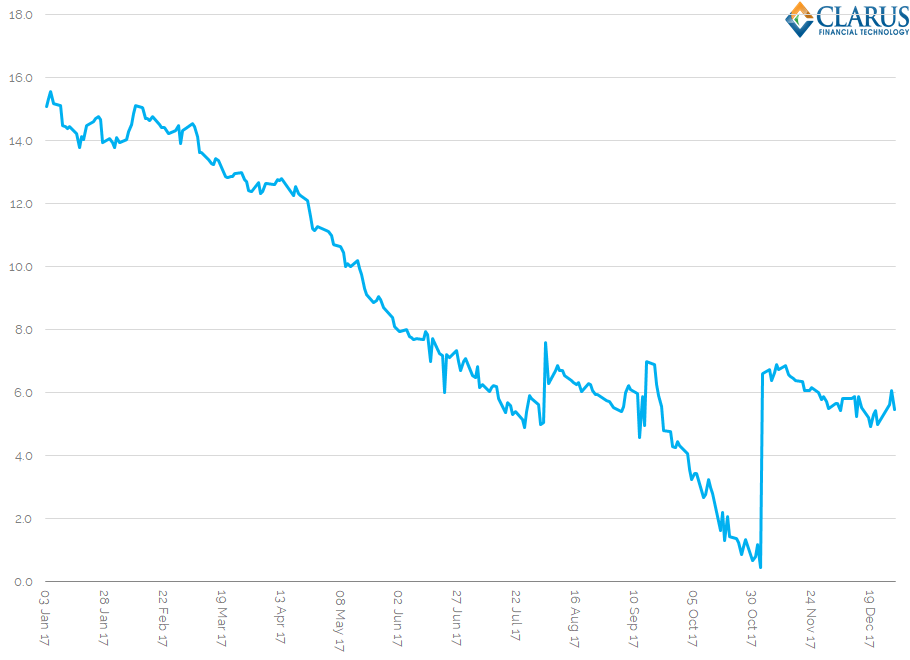
GBP LOIS Three Month
We saw this same compression of LIBOR-OIS spreads (LOIS) in the 3-month tenor as well into the rate hike:
GBP 1M LIBOR Calibrated Spread
Using essentially the same data, we can now look at the realised spread versus 1M LIBOR to see where a calibrated spread might end up (assuming the look-back period was only 2017):
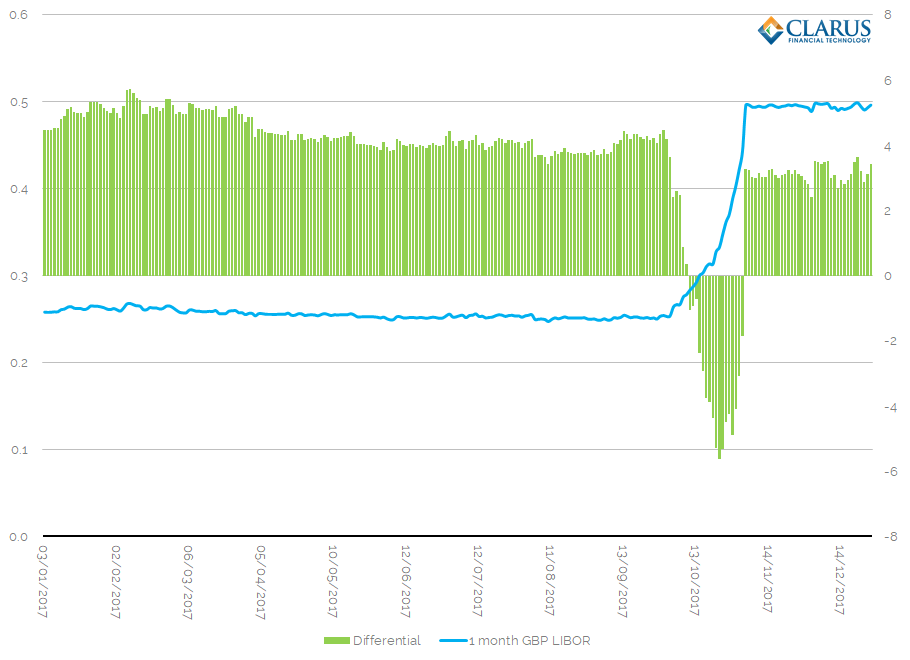
- The blue line is the daily 1M GBP LIBOR fixing.
- The green bars represent the difference between the LIBOR fixing and where the compounded in-arrears RFR realised rates ended up – let’s call this differential the “calibrated spread” for the time being.
- As we can see, the calibrated spread also had a period where it was negative. This period was longer and hit more negative levels than we saw in the forward-looking market.
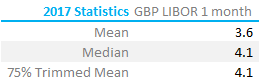
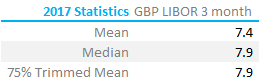
Overall, if we used 2017 as our observation window, the historic spread could be calibrated as follows:
That might be counterintuitive to some – everyone is probably paranoid about including the extremely high values we witnessed during the GFC and Eurozone crisis periods!
GBP 3M LIBOR Calibrated Spread
And for the 3-month tenor:
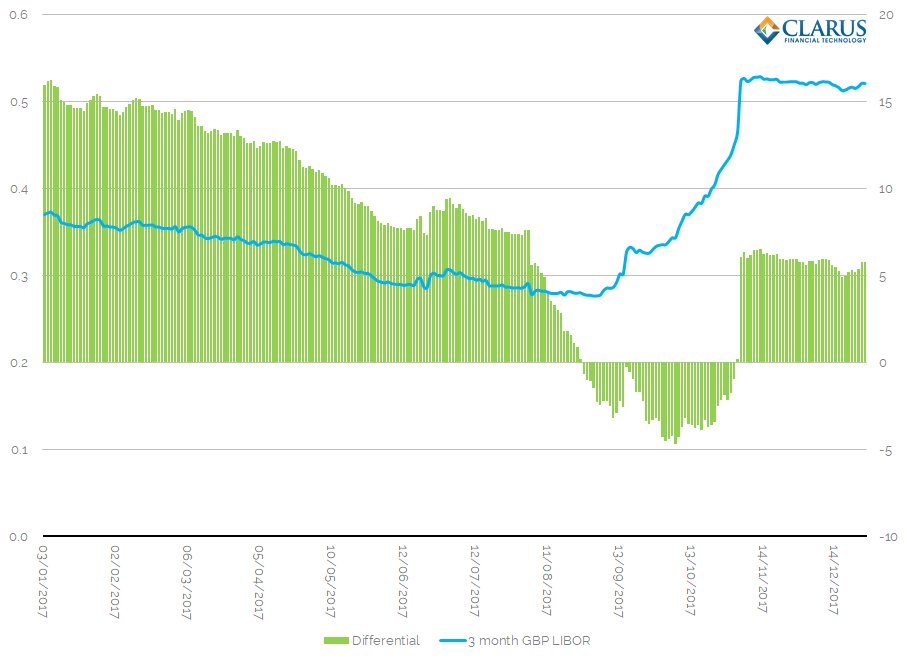
Having had a (very brief) look at this, it probably means that the spreads will be most sensitive to the look-back period to be used.
We’ll look at much more of this data in the future.
In Summary
- GBP markets are very transparent. The historic data is available to make a detailed study into the fallback methodology.
- Forward-looking LIBOR-OIS spreads can be seen heading into negative territory during central bank hiking periods.
- 1M GBP LIBOR and 3M GBP LIBOR spreads based on 2017 historic data were found to be around 4bp and 8bp respectively.