Continuing with our monthly Swaps review series, let’s look at volumes in March 2017.
Summary:
- USD IRS price-forming volume > $2.5 trillion gross notional
- The highest month ever and 23% up from a year earlier
- SEF Compression activity in USD IRS > $320 billion
- The second highest month on record
- USD OIS volume at > $4.5 trillion is up 33% from previous high (Feb)
- On SEF volume at >$1.9 trillion is double the previous high (Feb)
- Both driven by record amounts of FOMC meeting roll volume
- Volume for USD, EUR, GBP, IRS, OIS and Basis Swaps was $1.76 billion DV01
- The highest month on record (exceeding Dec 2016)
- Tradeweb leading with $564 million DV01
- USD OIS notional was a massive $4.67 trillion
- TrueEx with a spectacular $3.1 trillion of FOMC meeting rolls
- Tullet the largest D2D with $567 billion notional
- CME–LCH Switch volume back up at $96 billion
- Global Cleared Volumes are up at $37 trillion
- LCH SwapClear a massive $34 trillion, up from $24 trillion
- Driven by USD OIS volume up $7.5 trillion from the prior month
- In LatAm volumes up at CME with $516 billion in BRL and MXN
- Inflation Swaps at LCH SwapClear, a new high of $199 billion
- NDFs at LCH ForexClear, a new high of $464 billion
Onto the charts, data and details.
USD IRS ON/OFF SEF
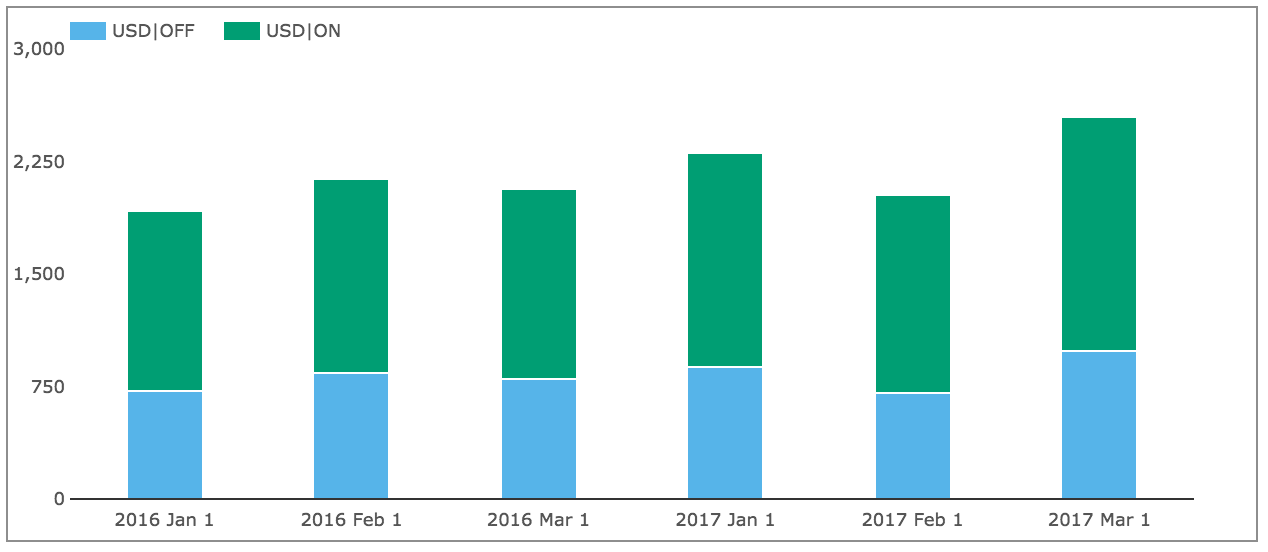
Using SDRView the gross-notional volume of On and Off SEF USD IRS Fixed vs Float price forming trades (Outrights, SpreadOvers, Curve/Flys).
Showing:
- March 2017 On SEF gross notional is > $1.55 trillion
- (recall capped trade rules mean this is understated as the full size of block trades is not disclosed)
- This is 23% higher than March 2016
- And the highest volume on record, exceeding the $1.53 trillion in Nov 2016
- March 2017 Off SEF gross notional is > $990 billion
- 23% higher than March 2016 and the highest since the $1 trillion in March 2015
- Overall gross notional was > $2.5 trillion
- And On SEF vs Off SEF is 61% to 39%, down from 65% to 35% in the prior month
Next On SEF non-price forming trades; SEF Compression and Rolls.

Showing:
- SEF Compression in March 2017 was > $320 billion
- The second highest month ever (after Dec 2016 with > $350 billion)
- 34% higher than a year earlier
- Rolls at > $54 billion were similar to a year earlier
A record month for USD IRS in price forming and portfolio maintenance (compression/rolls).
USD OIS Swaps
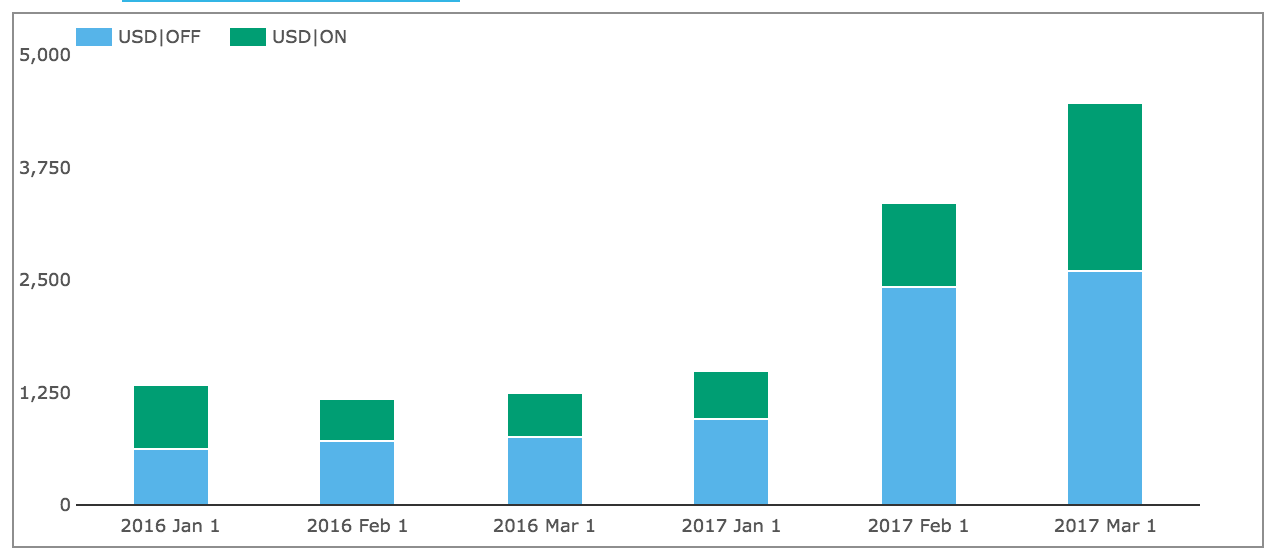
Next USD OIS Swaps volumes.
Showing:
- March 2017 volumes massively up from prior months
- An overall gross notional of >$4.48 trillion
- (recall capped trade rules mean these are understated as the full size of block trades is not disclosed)
- A record month and significantly exceeding the Feb 2017 record of >$3.4 trillion
- Off SEF gross notional at > $2.6 trillion is 7% higher than Feb 2017
- On SEF gross notional at > $1.87 trillion is 100% higher Feb 2017
- Overall volume is 33% higher than the record in Feb 2017
There was record daily volume on March 1, 2 & 3 of > $250 billion, which looks like FOMC Meeting Roll volume, and I will look deeper into this in the SEF section below. Also the FOMC meeting of 14-15 March saw higher than average daily volume.
EUR, GBP, JPY Swaps
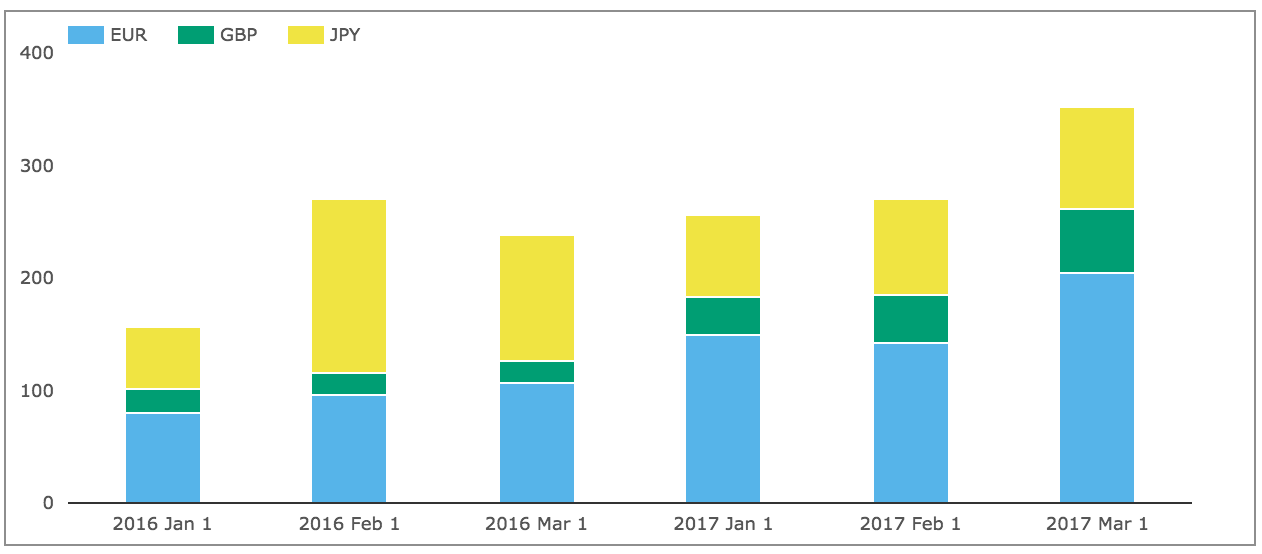
Next On SEF volumes of IRS in the other three major currencies.
Showing:
- Volume in March 2017 was > $350 billion
- 48% higher from a year earlier
- EUR up 92%, GBP up 186% and JPY down 18%.
The overall gross notional in these currencies is 23% of the USD IRS ON SEF volume.
Next SEF Compression activity.
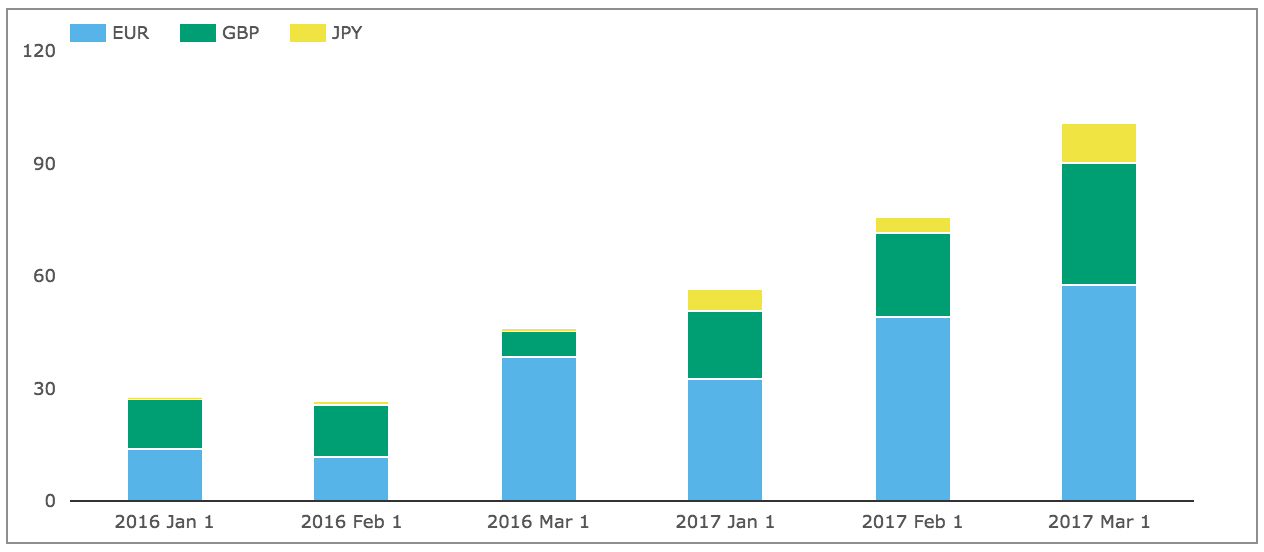
Showing that March 2017 volume was > $100 billion, 120% higher than a year earlier and equivalent to 31% of the USD IRS Compression figure of >$320 billion.
The higher volumes in EUR reflecting what we saw in USD above.
EONIA and SONIA
Next lets check how volumes in EONIA & SONIA have performed.
Showing that March 2017 volume was > $1.17 trillion, up 33% from a year earlier, with EONIA up 65% and SONIA down 52%.
SEF Market Share
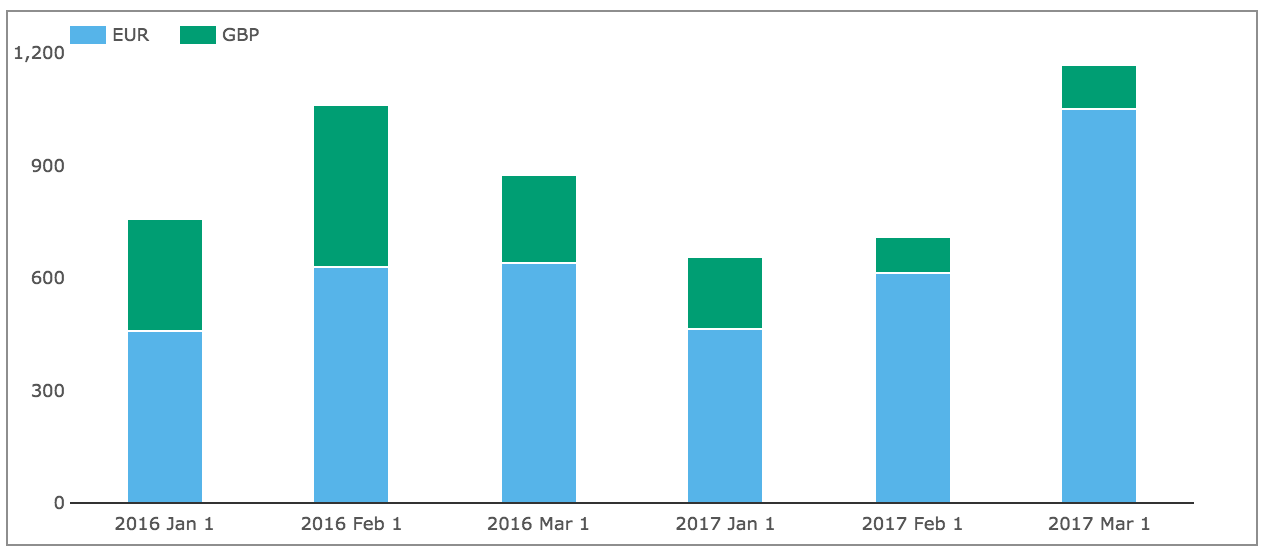
Lets now turn to SEFView and SEF Market Share in IRS including Vanilla, Basis and OIS Swaps.
DV01 (in USD millions) by month for USD, EUR, GBP and by each SEF, including SEF Compression trades for the prior three months.
Showing that:
- March volume at $1.76 billion DV01 is higher than prior months
- March is the highest month on record, exceeding the $1.68 billion in Dec 2016
- Tradeweb has by far the highest volume at $564 million, up a massive $187 million
- (We know from SDR that March was a record month for SEF Compression)
- Bloomberg next with $478 million
- TrueEx with $56 million
- All the D2D SEFs are up from prior months
- Tradition with $230 million in the lead, up $74 million
- Followed by IGDL/ICAP with $185 million
- Then Tullet, BGC and Dealerweb
In gross notional terms $2.775 trillion of USD IRS traded On SEF in March 2017.
Meaning that the $1.87 trillion in SDR for On SEF Price-forming and Compression should be increased by 48% to equal the SEF reported number, suggesting a much larger number of trades above block size in the month than usual (given this percentage is usually 30%).
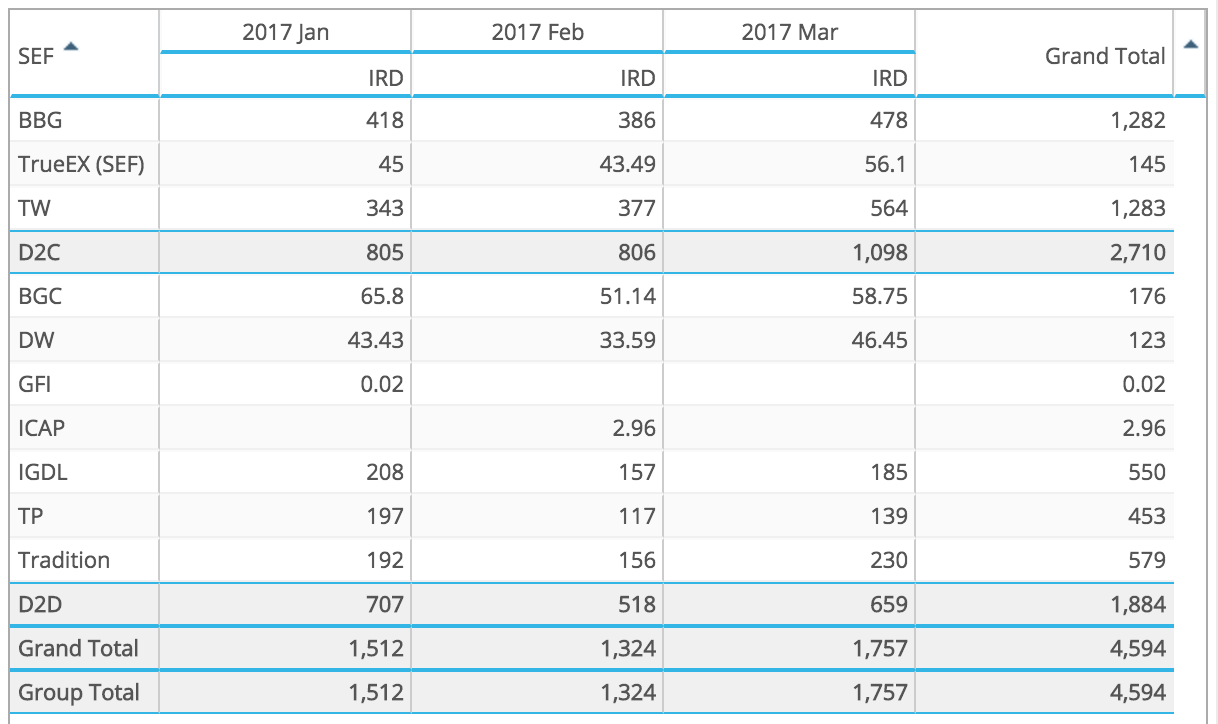
In gross notional terms $4.67 trillion of USD OIS was reported On SEF as the table below shows.

Showing:
- TrueEx with a spectacular $3.1 trillion of volume
- I assume this is FOMC Meeting Roll volume
- As TrueEx just for 2-Mar shows $648 billion
- In D2D volumes are also up across the board
- Tullet the leader with $568 billion
- Followed by BGC and ICAP/IGDL
An interesting month indeed for SEFs.
CCP Basis Spreads and Volumes
In SEFView we can isolate CME Cleared Swap volume at the major D2D SEFs (on the assumption that this is all CME–LCH Switch trade activity). Lets look at this for the past 3 months.
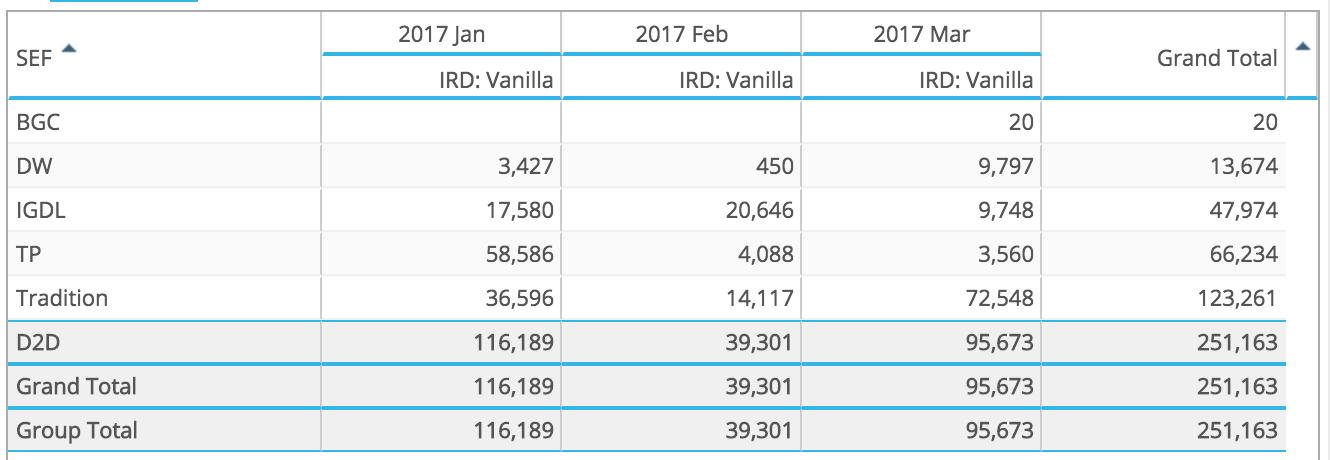
Showing:
- Overall volume in March was $96 billion
- Close to the record high of $116 billion in Jan 2017
- Tradition with the highest volume at $72.5 billion
- Again as happened in Jan at TP, we see 2Y with $30 billion, making up a lot of this volume
- DW showing $9.8 billion, much higher than in the past
- ICAP/IGDL with $9.7 billion, down from the prior month
CME-LCH Basis Spreads ended the month at 2.65 bps for 10Y and 4.20 bps for 30Y, up 0.25bps and 0.40 bps.
Global Cleared Volumes
Next lets move onto CCPView and Global Cleared Swap Volumes of EUR, GBP, JPY & USD Swaps (IRS, OIS, Basis, ZC, VNS types).
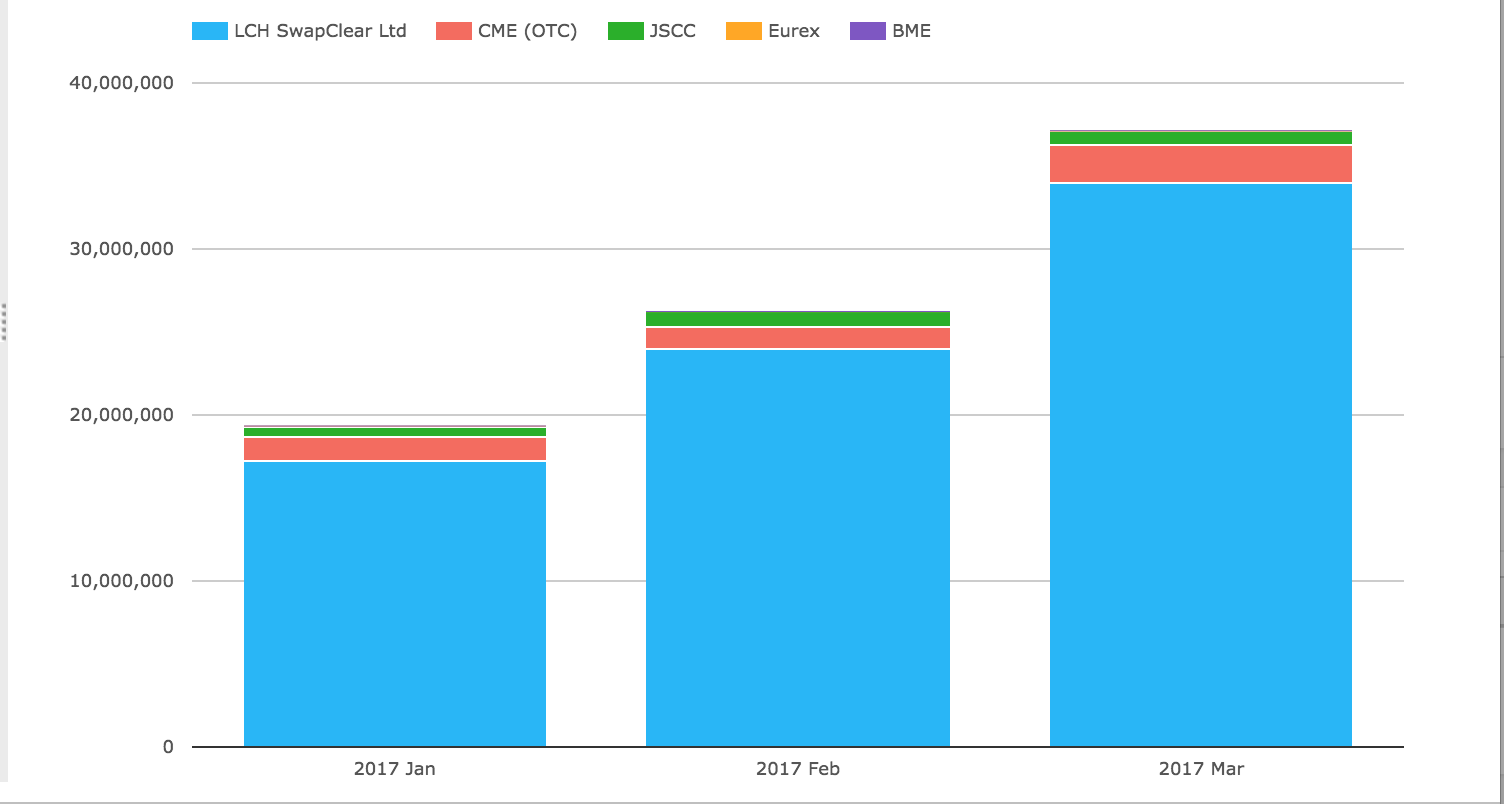
Showing:
- Overall Global Cleared Volumes in March 2017 of $37.2 trillion
- A record month, 41% higher than Feb 2017, which itself was a record
- LCH SwapClear volume at $34 trillion is up from $24 trillion!
- CME volume at $2.2 trillion, up from $1.3 trillion
- JSCC volume at $842 billion is down from $866 billion
- Eurex with $79 billion, up from $42 billion
- BME with $73 million, up from $16m
Looking in more detail at the LCH SwapClear and CME numbers.
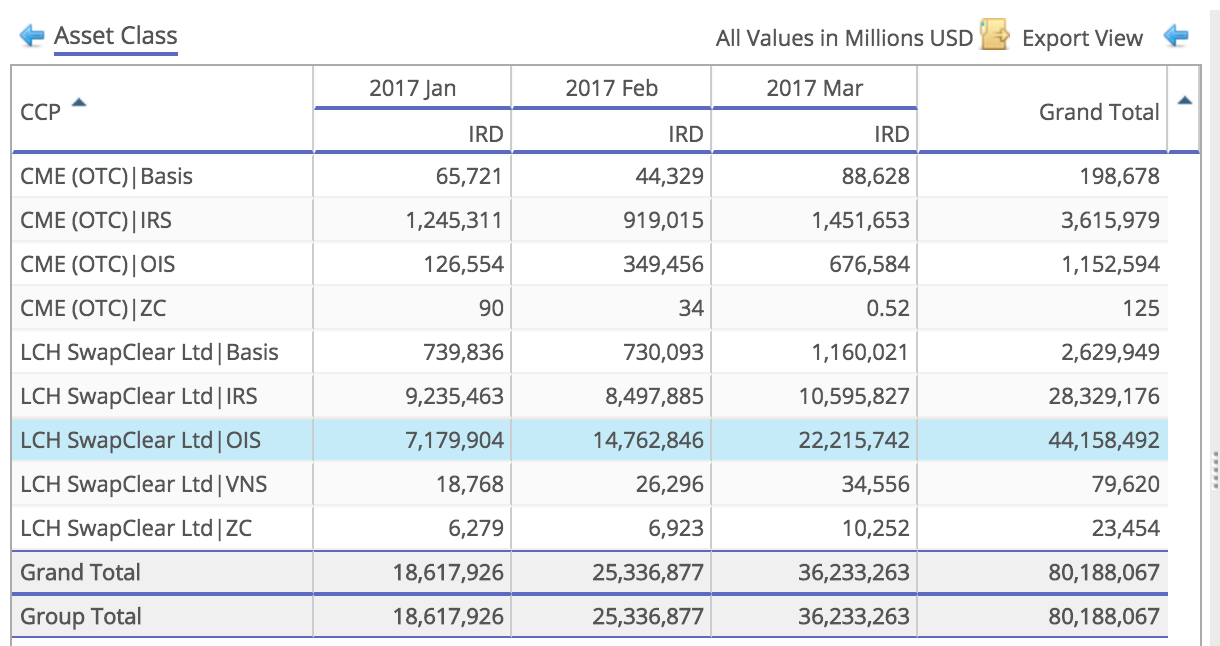
We see that:
- LCH SwapClear OIS is the largest in March with $22 trillion
- This is up $7.45 trillion in March from Feb
- Echoing what we saw in US SDR and US SEF data
- LCH SwapClear IRS is the next largest at $10.6 trillion
- This is up $2.1 trillion from the prior month
- CME IRS is next with $1.45 trillion, up 0.5 trillion
- LCH SwapClear Basis Swaps with $1.2 trillion
USD OIS makes up $16.8 trillion of the $22.2 trillion LCH SwapClear OIS total.
Asia and LatAm
Next the volume of AUD, HKD, SGD Swaps (including Vanilla, OIS, Basis, Zero Coupon).
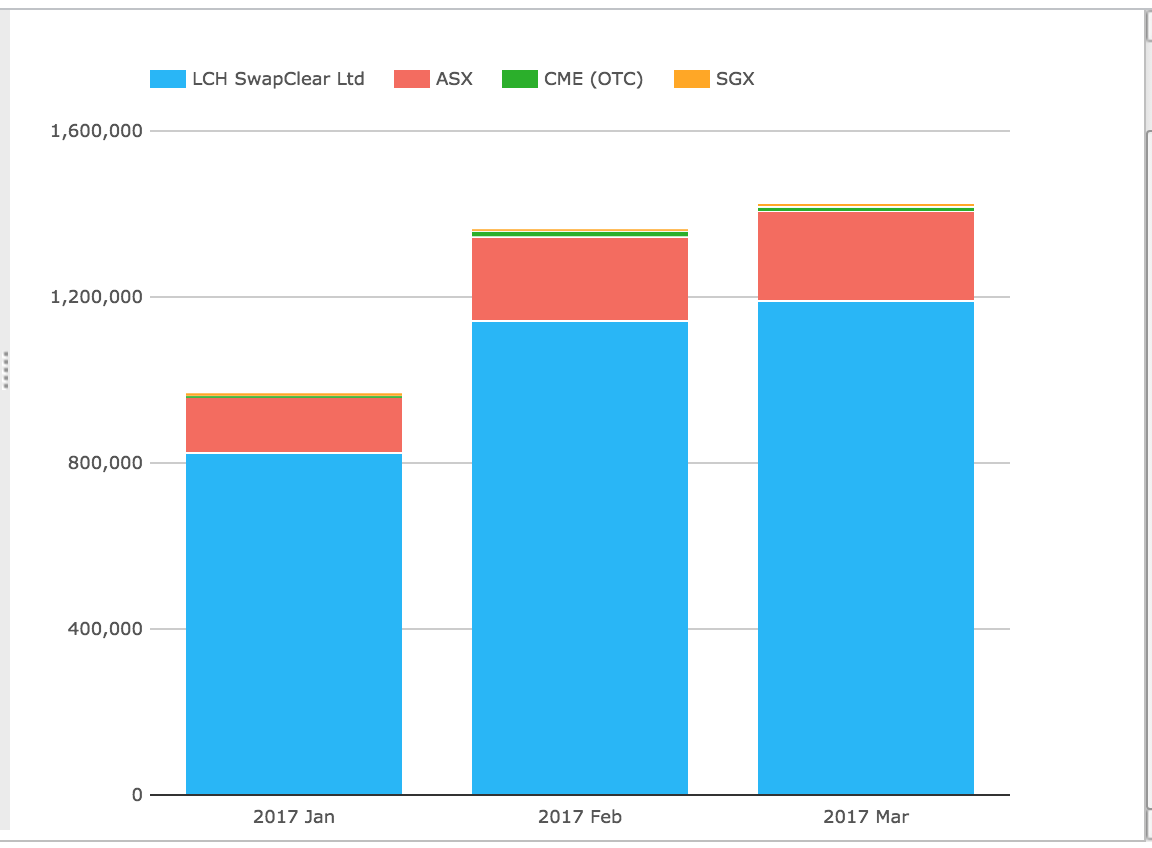
Showing:
- Modest growth from the prior month
- LCH SwapClear at $1.19 trillion up from $1.14 trillion
- ASX at $215 billion up from $203 billion
- CME at $9billion down from $13 billion
- SGX at $9 billion, up from $5 billion
And next the volume of MXN and BRL Swaps.
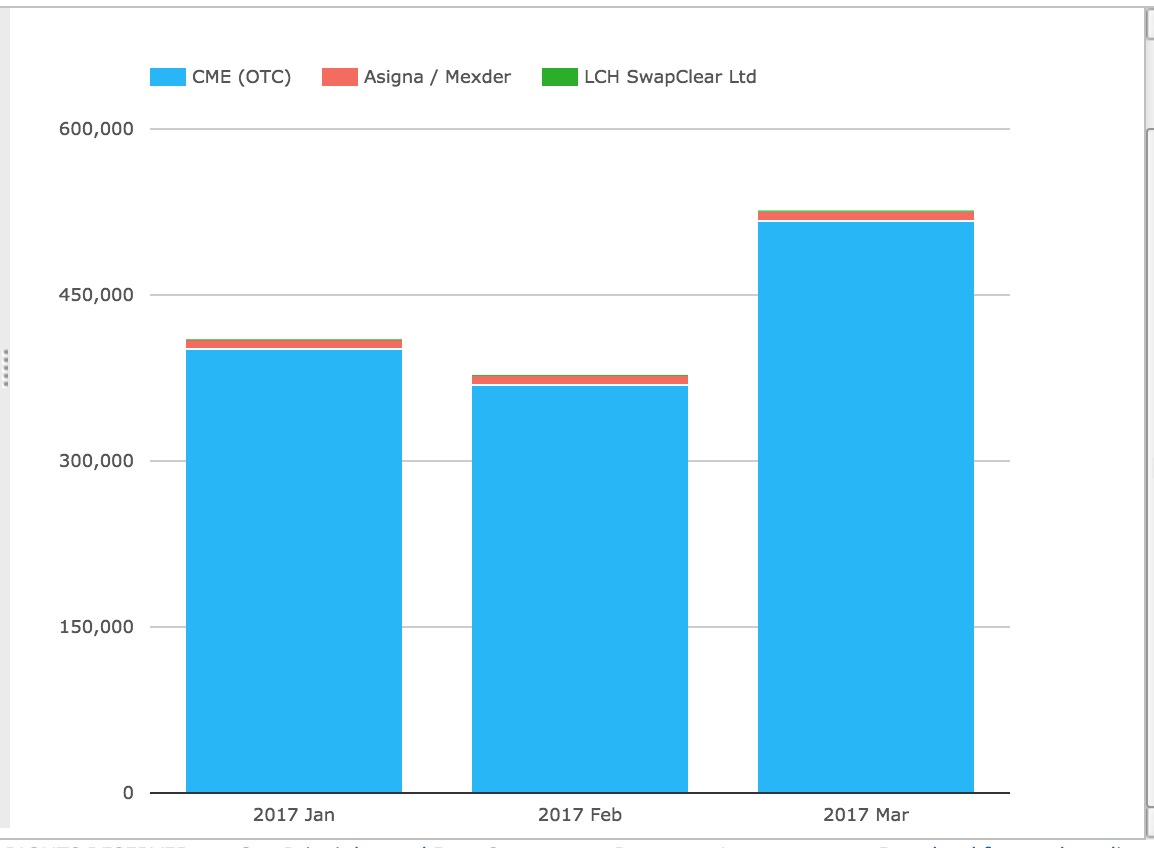
Showing:
- CME at $516 billion, up from $368 billion in the prior month
- Asigna/Mexder with $9 billion, similar to the prior month
- LCH SwapClear with $1.4 billion, up from $829 million
Inflation Swaps
Finally lets look at the two products that have gained the most cleared volume from the Uncleared Margin Rules (UMR), starting with Inflation Swaps.
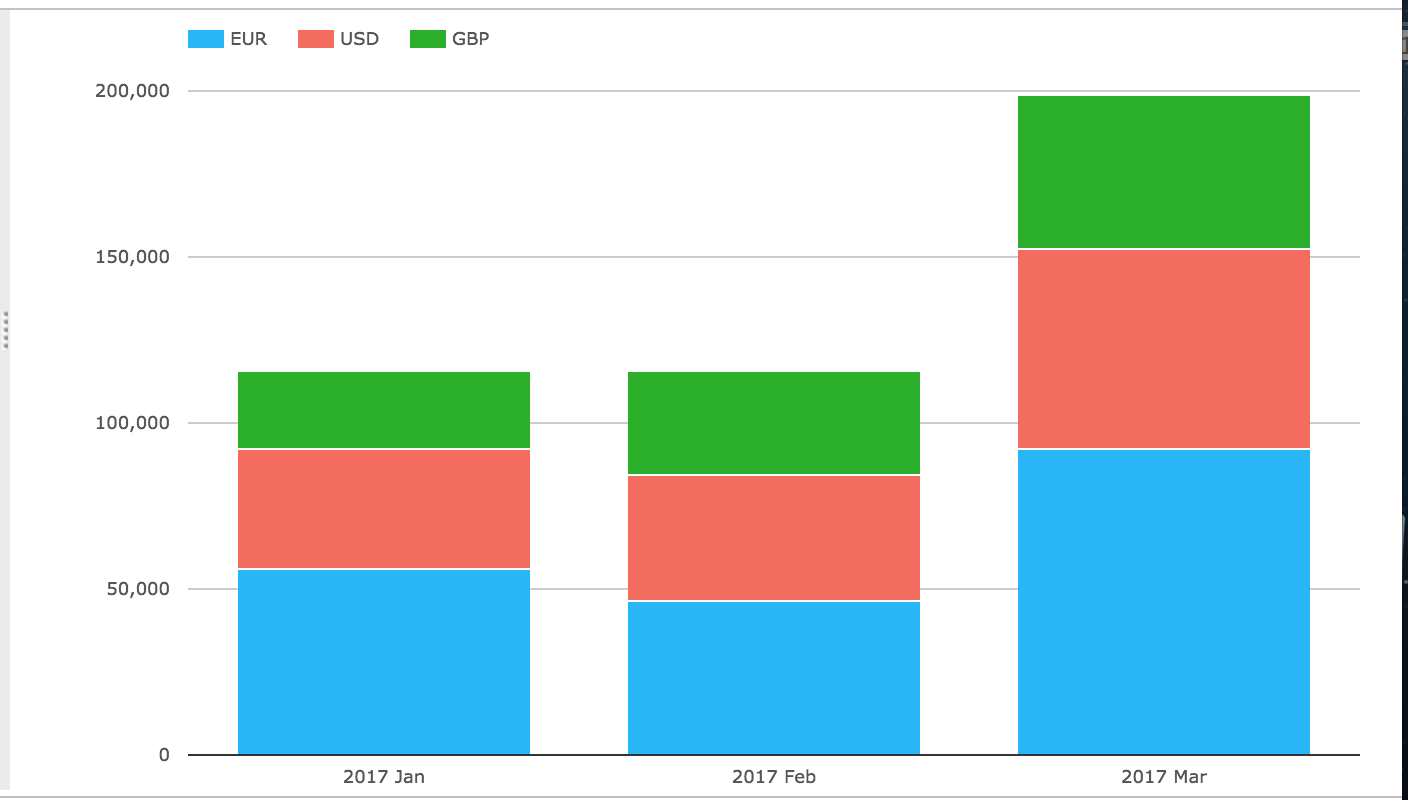
Showing:
- All the volume is at LCH SwapClear
- Total in March is $199 billion, up from $115 billion, a new record high
- EUR is the largest currency at $92 billion in March, up from $46 billion
Non-Deliverable Forwards
And last but by no means least, NDFs.
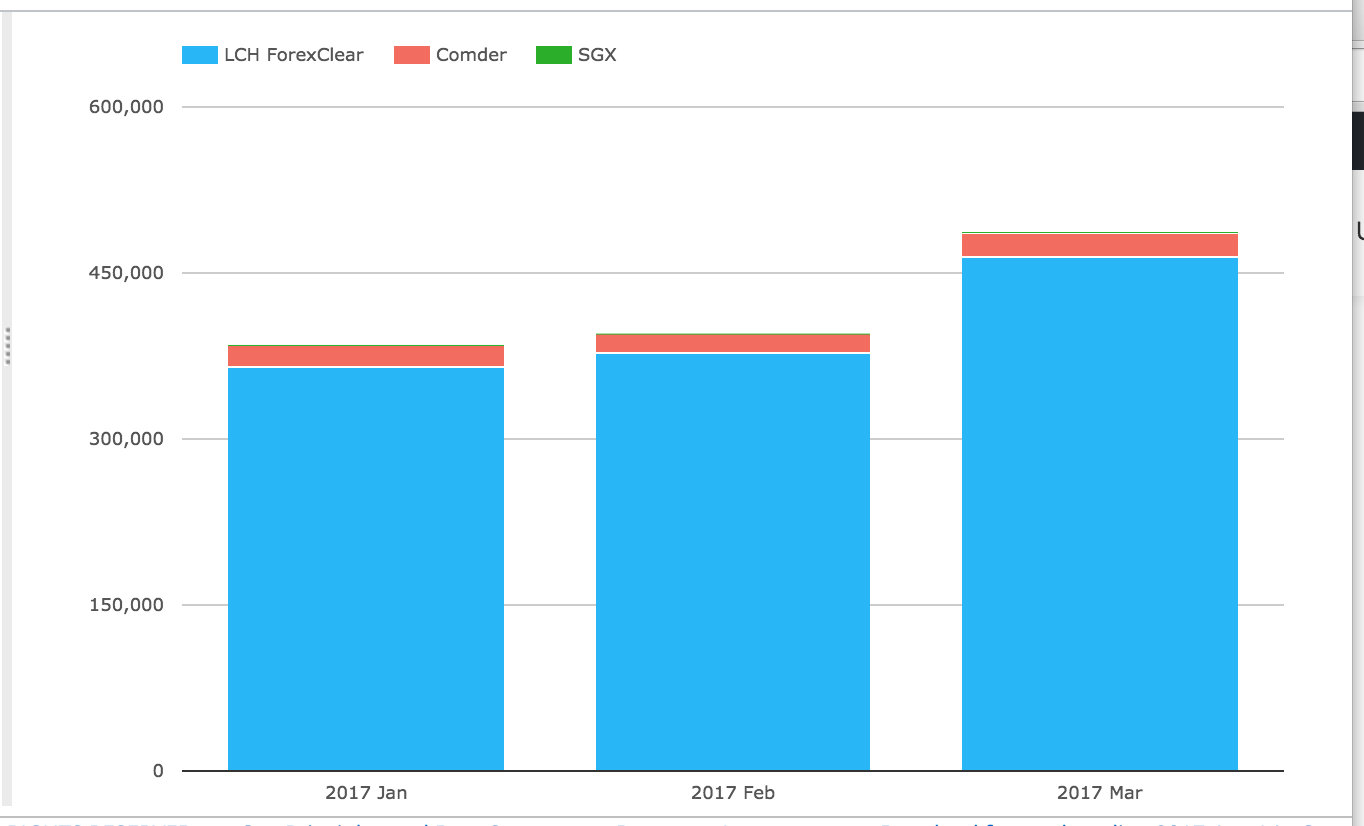
Showing:
- LCH ForexClear with $464 billion, up from $378 billion and a new record high
- Comder with $21 billion
So both Inflation Swaps and Non-Deliverable Forwards continue to post record cleared volumes.
It will be interesting to see how far these products have to go.
A fair way I believe, as client clearing is yet to start in these products.
That’s it for today.
Thanks for staying to the end.
Our Swaps review series is published monthly.