This blog reviews the volumes and central counterparty (CCP) market share of cleared credit derivatives (CRD) and FX derivatives (FXD) in Q1 2025.
Comparing Q1 2025 with Q1 2024, we see 44 percent overall volume increases in cleared CRD – index, single-name, and swaptions.
- USD CRD grew by 46 percent, with LCH share of CDX increasing materially.
- EUR CRD were up 48 percent, with ICE taking the lead in iTraxx swaptions from LCH.
- JPY CRD rose by 16 percent, all at JSCC.
Comparing Q1 2025 with Q1 2024, we see 31 percent overall volume increases in cleared FXD – NDF, options, forwards, and spot:
- NDF volumes were up 26 percent compared with Q1 2024, led by INR, which was up 75 percent.
- FX options volumes grew by 86 percent, with USDJPY increasing by 276 percent.
- FX options outstanding notional increased by 95 percent, with USDJPY increasing by 216 percent.
All the charts and details in this blog are sourced from CCPView.
CRD volumes
First, we look at USD CDX, single-name CDS, and Swaptions.

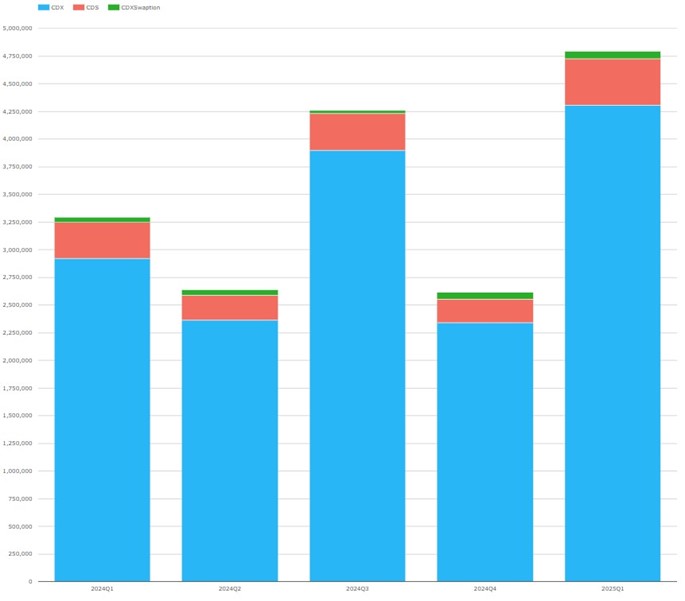
Chart 1: Quarter-by-quarter USD CRD volumes by product (notional USD millions).
Chart 1 illustrates the overall $4.79 trillion of USD CRD in Q1 2025, up 46 percent from $3.29 trillion in Q1 2024.
- USD CDX were $4.31 trillion, up 48 percent from $2.92 trillion.
- Single-name CDS were $417 billion, up 27 percent from $329 billion.
- CDX swaptions were $70.9 billion, up 61 percent from $44.1 billion.
Now we look at USD CRD market share. ICE Clear Europe has dropped out of our five-quarter analysis after it shut down in late 2023, leaving a two-horse race between ICE Clear Credit and LCH CDSClear. We start with CDX.


Chart 2: Quarter-by-quarter USD CDX market share by CCP.
Chart 2 shows LCH taking a much bigger slice of USD CDX in Q1 2025 compared with Q1 2024.
- ICE Clear Credit had 88 percent of USD CDX in Q1 2025 – down from 96 percent in Q1 2024.
- LCH CDSClear had 12 percent, up from 4 percent.
Next, we look at the market share of USD single-name CDS.

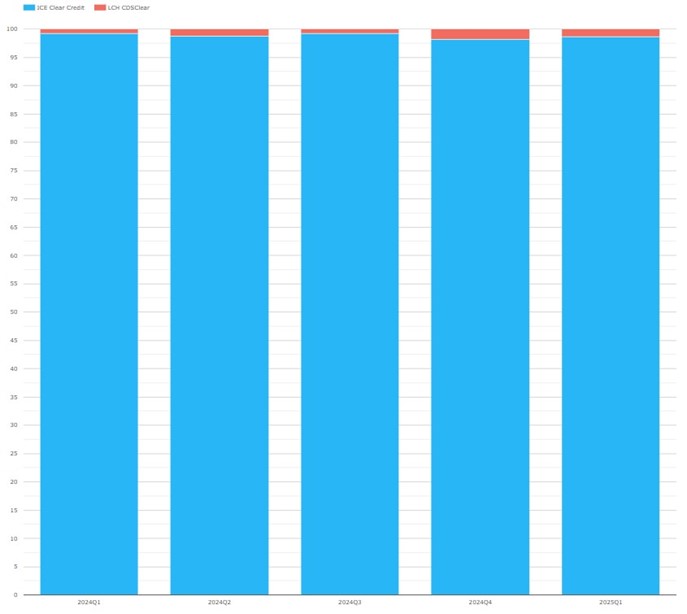
Chart 3: Quarter-by-quarter USD single-name CDS market share by CCP.
Chart 3 shows a slight change in USD single-name CDS CCP market shares in Q1 2025 compared with Q1 2024.
- ICE Clear Credit had 98.6 percent of USD single-name CDS in Q1 2025 – a little bit down from 99.2 percent in Q1 2024.
- LCH CDSClear had 1.4 percent, up from 0.8 percent.
USD CDX swaptions volumes were all at ICE Clear Credit, so I omit the market share chart.
After quite a big USD CDX market share shift in Q1 2025 following a seemingly steady state in the four quarters of 2024, what will the rest of 2025 bring?
Now, we come to EUR CRD.

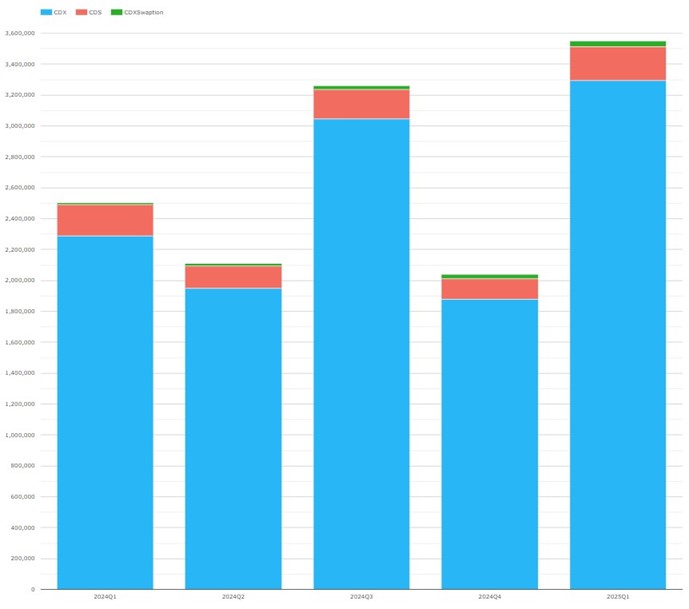
Chart 4: Quarter-by-quarter EUR CRD volumes by product (notional EUR millions).
Chart 4 shows large quarter-on-quarter ups and downs, with EUR CRD volumes settling at €3.41 trillion in Q1 2025, up 48 percent from €2.30 trillion in Q1 2024.
- EUR iTraxx were €3.16 trillion, up 51 percent from €2.10 trillion.
- EUR single name CDS were €212 billion, up 14 percent from €186 billion.
- EUR iTraxx swaptions were €35.4 billion, up 228 percent from €10.8 billion in 2022Q3.
Now, let us look at CCP market share, starting with EUR iTraxx.

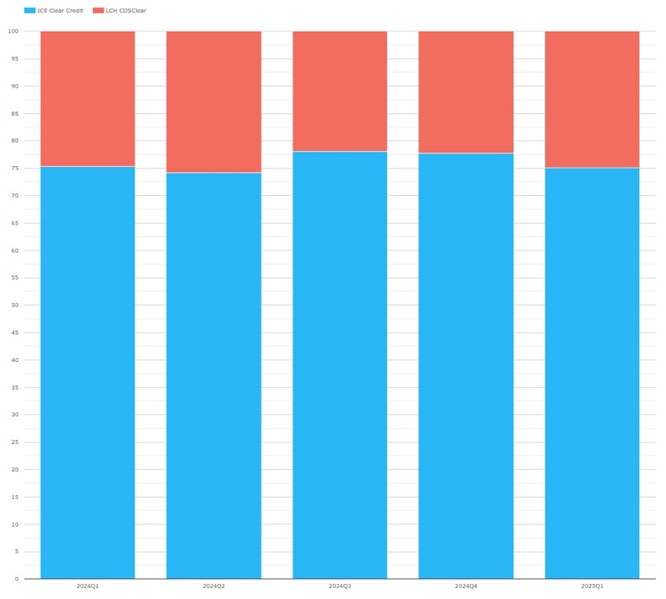
Chart 5: Quarter-by-quarter EUR iTraxx market share by CCP.
Chart 5 shows that EUR iTraxx CCP market shares were flat in Q1 2025 compared with Q1 2024.
- ICE Clear Credit had 75.0 percent, minimally down from 75.3 percent.
- LCH CDSClear had 25.0 percent, slightly up from 24.7 percent.
Next, we come to CCP market share of EUR single-name CDS.

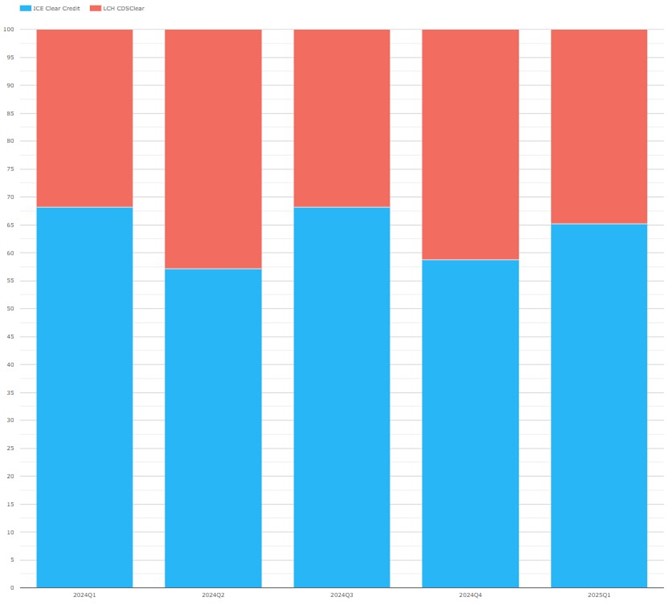
Chart 6: Quarter-by-quarter EUR single-name CDS market share by CCP.
Chart 6 shows that EUR single-name CDS CCP market shares shifted towards LCH in Q1 2025 compared with Q1 2024.
- ICE Clear Credit had 65 percent of EUR single-name CDS in Q1 2025, down from 68 percent in Q1 2024.
- LCH CDSClear had 35 percent, up from 32 percent.
Next, EUR iTraxxSwaptions warrant a chart, as there has been movement.

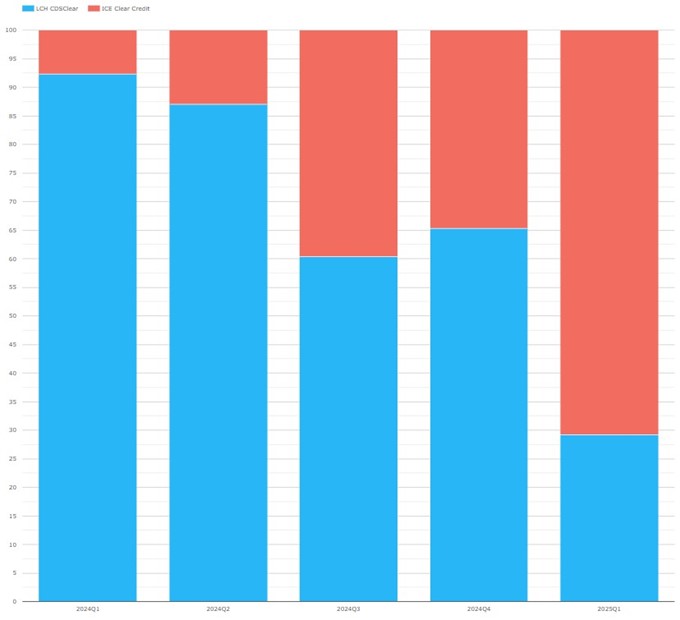
Chart 7: Quarter-by-quarter EUR iTraxx swaptions market share by CCP.
Chart 7 shows that market share flipped.
- ICE Clear Credit had 71 percent of EUR iTraxx swaptions in Q1 2025, up from 8 percent in Q1 2024.
- LCH CDSClear had 29 percent, down from 92 percent.
We wonder what caused EUR CRD swaptions to flip in this way. Feel free to contact us via comments or otherwise if you have a view.
Next, we come to JPY CDX and CDS.

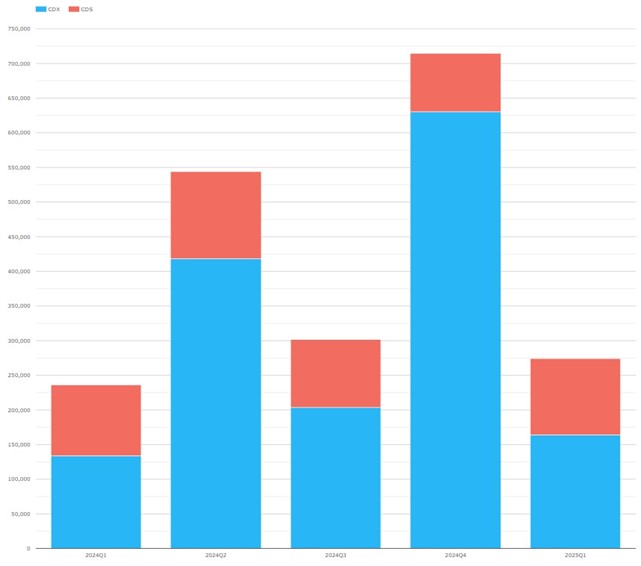
Chart 8: Quarter-by-quarter JPY CRD volumes by product (JPY millions).
Chart 8 shows that JPY CRD volumes in Q1 2025 were ¥274 billion, up 16 percent from ¥236 billion in Q1 2024.
- JPY CDX were ¥164 billion, up 22 percent from ¥134 billion.
- JPY single-name CDS were ¥111 billion, up 8.6 percent from ¥102 billion.
Also, all the volumes were at JSCC.
FXD volumes
First, we look at FXD by product type: non-deliverable forwards (NDFs), options, forwards, and spot.

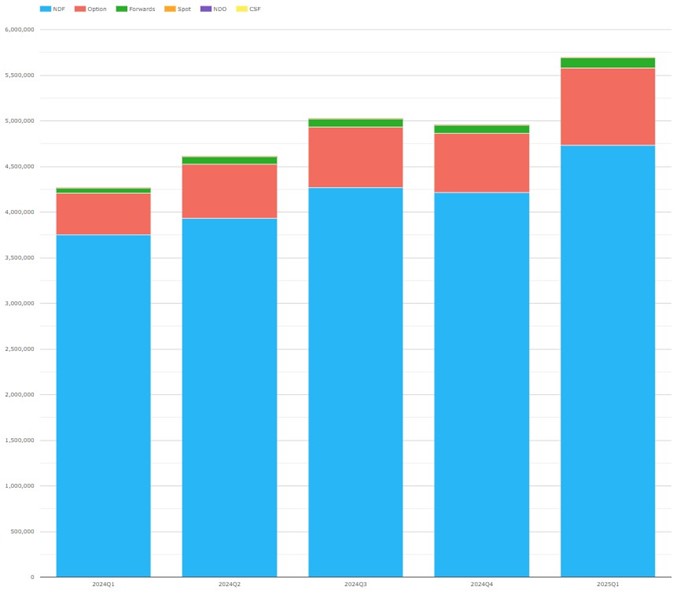
Chart 9: Quarter-by-quarter cleared FXD volumes by product (USD millions).
Chart 9 shows that FXD volumes were $5.70 trillion in Q1 2025, up 34% from $4.27 trillion in Q1 2024.
- NDFs were by far the largest with $4.73 trillion, up 26 percent from $3.75 trillion.
- FX Options were $847 billion, up 86 percent from $456 billion.
- Forwards were $110 billion, up 87 percent from $59 billion.
- Spot was $4.06 billion, up 175 percent from $1.48 billion.
The large year-on-year percentage increases, albeit on low bases, indicate the considerable growth in non-NDF clearing, which made up 15 percent of Q1 2025 FXD compared with 12 percent of Q1 2024.
Next, we view NDF by currency pair.

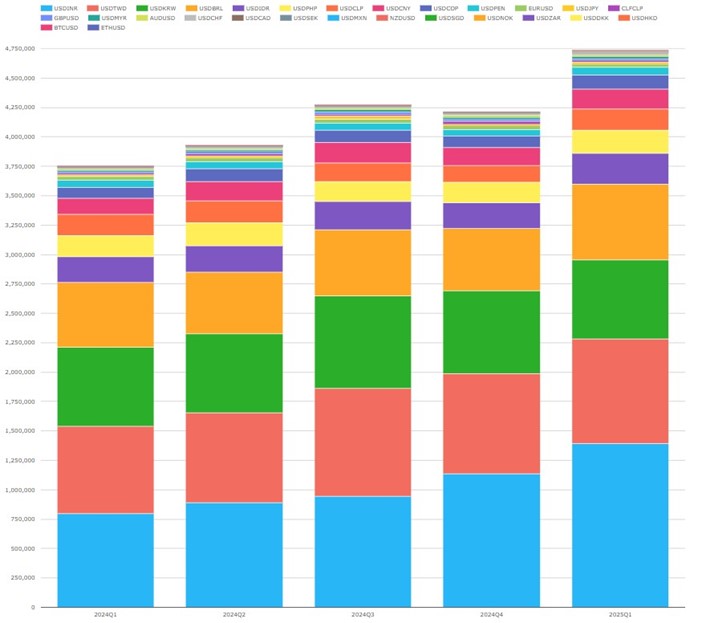
Chart 10: Quarter-by-quarter cleared NDF volumes by currency pair (USD millions).
Chart 10 enables us to break down to currency pair level the 26 percent increase in cleared NDF volumes, shown in chart 9.
- INR was the largest in Q1 2025 with $1.39 trillion, up 75 percent from $796 million in Q1 2024.
- TWD was next with $891 billion, up 20% from $745 billion.
- KRW was $670 billion, flat from $671 trillion.
- BRL was $643 billion, up 17 percent from $551 billion.
- IDR was $264 billion, up 22 percent from $217 billion, making up the same top 5 as a year earlier.
Now, we look at NDF market share by CCP.


Chart 11: Cleared NDF volumes market share by CCP.
Chart 11 shows ForexClear continuing to dominate market share.
- LCH ForexClear had 98.3 percent in Q1 2025, slightly up from 98.0 percent in Q1 2024.
- Comder had 1.6 percent, up from 1.9 percent.
- CME OTC was flat at 0.1 percent.
Now, we drill into FX Options by currency pair.

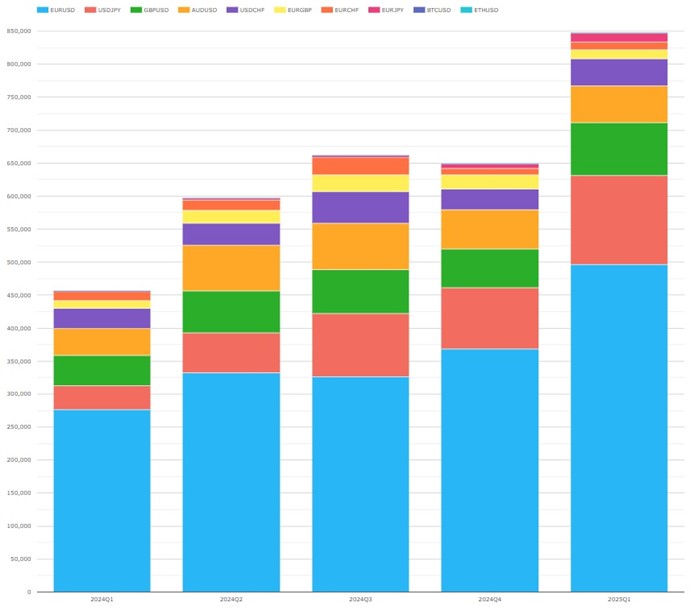
Chart 12: Quarter-by-quarter cleared FX options volumes by currency pair (USD millions).
Chart 12 enables us to break down the 86 percent increase shown in chart 9 to currency pair level.
- EURUSD was by far the largest with $496 billion, up 79 percent from $277 billion.
- USDJPY was next with $135 billion, up 276 percent from $35.9 billion.
- GBPUSD was next with $80.3 billion, up 74 percent from $46.0 billion.
- AUDUSD was next with $55.5 billion, up 34 percent from $41.5 billion.
Since all FX options were at LCH ForexClear, we will skip the CCP market share and instead cover FX options outstanding notional at each quarter end.

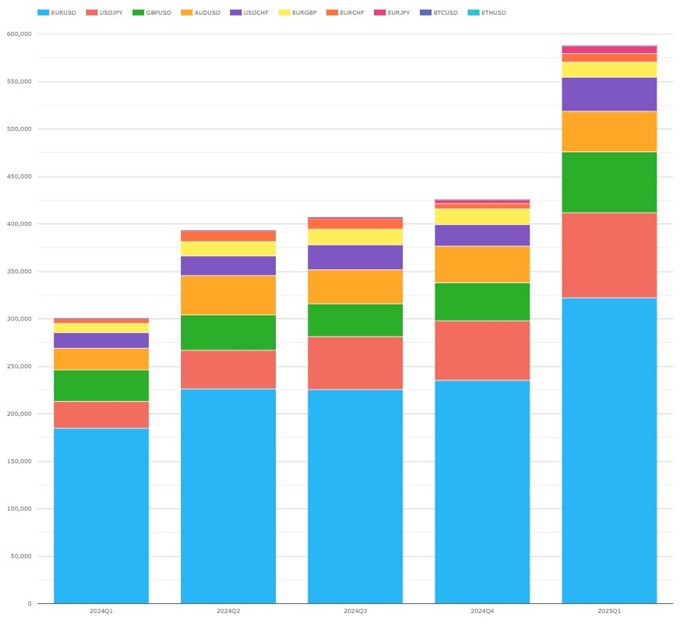
Chart 13: Quarter-by-quarter cleared FX options outstanding notional by currency pair (USD millions).
Chart 13 illustrates the $587 billion of FX options outstanding notional at the end of Q1 2025, up 95 percent from $301 billion in Q1 2024.
- EURUSD was largest with $322 billion, up 74 percent from $184 billion.
- USDJPY was next with $90.0 billion, up 216 percent from $28.4 billion.
- GBPUSD was $64.2 billion, up 93 percent from $33.3 billion.
- AUDUSD was $42.5 billion, up 89 percent from $22.5 billion.
That’s It
We used 8 charts to cover CRD and 5 to cover FXD.
You can find a lot more data in CCPView, including:
- Analysis by date, week, month, quarter, or year.
- Volume metrics beyond new trade notional to trade count, average daily volume (ADV), open interest, and unwind/maturity.
- More granular CRD volumes at index series or single-name level.
- FXD volumes for exchange traded derivatives.
Contact us if you are interested in a subscription.