Following on from my article SEF MAT Week 4, IRS Volumes and Spot, Spread, Fwd, Mac, I will look at:
- Figures for Week 5 (Mar 17-21)
- 19 March, a Big Day for 5Y Swaps
- Market share in USD IRS by SEF
- Risk weighted Market Share
Week 5
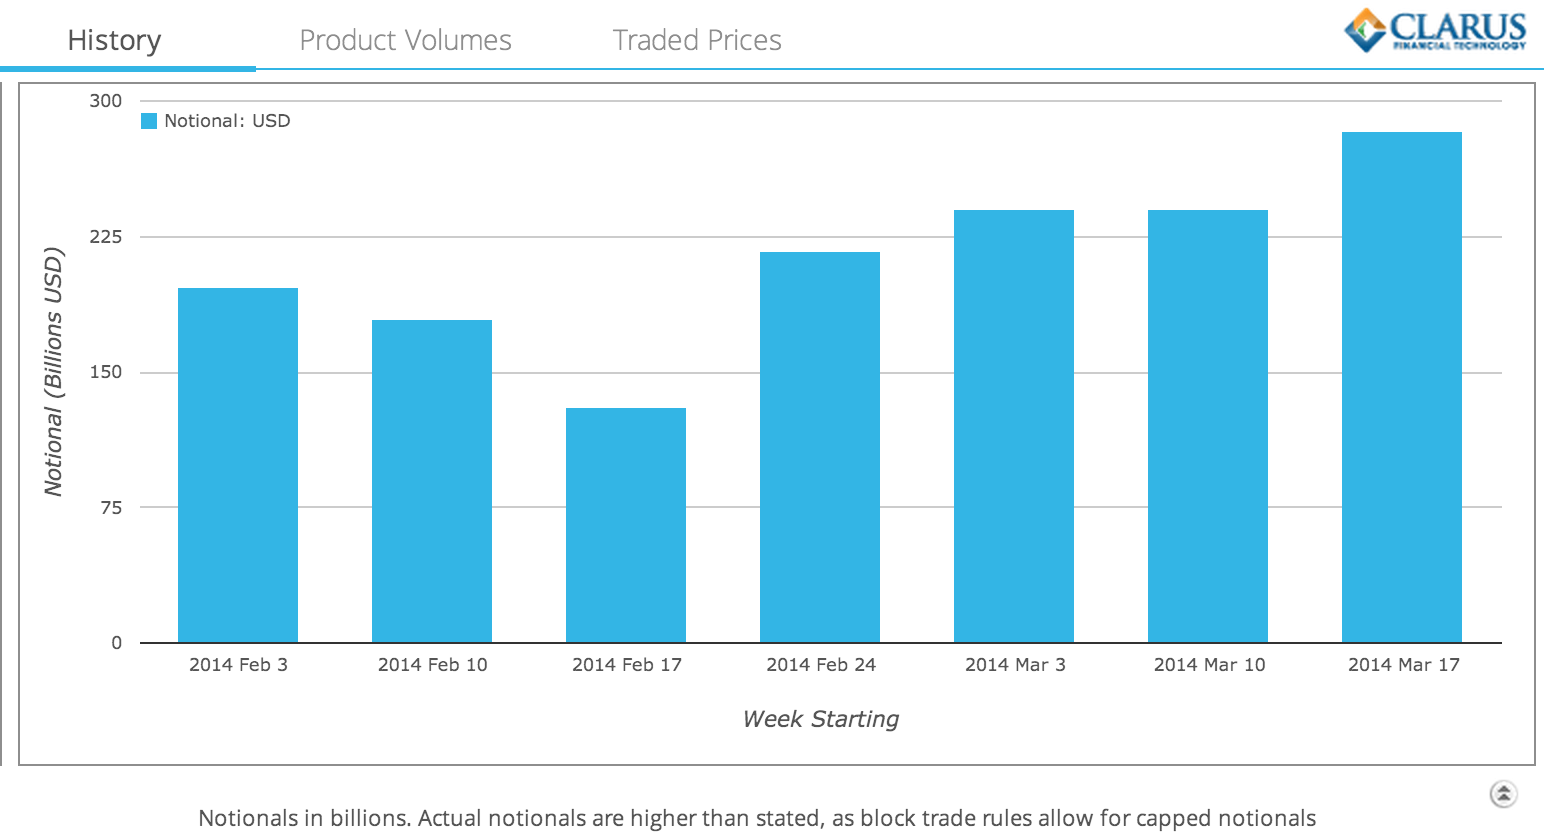
Lets start with a chart from SDRView Researcher of weekly volumes for all USD Interest Rate Swaps in the seven week period starting February 3, 2014.

Which shows that Week 5 volumes are similar to Week 3 and 4.
However lets look at just the On SEF USD IRS Volumes.
From which we can see that:
- Week 5, Mar 17-21, has a volume of more than $284 billion
- This is the highest of any week since SEF trading began on 2 Oct
- The previous high was the week of Jan 6-10 with more than $266 billion
19 March, a Big Day for 5Y Swaps
Using our SDRFix application, we can see that there was a large move in US Swap Rates between 19 and 20 March.
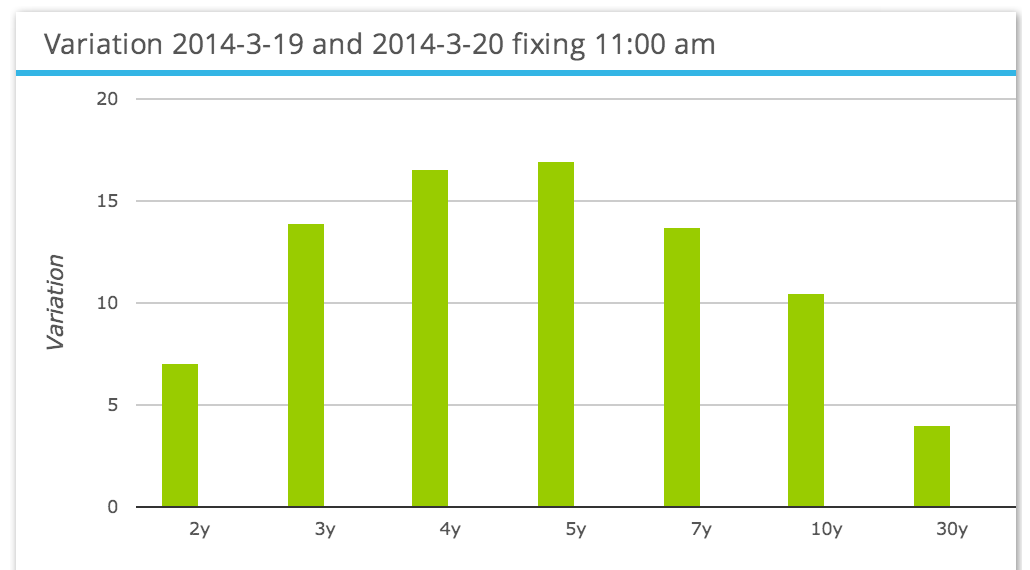
More than 15bps for 4Y & 5Y and more than 10bps for 3Y, 7Y & 10Y.
Significantly more than the 1 to 3 bps moves we see on normal days.
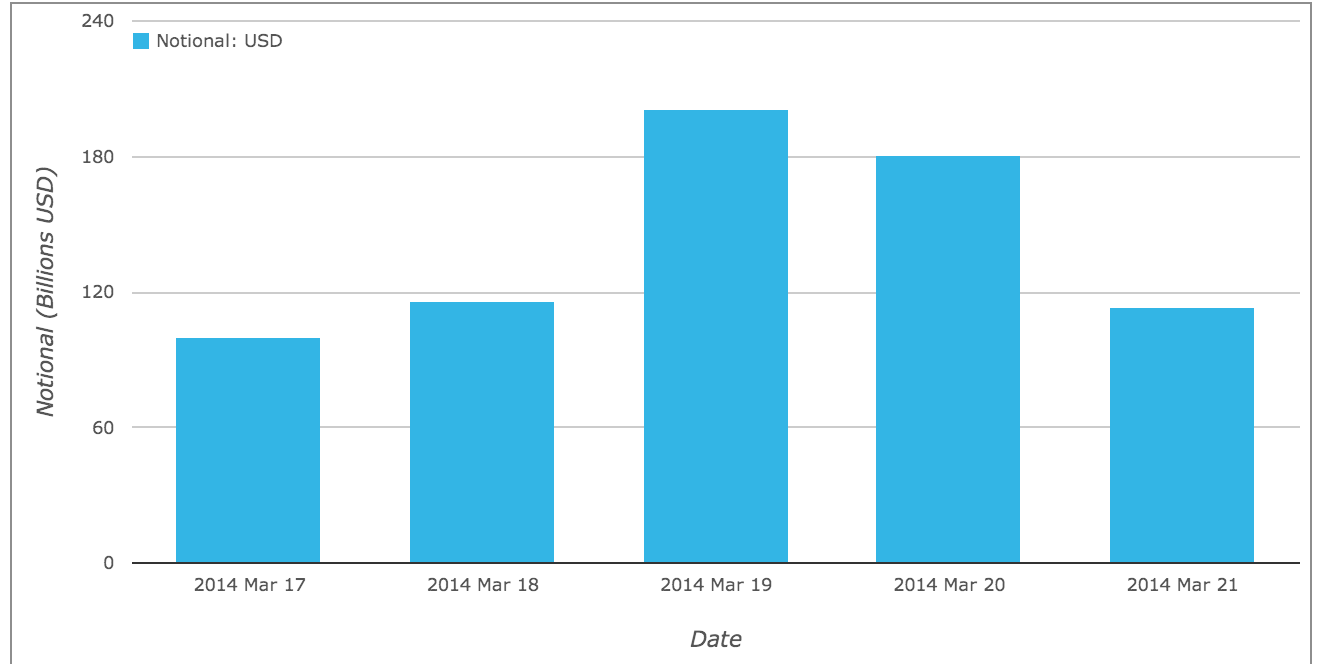
And looking at daily volumes, we can indeed see that the price moves resulted in much higher volumes on the 19 and 20 Marcch.
Using SDRView Professional to look at 19 March volumes by tenor for spot starting vanilla IRS for ON or Off SEF we can see:
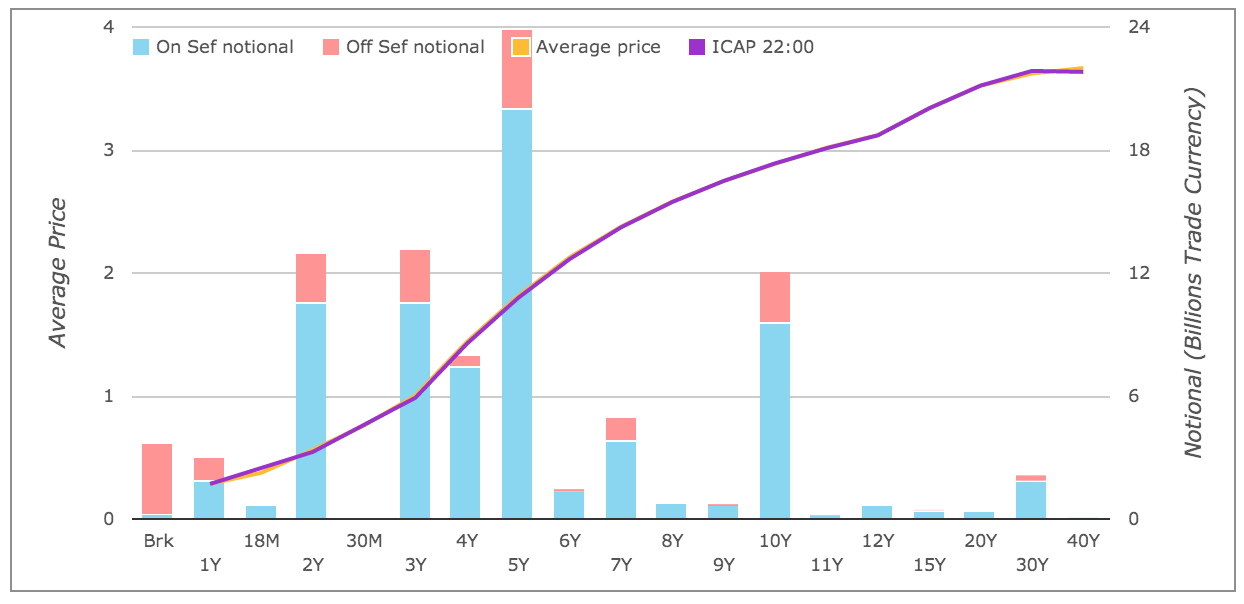
- 5Y volume is > $24 billion
- Double the $12 billion that I believe is usual
- 2Y, 3Y, 10Y are all around $12 billion, much higher than usual
- 4Y is around $7 billion
Drilling down on the 5Y tenor for On SEF, we get:
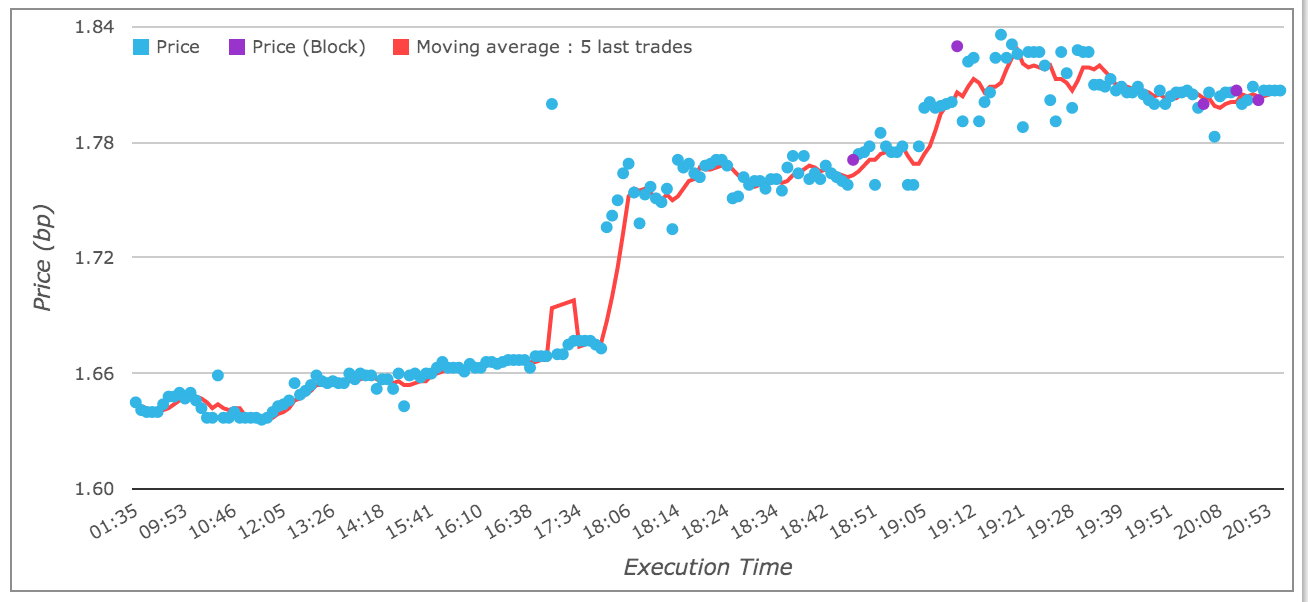
Which shows that the 5Y was trading around 1.675 until 1:48 EST (17:48 LON) and then prices gapped up to 1.736 at 2:04 EST.
And continued their rise to hit the intra-day high of 1.836 at 5:19 EST.
I am sure those of you actively in the market will know what news event caused this move.
There is a lot more to dig into, analyse and learn from.
However I will leave that to those interested to do themselves.
For me that is enough detail.
Market Share by SEF
Lets now turn to SEF market share by using SEFView.
Daily volumes in $ millions for each week in March for USD Vanilla IRS.
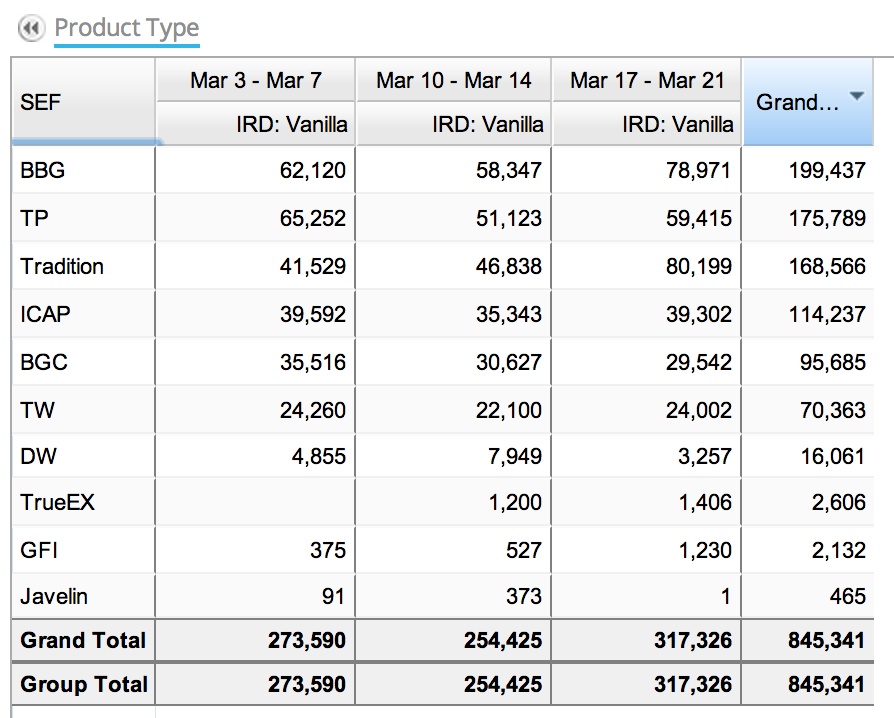
Which shows that:
- Tradition was the big beneficiary of the higher volume traded last week
- Rising from $47b to $80b
- The highest volume posted by any SEF last week
- Bloomberg also gained from $58b to $79b
- The rest did similar volumes to prior weeks
Looking at last weeks figures for each day.
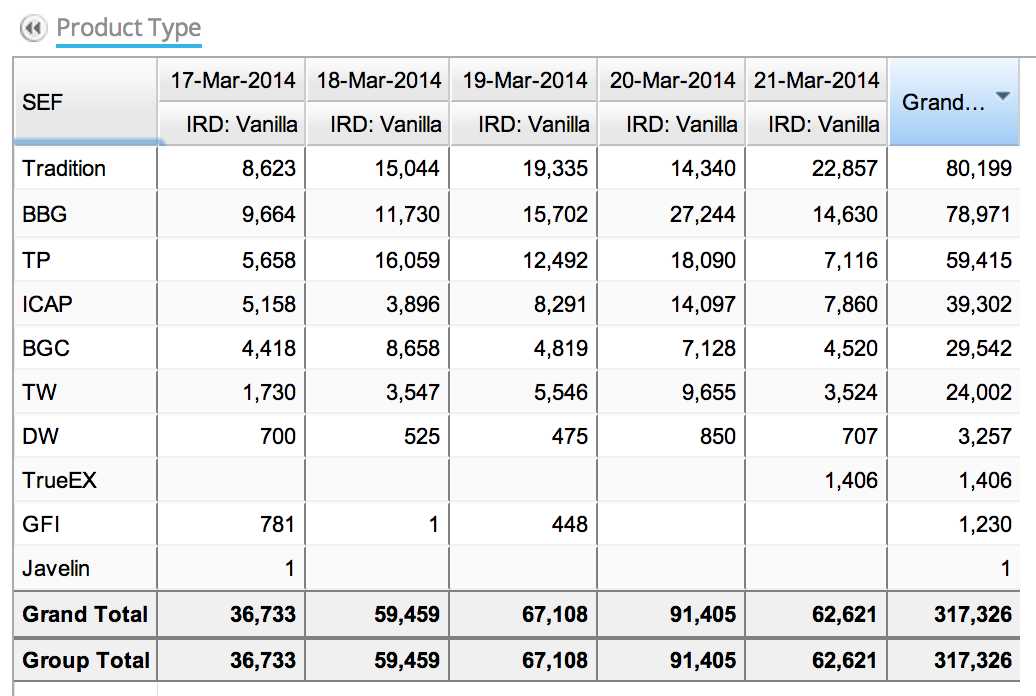
From which we can see:
- Tradition had a big day on 19 Mar with $19b
- Bloomberg had its biggest day on 20 Mar with $27b
- A case of Clients trading following Dealer trading?
- Or as 20 March was the CDX.NA.IG new series roll, did that influence 5Y IRS?
- Or was it some news that moved rates up?
- Or … I leave that to those of you actively trading/broking to fill in
- Tradition then had its highest day on 21 Mar with $23b
- The ranking order for the week is now different from Week 4
- Tradition leads
- Bloomberg follows hot on the heels
- Then the three IDBs (TP, ICAP, BGC)
- TW similar to last week
- DW down in volumes (in a higher volume week?)
- TrueEx and GFI trail
- Javelin brings up the rear with just $1 million
- The $317 billion total for the week is consistent with the SDR figure of $283 billion
- Allowing for the fact the SEF figures includes Fwds/IMMs and the SDR figure is Capped
Risk weighted Market Share
One of the comments we get quite frequently is that for IRS the market share to compare apples to apples requires risk weighting the notionals. As a longer dated IRS is much harder to broker than short dated and costs more in brokerage.
Will this remain true with Bloomberg SEF charging $10 fee per trade irrespective of notional or tenor?
Lets leave that topic for a different day.
While we are currently working on providing Risk Weighting in SEFView, I thought I would estimate these manually and see what difference they make to market share stats. (Any errors are my manual ones in Excel).
Lets assume that for $1m 5Y IRS the DV01 is $450. The DV01 equivalent notional for a 10Y IRS is then $0.54m, for a 30Y it is $0.26m. And for a 1Y it is $6million. So straight away we can see that this should make a significant change in favour of those SEFs will longer maturity trades.
Lets see what difference it makes to the Top 4.
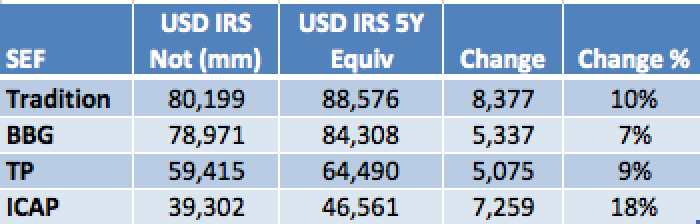
- As it happens, no change for Week 4
- The order remains the same risk weighting or not
- BBG does increase the least, rising by 7%
- ICAP increases the most by 18%
- Meaning that ICAP has a higher weighting of volume above 5Y than the rest
So much for that.
We have heard from folks that certain SEFs are doing more short term than others and we are over-stating their importance.
Well at least for last weeks data, while it is true that using risk weightings will change the relative percentages, it makes no difference in the ranking order.
Once we have this feature in SEFView, we can keep watching for each week.
Thats it for market share.
Those of you that read the Week 4 article, may be wondering about MAC volumes.
I am afraid am going to leave that to a future week.
Summary
Week 5 of MAT, 17-21 March was the highest volume On SEF week ever.
$317 billion was traded On SEF.
5Y Swap rate increased by more than 15 basis points on 19 March.
5y Swap volume traded on 19 March at > $24 billion was twice the average.
Tradition and Bloomberg gained the most volume from Week 4.
Tradition rose to the top, closely followed by Bloomberg.
Risk weighting notionals adjusts for short term vs long term volume.
While some SEFs (e.g. ICAP) increase relative to others.
This did not result in a change in ranking order for USD IRS.
Can’t wait to see what Week 6, the last week in the quarter, will show.
Amir – I’d be very interested in seeing some similar statistics focused on strictly dealer to client SEF activity. Is it possible to report on that?
Barry – we don’t have a great way of doing that as SEFs do not distinguish volume between D2C and D2D. Crudely we could say that TradeWeb and MarketAccess are purely D2C and Bloomberg also has a lot of D2C, while the IDBs are mostly D2D, except perhaps for GFI. We do have this separation in SEFView.