Following on from my article SEF MAT Week 3, IRS Volumes Up and Up, I will look at:
Week 4
Lets start with a chart from SDRView Researcher of weekly volumes for all USD Interest Rate Swaps in the six week period starting February 3, 2014.
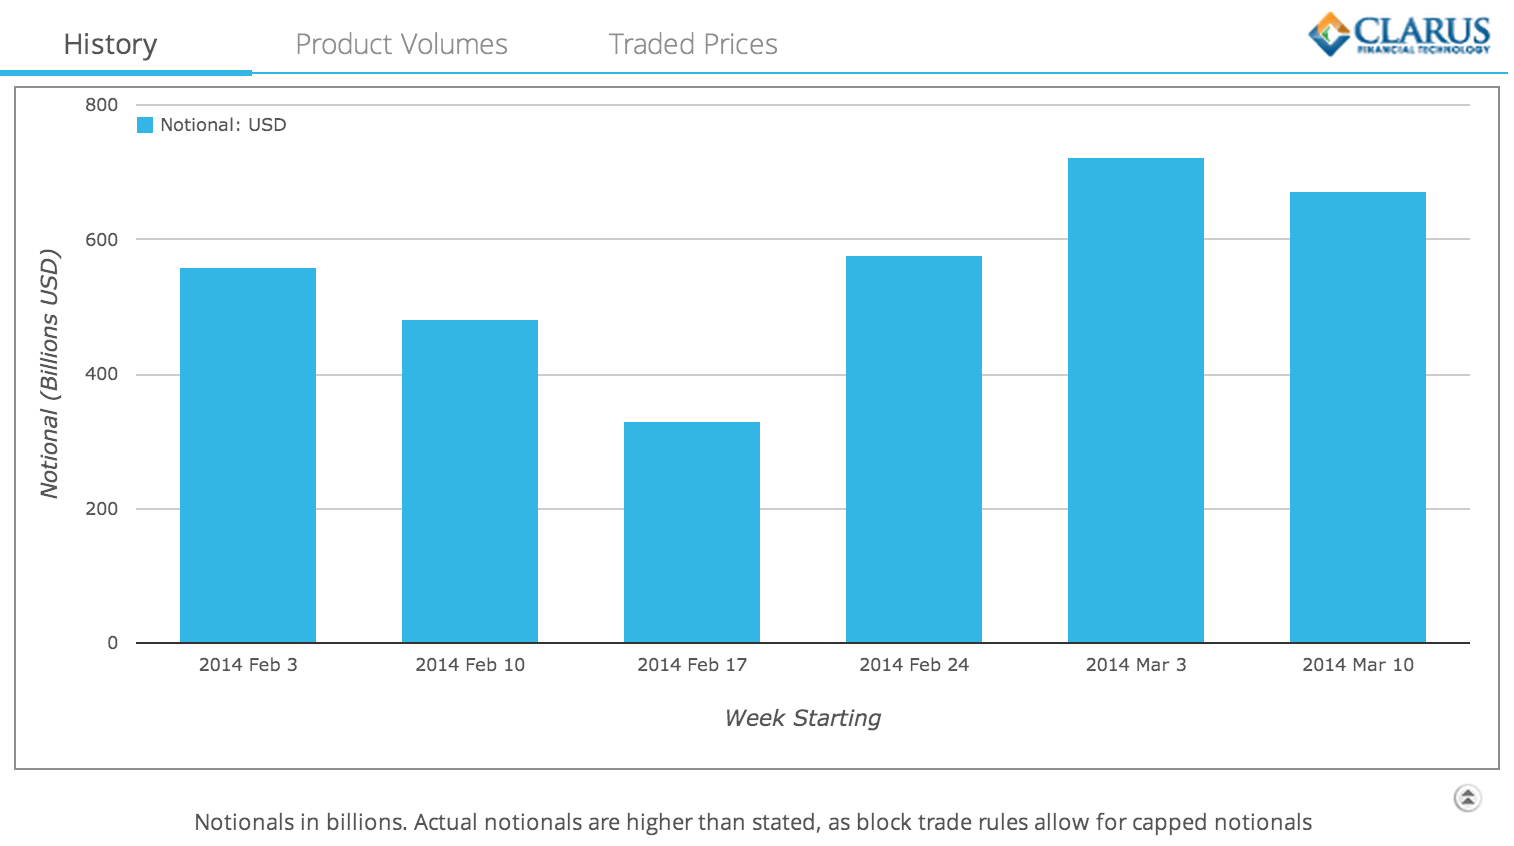
Which shows that Week 4 volumes remain well above the the lows of MAT Week 1 and 2.
Vanilla Spot Starting by Tenor
Lets now use SDRView Professional to look at Week4 volumes by tenor and just vanilla spot starting par swaps.
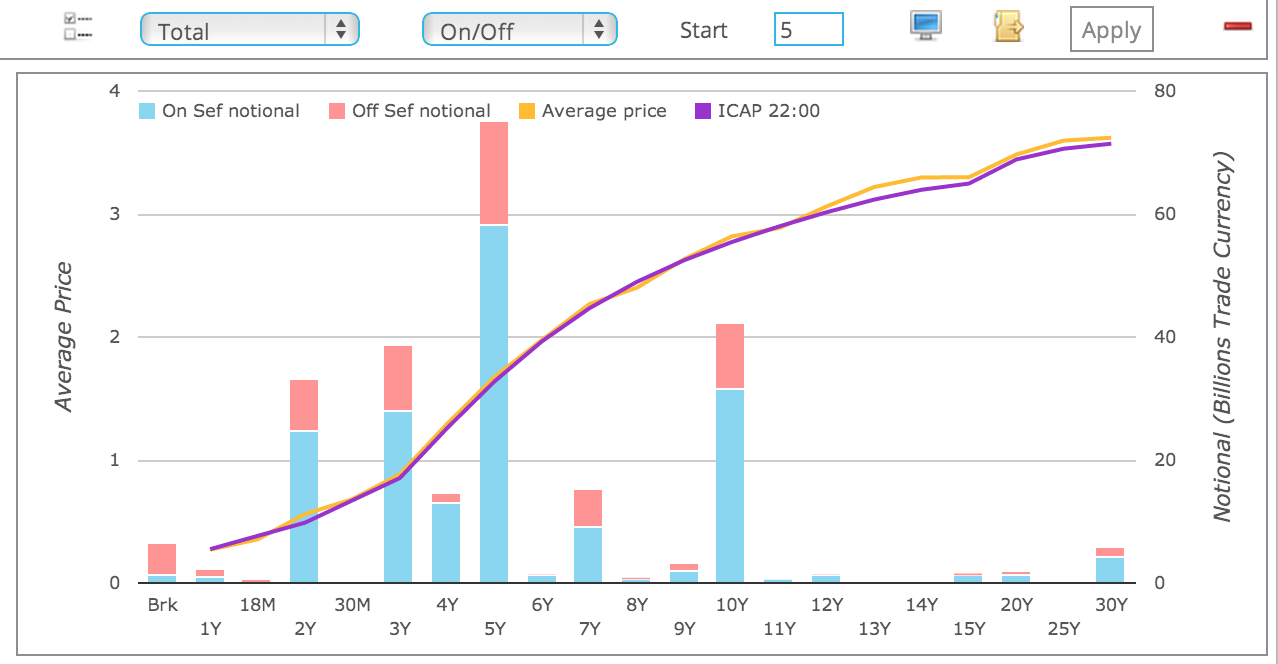
Using this and the table of results (not shown), we can see that:
- For On SEF and Off SEF, there are 3,170 trades of > $246 billion gross notional
- A similar volume to Week 3 (> $233 billion)
- For On SEF there are 2,412 trades of > $180 billion notional
- Of these 142 trades are Capped, representing $32 billion
- Following our rule of thumb, to double the $32 billion and add to $180 billion
- We estimate that total volume traded On SEF (spot start) is approximately $240 billion
Market Share by SEF
Using SEFView we can also look at the volumes reported by the SEF themselves.
Daily volumes in $ millions for Week 4 of MAT for USD Vanilla IRS.
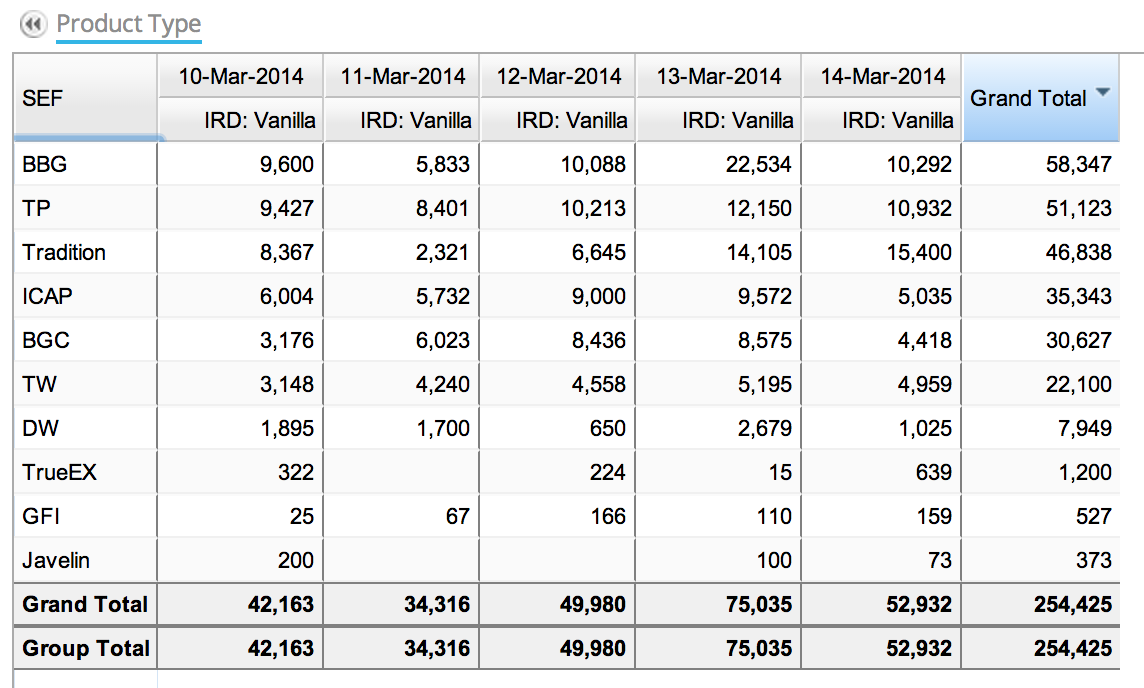
From which we can observe:
- $254 billion traded (similar to Week 2 & 3 volumes)
- This is consistent with our SDR estimate of $240 billion plus Fwds/IMMs
- The SEF ranking order remains the same as Week 3
- Bloomberg leads with $58 billion traded
- The 4 IDBs (TP, Trad, ICAP, BGC) follow
- TW & DW next
- TrueEx makes a showing
- GFI and Javelin make up the numbers
- 10 SEFs reported volume for USD IRS
Types of IRS
Lets now look at the types of trades reported.
In SEFView we can simply drill-down on a figure and export to perform our analysis.
First for one of the Inter-Dealer-Brokers, lets pick ICAP.
What types of Swaps make up the $35 billion gross notional?
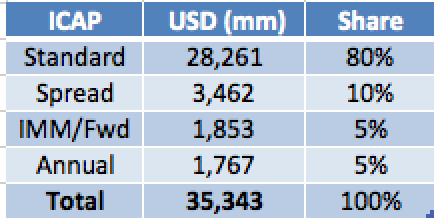
- Standard Swap (3M Libor vs SA) make up 80%
- Spreads represent 10%
- IMM/Forward Starts are 5%
- Annual (3M Libor vs PA) represent 5%
Lets now do the same for Bloomberg.
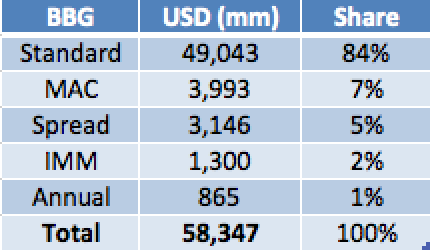
- Standard Swaps make up 84%
- But MAC (Market Agreed Coupon) are the second largest with 7%
- Spreads represent 5%
- IMM 2%
- Annual 1%
MAC Swaps
Which is very interesting.
MAC Swaps are a recent (April 2013) initiative by SIFMA and ISDA to create a contract with pre-defined terms.
So fixed coupon, imm start, standard tenors, even cusips! ( like bonds).
For more details please see the SIFMA page
It is encouraging that a few of the Dealer to Client SEFs are now showing decent volume in these.
In-fact Bloomberg and TradeWeb both show good volume, with GFI also making a showing.
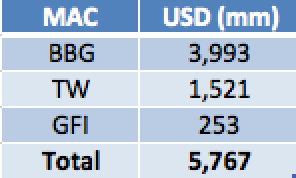
So while the $5.8 billion is a small percentage of the $254 billion traded On SEF; just 2%, it is much more than I was aware of.
It will be very interesting to see whether MAC volumes increase or not.
Summary
Week 4 post MAT, USD IRS Volumes continue to rise from the lows of Week 1 and Week 2.
Market Share of USD IRS remains the same as Week 3, with BBG in front with the 4 IDBs following and TW making a good showing.
So we have six in the race out of ten contenders.
Lets see how it continues.
80% of On SEF USD IRS trades are standard SA Fixed vs 3m Libor Swaps.
On BBG 7% of USD IRS is represented by MAC Swaps.
MAC Swaps also trade on TW and GFI.