In the transition from LIBOR to SOFR, the recent change by Clearing Houses to discount swaps using a SOFR curve instead of a FedFunds curve has long been trailed as a key milestone for higher volumes in SOFR derivatives.
In today’s blog I look at how SOFR Swap volumes did in October 2020.
I also update my September blog, Market Share in EUR Swaps.
SOFR Swap Volumes
In CCPView, we can see monthly volumes YTD in SOFR Swaps, as single-sided gross notional.

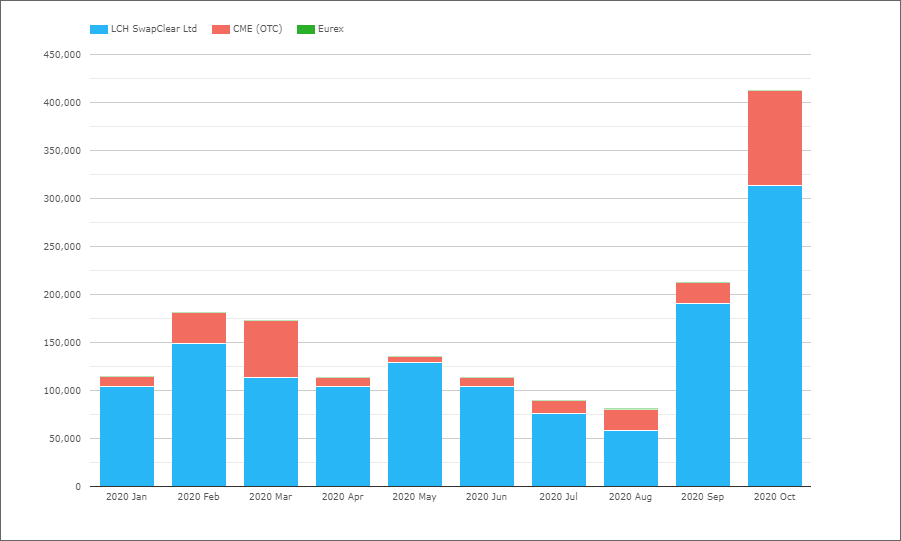
- A big jump in October to a record total of $412 billion, up from $213 billion in September and far higher than the $173 billion we saw in March.
- LCH SwapClear with $314 billion and CME OTC with $98 billion in October, up from $191 billion and $22 billion respectively in September
- A step change in volumes indeed.
As noteworthy is the change in maturity tenor.
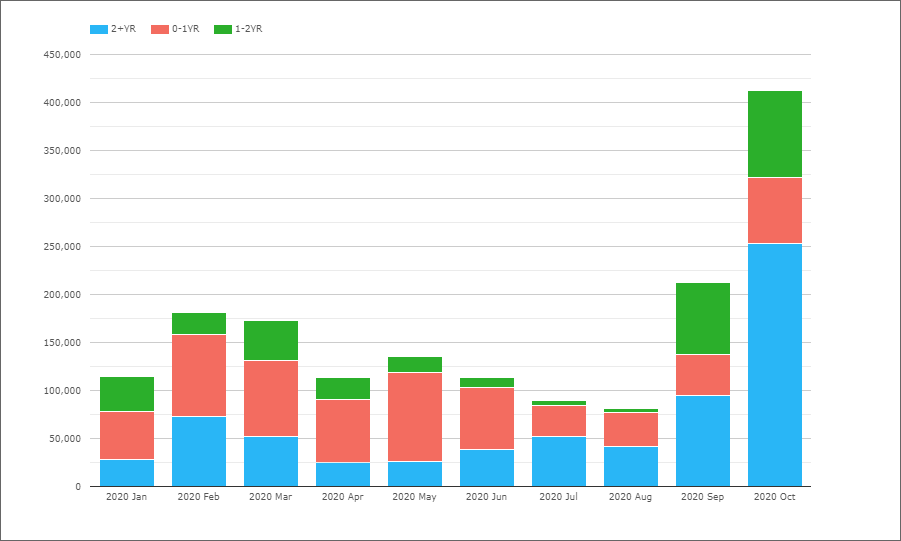
- The > 2Yr tenor bucket showing by far the largest increase, from $95 billion to $254 billion, cementing it’s position as the largest tenor bucket
These large increases in Swaps volume and tenors traded are exactly what the ARRC paced transition plan expected to achieve.
And now that we have such a dominance of > 2Y tenor buckets, it will be useful to get from CCPs further breakdowns into 2Y, 5Y, 10Y, 30Y buckets.
For this and more details on SOFR risk traded compared to Libor, please see the latest version of the ISDA-Clarus RFR Adoption Indicator charts, the monthly publication or today’s new blog on SOFR So Good.
No doubt a big contribution to October volumes are the SOFR Auctions at LCH and CME, which as one-time events will not be repeated, meaning that November SOFR volumes may well be significantly lower.
However as time passes and swap levels change, there will be the need to re-hedge the discounting risk on Swap books as this increasingly moves away from the risk re-stated back to FedFunds by the Basis Swaps created by CCPs.
It will be interesting to see if that means November volumes remain higher than September.
Swaps and Futures Open Interest
SOFR Futures volume in October at $3.8 trillion, did not materially change from prior months and nor was it expected to from the Swaps discounting change.
What is interesting is to look at open interest/outstanding notional of SOFR Futures and Swaps together.
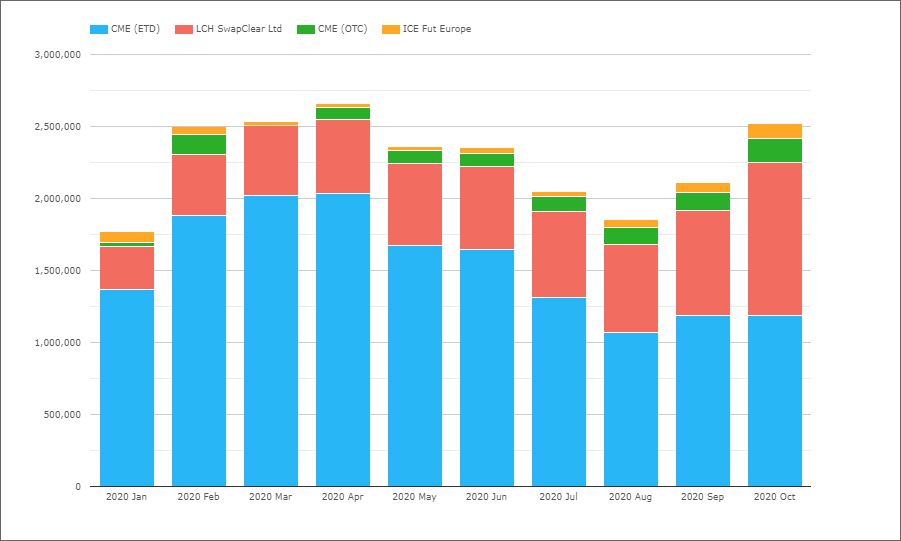
- CME ETD with $1.2 trillion gross notional at end October, similar to the prior month
- LCH SwapClear with $1.06 trillion, up from $726 billion
- CME OTC with $171 billion, up from $128 billion
- ICE Futures with $103 billion, up from $66 billion
The combined open interest now $2.5 trillion, back up close to the high we saw in April, but now with Futures and Swaps almost equal in contribution.
It will be interesting to see how Open Interest and Volume develop in November.
Let’s now switch topics.
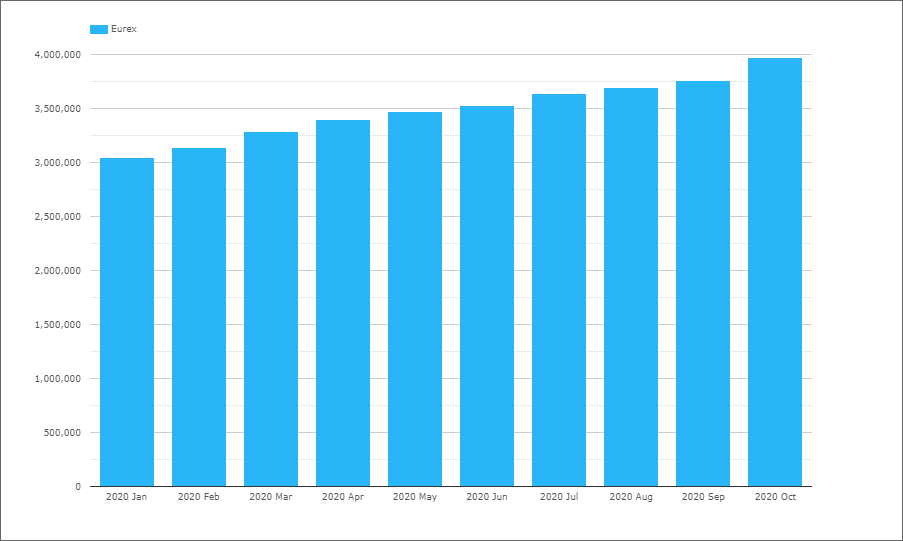
EUR Swap Volumes at Eurex
And update the data I looked at on September 30, 2020 for Market Share in EUR Swaps, starting with monthly volumes at Eurex for IRS, excluding FRA, OIS, Basis, VNS and using single-sided gross notional.
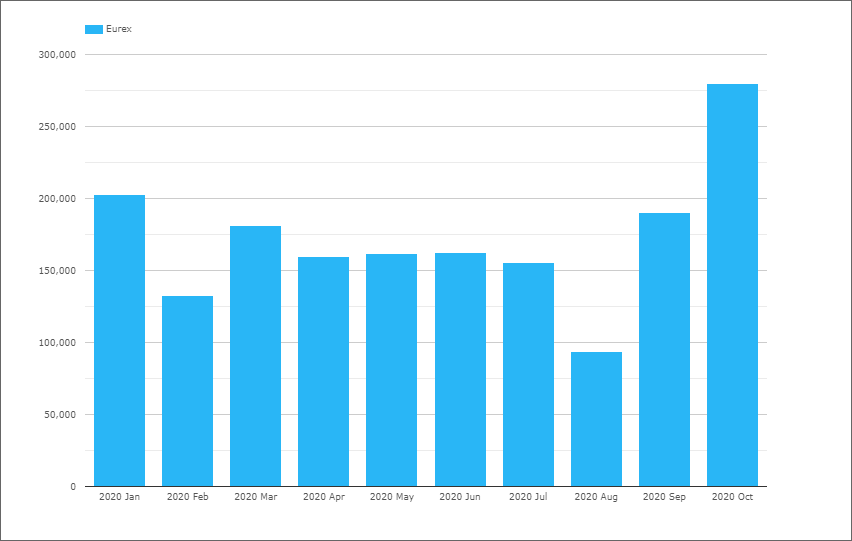
- October a record month with €280 billion, up from €190 billion in September. (Note these figures exclude trade volume generated from compression).
- Drilling down on October by day would show us big volume days on 21-Oct, 13-Oct and 20-Oct.
Next let’s look at Open Interest aka Outstanding notional.
- Steady growth month on month, with a larger increase in the most recent month
- OI on 30-Oct of €4 trillion is up from €3.8 trillion at 30-Sep, an increase of €213 billion, so not far off the €280 billion; the difference down to maturing or un-wound positions.
EUR Swaps Market Share
Next a CCPView chart of the share in EUR IRS monthly volume by CCP.
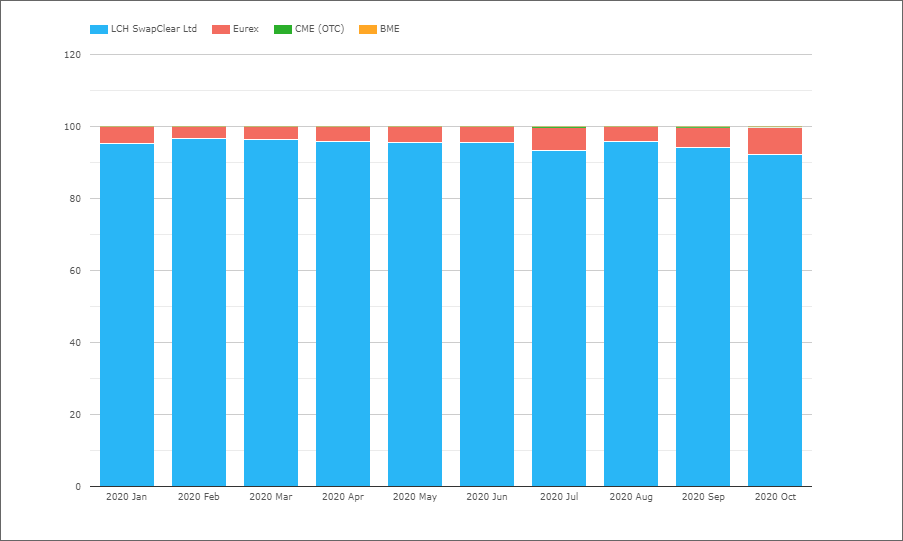
- Showing Eurex up to 7.6% from 5.5% in the prior month, the highest monthly volume share that we have seen for Eurex
And for our final chart, market share in open interest at month ends in 2020.
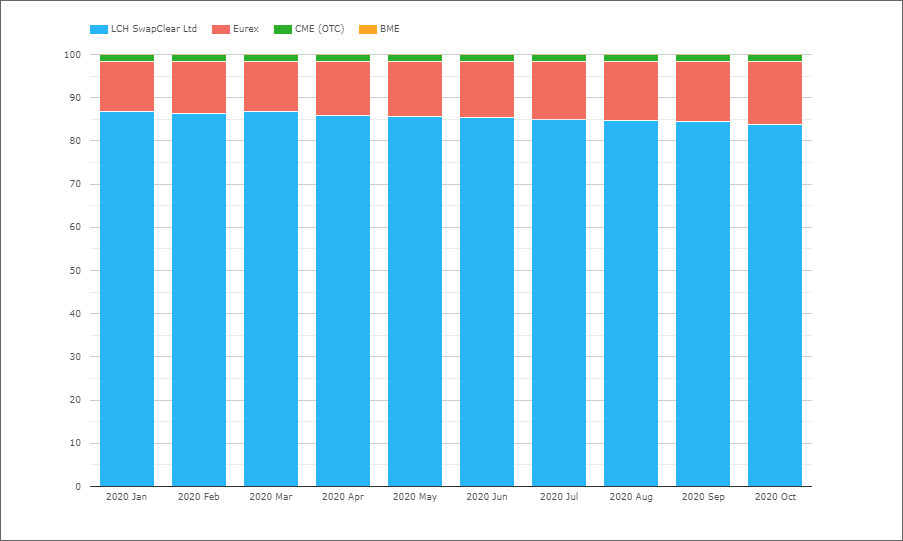
- Eurex up to 14.7% on 30-Oct, up from 14% on 30-Sep
It will be interesting to track volumes and market share changes through the remaining two months of the year and the first quarter of 2021.