The ISDA-Clarus RFR Adoption Indicator has been published for October 2020. The headlines are:
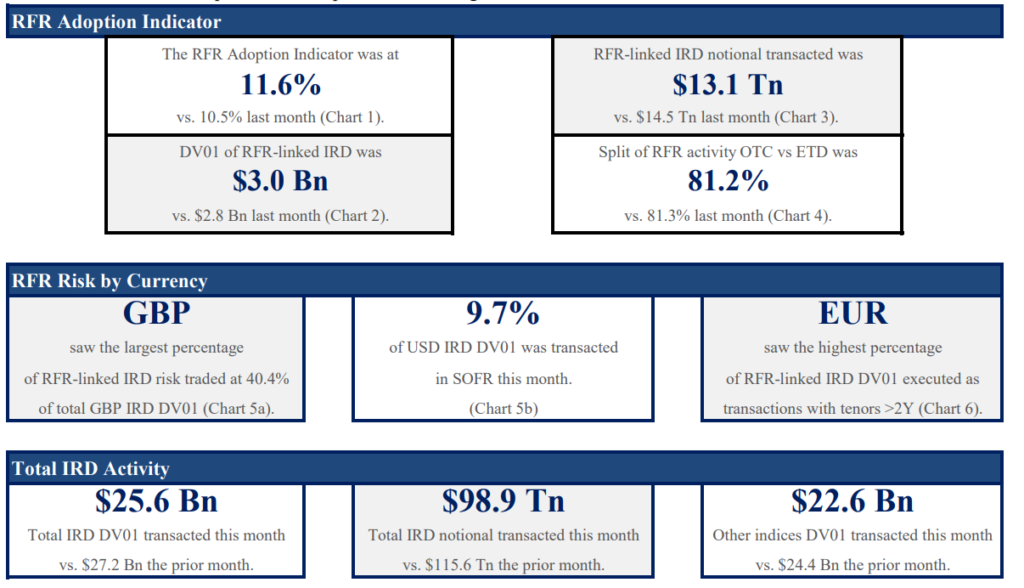
- The RFR Adoption Indicator hit 11.6%, a new all time high.
- This was up from 10.5% the prior month.
- 9.7% of all USD risk was traded in SOFR vs 5.8% last month, reflecting the increase in SOFR activity as a result of the CCP discounting change.
- The discounting switch at CCPs resulted in more long-dated SOFR risk trading than ever before.
- 62% of USD SOFR risk traded was in maturities longer than 2 years, reflecting the long-dated nature of discounting risk.
Please click here to access the full report.
Deep Dive into SOFR Risk
With the discounting switch still fresh in all of our minds (a big congrats to the CCPs for a smooth operation), I am sure everyone wants a synopsis of exactly what went on in SOFR markets.
However, we also have some important changes to the construction of the RFR Adoption Indicator that we need to communicate this month. I will put those up at the end of today’s blog, and please contact us with any specific questions.
Traded SOFR Risk
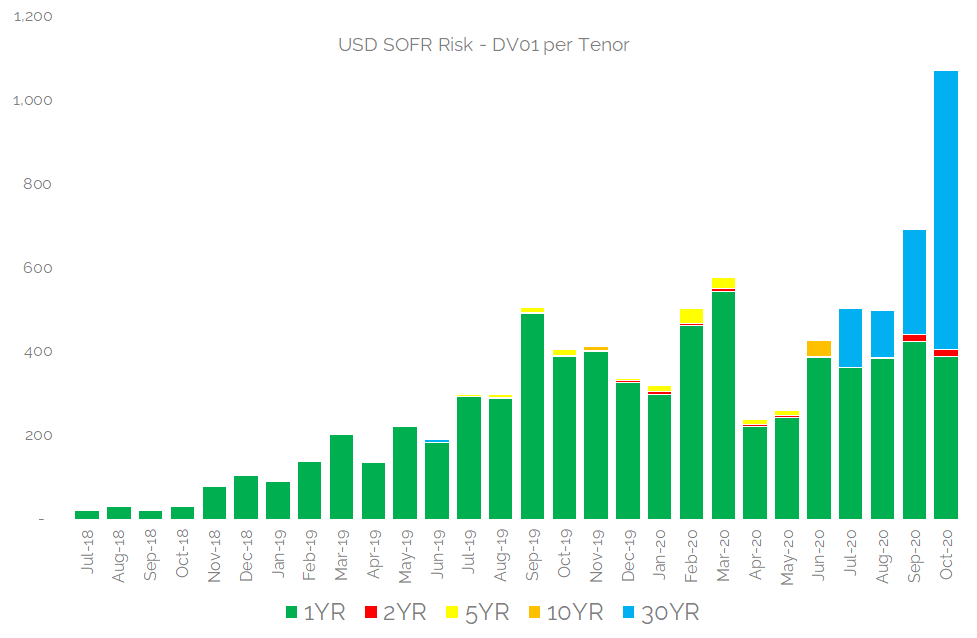
Our input data to the RFR Adoption Indicator reveals the precise DV01 traded per maturity in SOFR.
Showing;
- We estimate that $1.07bn DV01 traded in SOFR during October 2020.
- This was 55% larger than the prior month (September 2020 at ~$700m and 85% more risk than traded in SOFR during March 2020).
- The largest amount of risk was transacted in maturities longer than 10 years.
- The average maturity of SOFR trades reported to SDRs was 13 years when weighted by DV01. This results in a large exposure in the 30Y maturity bucket for our Indicator.
- It is the first time that 1YR has not been the largest risk tenor.
- This reflects the fact that October 2020 was the first month when more risk was transacted in OTC SOFR markets than in ETD (Futures) SOFR markets.
Judging by the sheer size of the amounts reported, we assume that the CCPs have included the auction swaps in their reported notional amounts for the month. This is contrary to SDR data, which will not see those auction swaps reported for around four weeks from execution due to a CFTC NARL.
Obviously, this is quite a milestone for SOFR to pass. SOFR accounted for nearly 10% of all USD Rates risk transacted, and surpassed $1bn in DV01 traded risk.
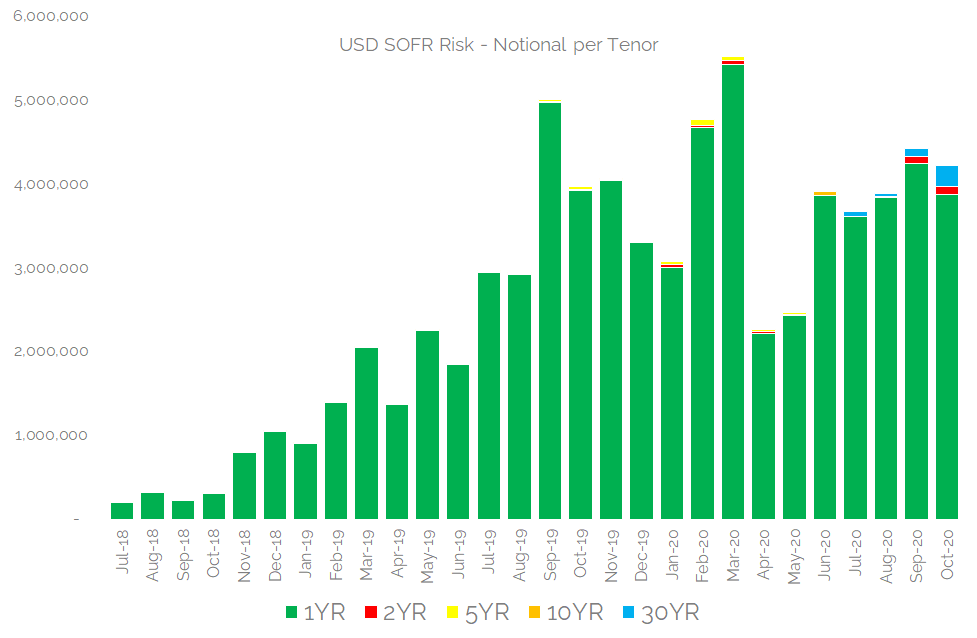
However, this is not reflected in notional amounts of SOFR traded. Due to the long-dated nature of the SOFR discounting risk, no SOFR notional records were set last month:
SONIA Remains The Largest RFR Market
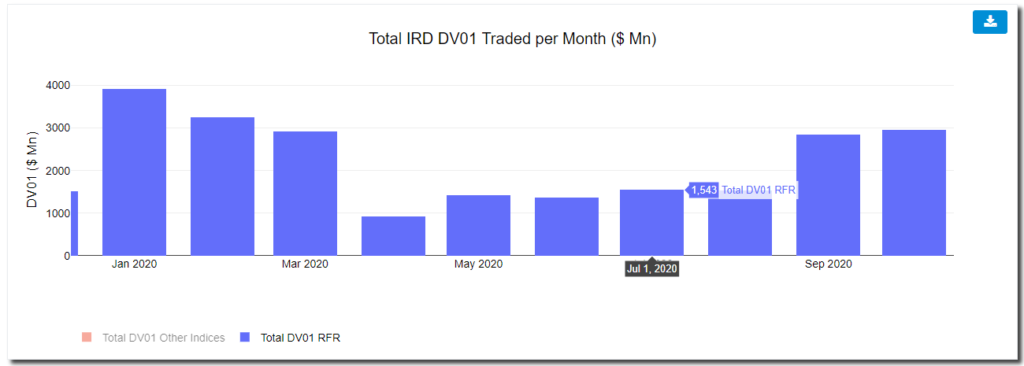
However, whilst USD SOFR had a great month, it lost out to GBP SONIA for the title of largest RFR market:
Showing;
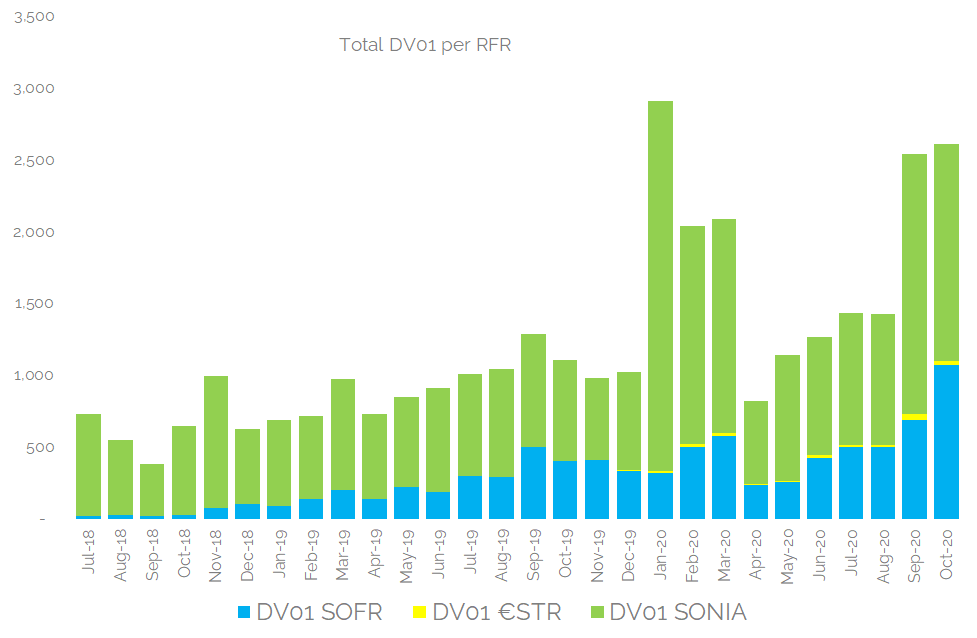
- Total DV01 traded in each of the EUR, USD and GBP RFRs (in USD equivalents).
- SONIA remains the largest RFR market, thanks to a huge 40%+ of all GBP risk being in SONIA this month.
- With the market standard moving to SONIA in late October for interbank markets, November could see even more SONIA risk traded.
- The total amount of €STR risk dropped last month, to just €32m DV01. It remains a tiny market, even after the EUR discounting switch.
- Even with the stellar showing from SOFR, January 2020 remains the record month for the total amount of RFR risk traded:
Long-Dated RFR Risk
The discounting switch at the CCPs has caused SOFR to now be the largest long-dated RFR market. More risk traded in 2Y+ maturities in SOFR last month than in any previous month for any other currency:
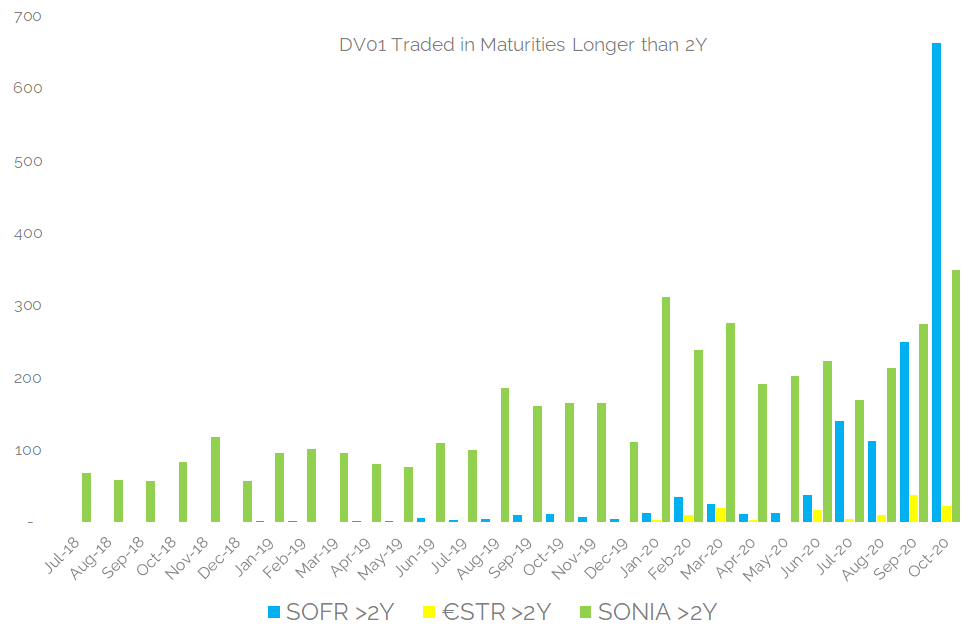
Long-dated SOFR really smashed some records there!
November SDR Data
The RFR Adoption Indicator has been on somewhat of a tear since the April nadir:
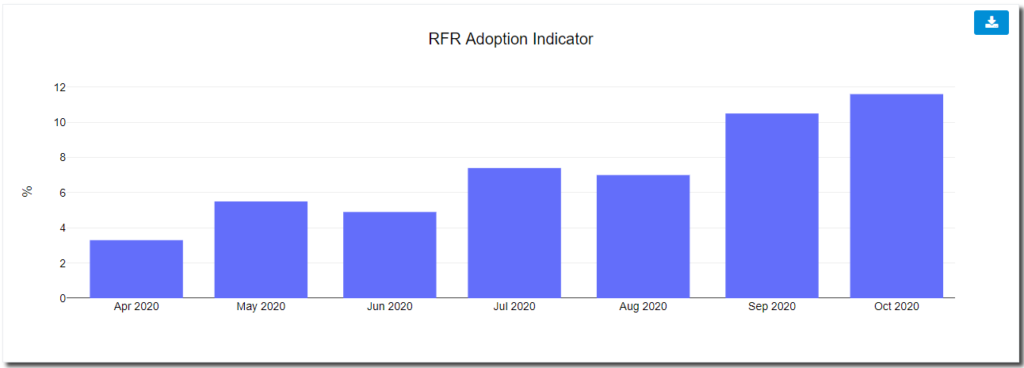
It is interesting to note what is happening already in November in terms of traded SOFR risk. The main insight we have is from SDR data in real-time.
- October 1st-8th saw ~$100m DV01 reported to US SDRs with a SOFR leg.
- November 1st – 10th saw just ~$21m DV01 reported to US SDRs.
- Both periods cover 7 trading days.
- It is not an exact like-for-like comparison, but it does look like total SOFR risk is likely to be significantly lower this month than last.
- The big question is how much smaller. The volatility around election results/vaccine announcements this month could well drive some needs to re-balance discounting risk.
RFR Adoption Indicator Changes
Finally, please note that we have updated the whitepaper this month to keep pace with the changes made to the Indicator construction. We have done three things this month:
- Added ASX data. This now covers AUD OTC derivatives contracts, split into our maturity buckets, for the entire life of the Indicator since 2018.
- Recalculated the average maturity of the “2Y+” maturity buckets for SOFR and €STR risk using DV01 weights rather than notional weights. This more accurately reflects the long-dated nature of the recent activity. These have been recalculated for the entire history of the indicator.
- Added CME ERIS SOFR futures. They have a great suite of market data available here.
Remember, if you need access to the granularity of data presented in this blog, please contact us for a CCPView subscription.