Time to update and revisit one of our most interesting 2023 blogs – Swaptions:

Swaptions showcase a different use case for SDR data, and highlight why data augmentation is necessary.
Straddles Are Back!
My previous look at 2023 trade counts highlighted:
- 93,000+ swaptions were reported in 2023, some ~40,000 (+~75%) more swaptions than in previous years.
- This was because Straddles were now being reported as two trades, with each leg reported and marked-up in the DTCC data as a “package”. The option type “D-“, denoting a Straddle, is no longer reported.
As soon as we noticed this, we set our sights on identifying Straddles again in the data. This functionality is now live in SDRView Researcher for all of our users:


Showing;
- USD Swaption trade counts.
- The “Package” flag has been published by DTCC (and all other SDRs) since December 2022 (see Amir’s blog here)
- Since April 2024:
- We look for combinations of Receiver and Payer swaptions with the same expiry, same underlying and same strike, with the same/very close timestamps.
- We flag these as “Straddles” to replicate the pre-2023 behaviour of Straddles, that were previously reported with option type “D-” in the DTCC data (no Swaption trades are reported with type “D-” anymore).
Armed with this new identification, once Q2 2024 comes to a close, I can start creating Heatmaps for Straddles again. Back-filling the data for 2022 will depend on user demand – so let us know!


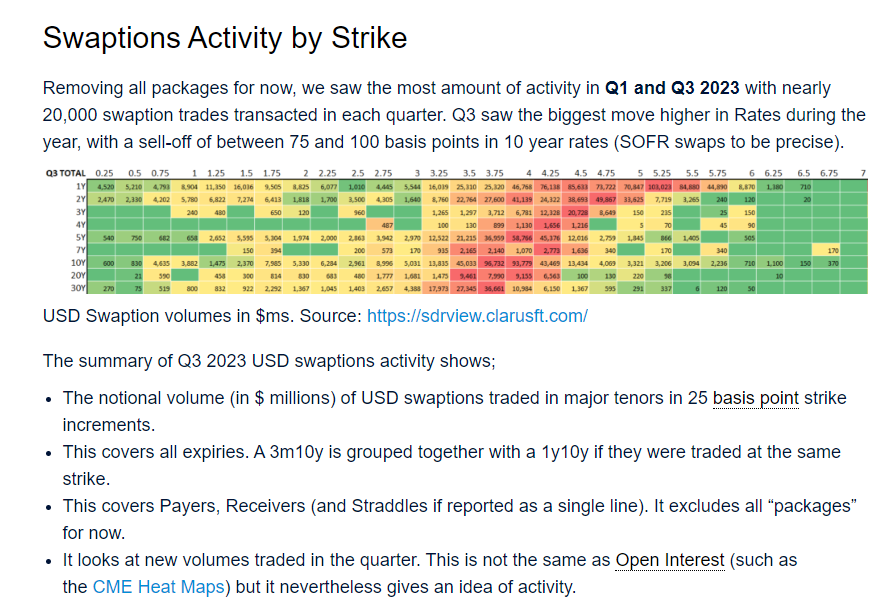
Swaptions Activity by Strike
This brings me to the Heatmaps of Swaption activity by Strike – the core part of these blogs.
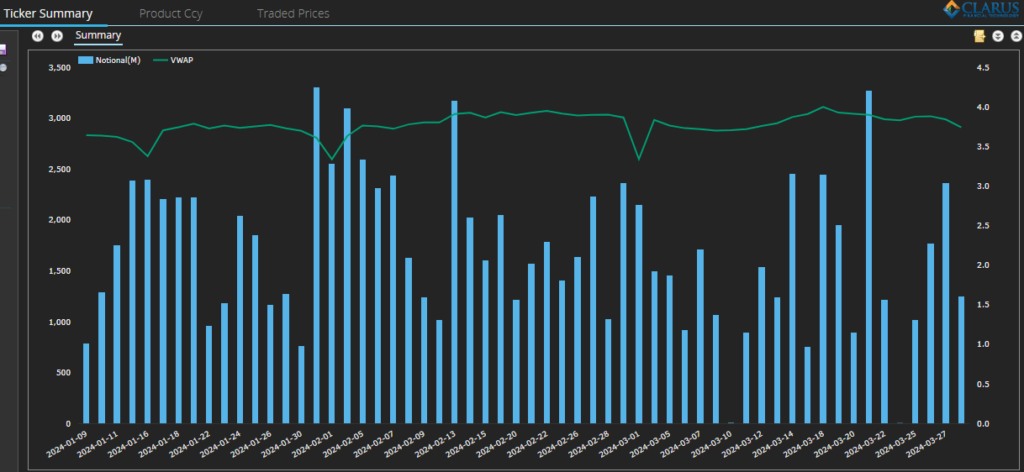
Recall that Q1 and Q3 2023 saw nearly 20,000 swaption trades transacted in each quarter. Q1 2024 saw these volumes tail-off (continuing a trend started in Q4 last year), with 14,500 swaptions reported ( (excluding packages). Rates were more stable in Q1, with a daily VWAP range of about 45 basis points, compared with 75-100 basis points for previous quarters (on 10Y SOFR swaps):

SDR data for all USD Swaptions reported in Q1 2024 (that are not tagged as a “package”) can be used to create the following heatmap of Swaption activity:


The summary of Q1 2024 USD swaptions activity shows;
- The notional volume (in $ millions) of USD swaptions traded in major tenors in 25 basis point strike increments.
- This covers all expiries. A 3m10y is grouped together with a 1y10y if they were traded at the same strike.
- This covers Payers & Receivers. It excludes all “packages” for now.
- It looks at new volumes traded in the quarter. This is not the same as Open Interest (such as the CME Heat Maps) but it nevertheless gives an idea of activity.
- Red areas show the “hottest” strikes and tenors, those with the most notional volume traded.
- We saw strikes all the way up to 6.75% trade in the quarter (for 7Y underlyings), however activity notably drops off at ~5.25% strikes for most of the underlyings.
- The highest strike with more than $1bn traded in a particular tenor was also the highest strike traded. Specifically, there was $1.4bn of activity at the 6.75% strike versus 7Y (the underlyings are also referred to as “tails” FYI).
- The red areas largely reflect where the at-the-money rates were as vol trading is naturally concentrated around these areas. The red areas nicely highlight the inversion of the curve as they occur at lower strikes further out the curve.
- The most active tenor was 1Y, with a huge $583bn traded across all strikes in Q3 2023.
- There is then quite a gap to activity in 10Y underlyings, with $297bn traded. This is consistent with our previous analyses where 1Y and 10Y tenors tend to see the largest notional amounts trading.
- Note how diverse the activity is in 1Y strikes – from 0.25% to 6.5%. The 3.75% and 4.00% strikes in 10Y both saw large amounts of notional activity – more so than for most strikes in 1Y apart from 4.75% and 5%.
Receivers Activity
Now looking at activity only in Receivers:
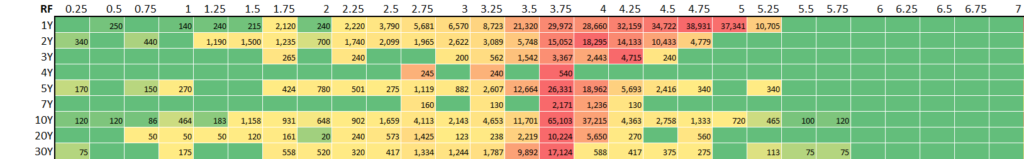
- Total activity in Receivers accounted for 47% of overall Swaption activity (measured by notional) – a touch higher than the 42% we saw last time.
- The most active underlying was 1Y, which again saw a range of strikes traded. $10bn or more traded in strikes from 3.5% all the way up to 5.25%.
- Activity in 20Y underlyings continues to be skewed toward Receivers – why? Of all activity versus a 20Y tail, 59% was in receivers. This has been the case in each of the three previous blogs, suggesting some type of structural imbalance. Anyone care to comment? 20Y strikes as low as 2.75% saw over $1.4bn notional equivalent trade.
Payers
And for Payers only;
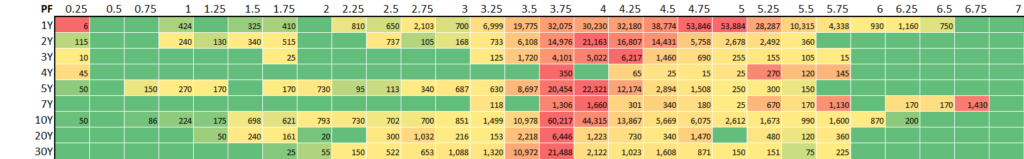
- Payers accounted for 53% of total Swaptions activity as measured by notional.
- The most active underlying and strike was 10Y 3.75%. Combining with 4% strikes saw over $100bn trade, as did 1Y tails covering strikes of 4.75% and 5%.
- 7Y underlyings were the “go to” maturity when compared to Receivers. Two thirds of activity versus 7Y tails was a Payer, one of the largest imbalances I have seen whilst writing these blogs.
In Summary
- Non-linear volumes are one of the most interesting corners of SDR data.
- SDRView now identifies Straddles in Swaptions data, further improving transparency.
- Heatmaps of option activity show the most active underlyings (tails) and strikes across Payers and Receivers.
- There has been a demand imbalance for Receivers versus 20Y tails for at least 2 years, suggesting this is a structural facet of the market.
- Payers saw relatively more activity in 7Y tails, which tend to be far less liquid than the neighbouring 5Y and 10Y underlyings.