- Swaptions activity has reacted to the huge sell off we have seen in Fixed Income markets during Q1 2022.
- There are no volume records being broken in Swaptions but we update one of our popular blogs from 2021 with fresh data.
- We take a look at Swaption strikes traded throughout the quarter.
- And we break-down the analysis into Receivers, Payers and Straddles.
Markets Backdrop
You may have heard, but Q1 was not a great quarter for Fixed Income returns (if you were long!).
As shown by 10Y SOFR swaps in the US, the sell-off was pretty brutal, with the only reprieve coming from event risk around Russia/Ukraine. Even that didn’t last long….
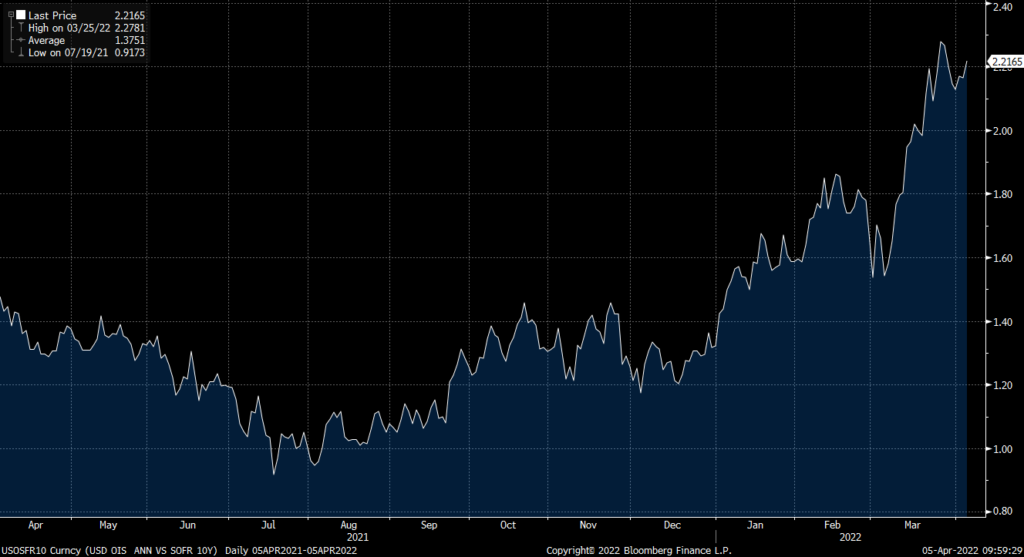
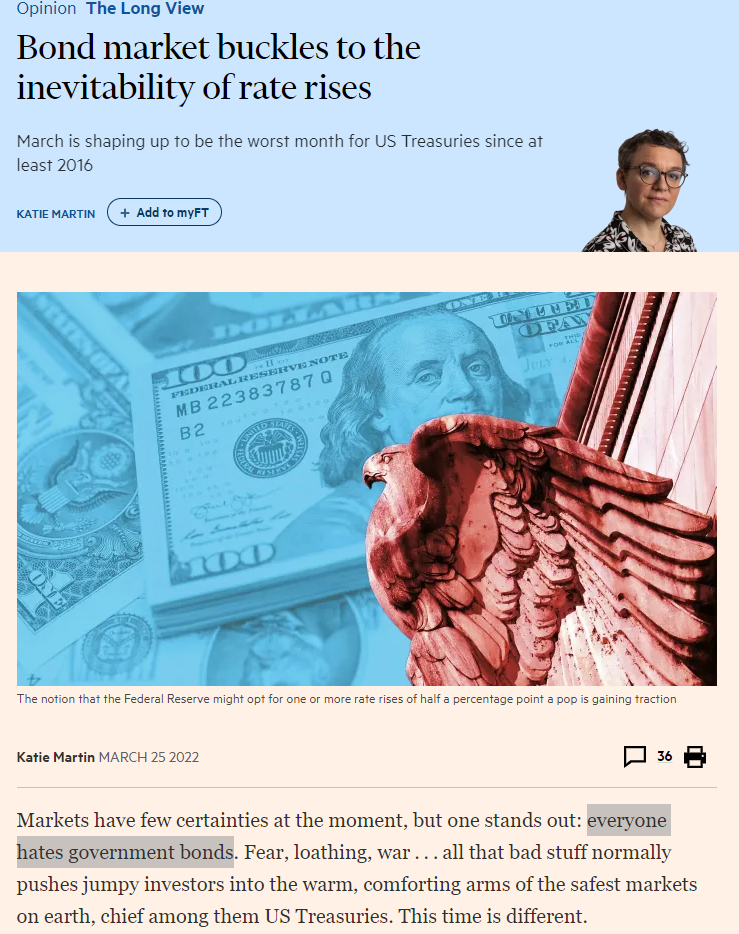
The FT put it well – “everyone hates government bonds”:
This huge sell-off, of nearly 100bp in SOFR swaps, rivals the one we saw in Q1 2021, albeit we have started from higher levels this time around:
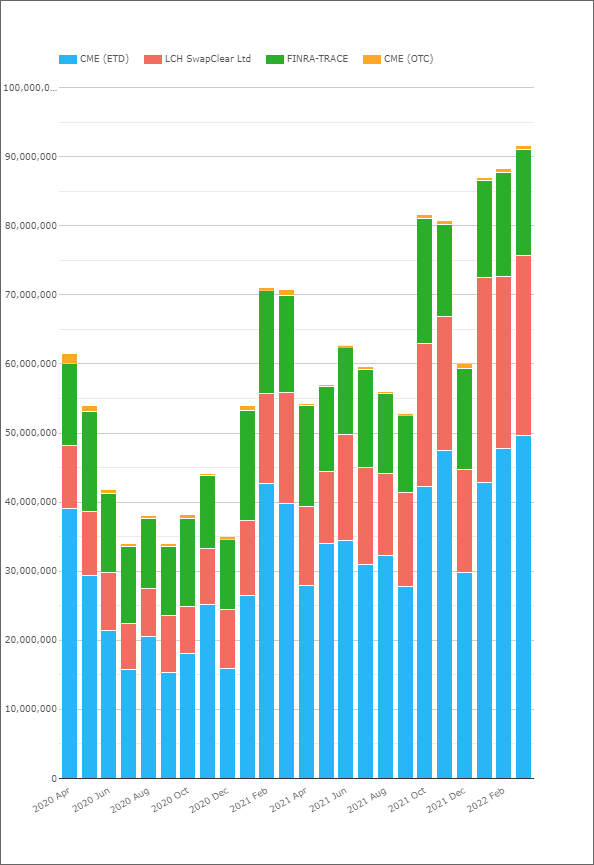
It has led to some remarkable volumes in USD Rates markets. In CCPView, we see close to all-time record volumes across USD Rates products (Bonds, Futures and Swaps). For example, our first chart shows USD long-end volumes (excluding FRAs and STIR futures):
And our second chart looks at products including these short-end volumes:
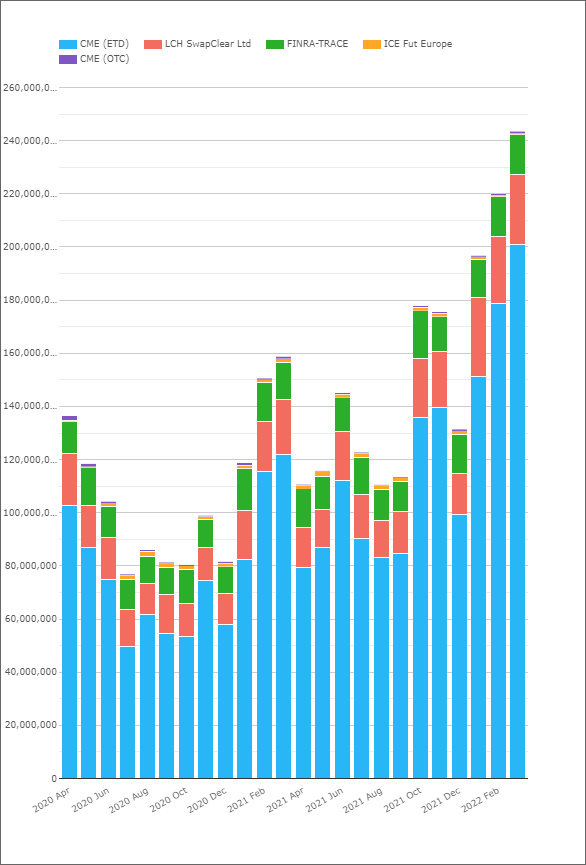
These are not quite all time records for the USD market. March 2020 saw higher volumes, as did June 2019 (even without US Treasury transparency data). But they are impressively large volumes compared to recent levels of activity.
Naturally I therefore expected to see some records in Swaptions as well…
Options Traders Shrugged and went ‘Meh’
I was therefore surprised when I checked in SDRView to update one of our popular blogs from last year – Swaptions activity.
Looking at USD Swaptions activity by trade count:
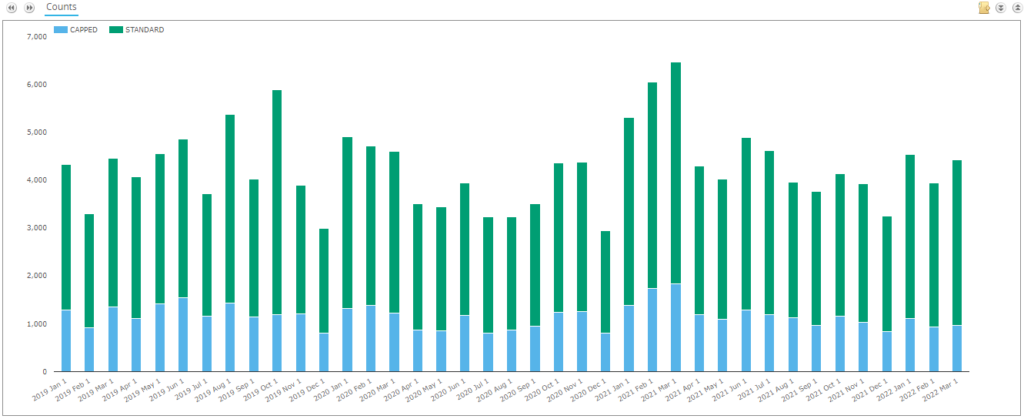
Showing;
- There isn’t too much to say about this chart. Swaptions volumes have been pretty “average” in Q1 2022.
- Where has all the excitement been? Why isn’t a huge sell-off fueling convexity hedging and large amounts of swaptions activity as a result this time around?
- Activity has been fairly decent – the best volumes since June and July last year. But nothing like the spike in activity we saw this time last year (Q1 2021).
- Activity in notional terms looks a little more robust, but not really headline worthy:
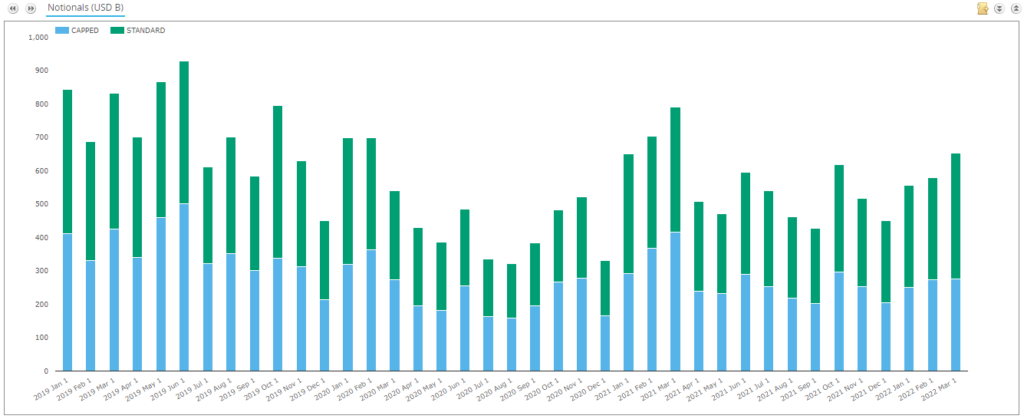
Much as we noted in March 2020, Swaptions markets really don’t scale-up in line with underlying activity in Rates markets. It is a puzzle, but this is not the first time we have seen this.
Swaptions Activity by Strike
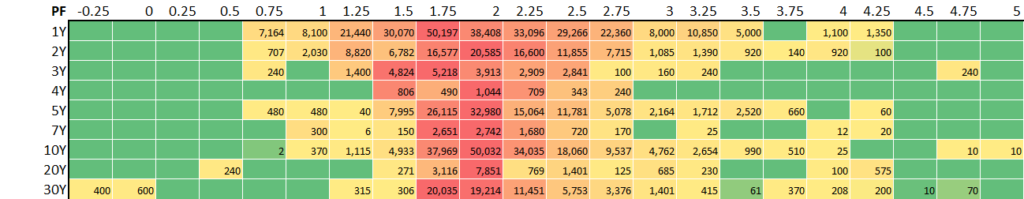
Does an analysis by Strike reveal anything to our readers? Here is a summary of Q1 2022 USD Swaptions activity:
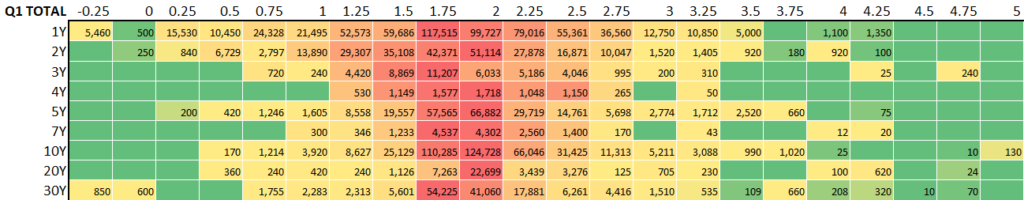
Showing;
- The notional volume (in $ millions) of USD swaptions traded in major tenors in 25 basis point strike increments.
- This covers all expiries. A 3m10y is grouped together with a 1y10y if they were traded at the same strike.
- This covers Payers, Receivers, Straddles.
- It looks at new volumes traded in the quarter. This is not the same as Open Interest (such as the CME Heat Maps) but it nevertheless gives an idea of activity.
- Red areas show the “hottest” strikes and tenors, those with the most notional volume traded.
- We saw strikes all the way up to 6.25% trade in the quarter (for 15Y underlyings), however activity notably drops off at ~4% strikes and higher.
- The highest strike with more than $1bn traded in a particular tenor was 3.75%, which saw $1bn traded versus 10Y (the underlyings are also referred to as “tails” FYI).
- The red areas largely reflect where the at-the-money rates were as vol trading is naturally concentrated around these areas.
- The most active tenor was 1Y, with $609bn traded across all strikes in Q1 2022.
- There is then quite a gap to activity in 10Y underlyings, with $393bn traded.
- Note how diverse the activity is in 1Y strikes. The 2% and 1.75% strikes in 10Y both had more notional activity than almost any strike for 1Y tails. Notable not just because 10Y notional carries 9.1x as much risk with it, but because there were large amounts of notional traded across a huge range of strikes for 1Y tails.
Receivers Activity
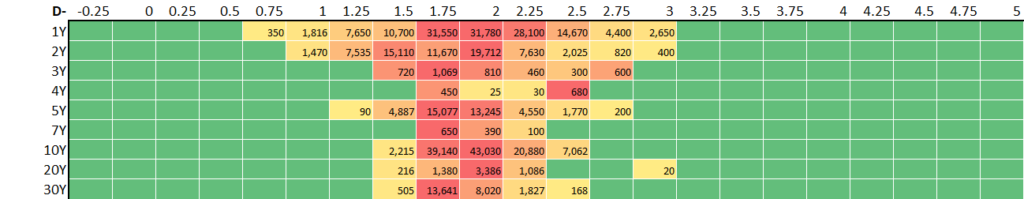
As we noted in our previous Swaptions blog, we can also split the activity by Receivers/Payers/Straddles. Looking only at the activity in Receivers:
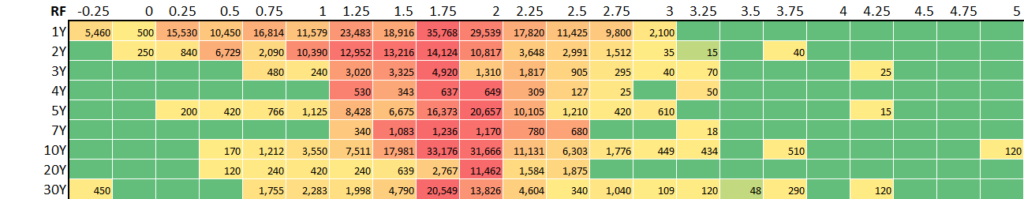
Showing;
- Total activity in Receivers accounted for 33% of overall Swaption activity (measured by notional).
- Most of the activity that we saw during the quarter at low strikes (less than 1.5%) was in Receivers. For example, over $1bn traded in 1.5% 7Y Receivers versus a total of $1.2bn across Receivers, Payers and Straddles at the same strike and underlying.
- The most active underlying was 10y. 1Y tails saw a huge variety of strikes traded, with $10bn or more traded from 0.25% strikes all the way up to 2.75%.
- It is notable that receivers in 20Y underlyings accounted for 47% of total Swaptions activity versus 20Y tails, a much higher proportion than any other maturity. These were very much centred around 2% strikes.
Payers Activity
Are there any differences in trading patterns for Payers activity?
Showing;
- Payers accounted for 44% of total Swaptions activity as measured by notional.
- Payers dominate activity from strikes 2.25% and higher.
- The most active underlying and strike was 1Y 1.75%. This was very closely followed by 10Y 2%, where over 10% of total payers activity traded. For reference, the most active underlying and strike for Receivers was also 1Y 1.75%.
Straddles
Finally, we come onto Swaption Straddles. A strategy I always considered a “pure” volatility play, but happy to be proven wrong!
- Due to the product, the range of strikes is naturally more compressed for Straddles. A Straddle is a combination of a Receiver Swaption and a Payer Swaption with the same expiry, same underlying and same strike. Therefore, if Rates do not really move, both Payer and Receiver positions will expire worthless, and the premium paid (or received) will constitute a loss (or gain).
- Straddles accounted for “only” 23% of total swaption notional traded. Checking back versus our previous Swaptions analysis in 2021, this is consistent with that 2021 data as well.
- We see the most traded Straddles were 10Y 2.0%, closely followed by 10Y 1.75% – consistent with the activity we saw for Payers and Receivers.
- Activity in the 1Y underlyings was highly concentrated around the at-the-money rates (as they moved higher through the quarter), with most activity ranging from 1.75 to 2.25%.
In Summary
- Q1 2022 saw close to all time volume records across USD Rates products.
- However, Swaptions volumes did not scale up in the same way.
- Whilst activity was healthy in Swaptions, no volume records were close to being broken.
- We look at activity throughout the quarter.
- And we break-down the trading between Receivers, Payers and Straddles.