Sometimes this blog would benefit from another Chris Barnes or Amir Khwaja! It has taken me until the tail-end of 2023 to revisit one of the most popular topics on the Clarus blog – Swaptions:
I do not know which of the ~85 blogs I should not have written since I last wrote about Swaptions, but I wish that I had dropped at least one of them!
A Warning About the Data
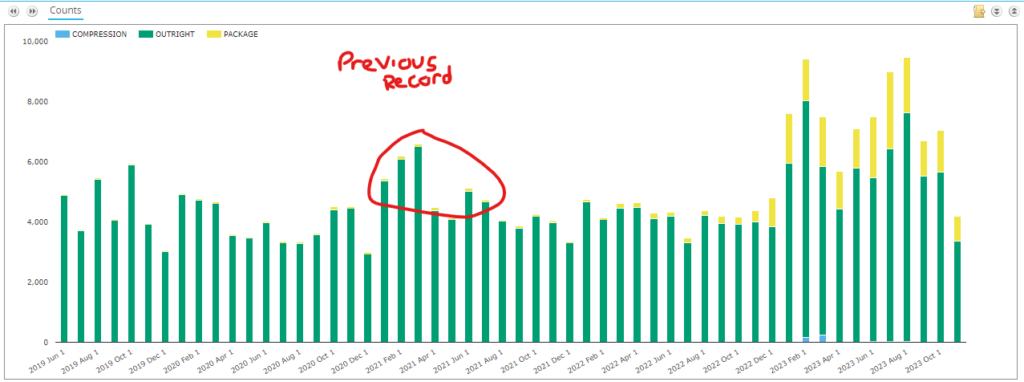
The data suggests that we should be getting very excited about Swaptions traded in 2023. By trade count:
Showing;
- The number of USD Swaptions traded each month since 2019.
- In our 2021 look at USD Swaptions, we established that Q1 2021 was the previous most active period on record, with March 2021 seeing 6,346 USD swaptions trades reported.
- In 2023:
- 9,465 swaptions traded in August – 50% more than the previous monthly record that we wrote about!
- 81,000+ swaptions have so far been reported, at least 25,000 more swaptions than have ever been reported in a single year.
BUT – and this a big but (stop laughing at the back there) – the data now includes yellow bars in the trade counts. Those are “packages” that have not been previously flagged in SDR data – see our blog here on Packages and Trading Venues for the data changes.
Swaptions data now carries a health warning: Straddles are no longer reported as a single line in the SDR data with Option Type “D-“, but are reported as two separate Payer and Receiver legs. This obviously increases the trade count reported to SDRs.
Straddles
Repeating the analysis from our previous blog in 2022, the first question (aside from seeing more trades) arises from the Straddle data. Look at the below and tell me if you see anything weird!
- Previously, straddles have accounted for 20-25% of total swaption activity. Recall that a Straddle is a combination of a Receiver Swaption and a Payer Swaption with the same expiry, same underlying and same strike. Therefore, if Rates do not really move, both Payer and Receiver positions will expire worthless, and the premium paid (or received) will constitute a loss (or gain).
- However, the last time we looked at the data, trades did not include the new “Package” flag in the public SDR data. And so Straddles were marked with a “D-” and reported as a single trade in SDR data.
- As a result, current SDR data suggests that only 4% of activity is tied to Straddles – which is very unlikely.
- A change is therefore required for the analysis. Straddles must now be identified as two legs with the “Package” flag or as “D-” in the OptionType field. Identifying same strike payer & receiver swaptions that are traded concurrently will be a bit of work for us to develop into SDRView.
Swaptions Activity by Strike
Removing all packages for now, we saw the most amount of activity in Q1 and Q3 2023 with nearly 20,000 swaption trades transacted in each quarter. Q3 saw the biggest move higher in Rates during the year, with a sell-off of between 75 and 100 basis points in 10 year rates (SOFR swaps to be precise).
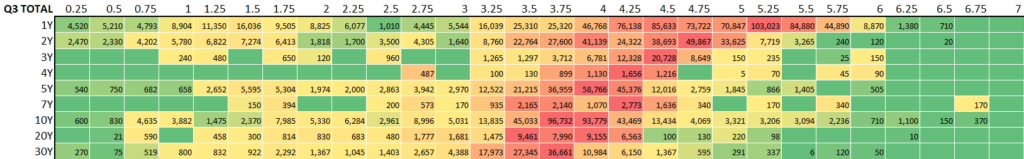
The summary of Q3 2023 USD swaptions activity shows;
- The notional volume (in $ millions) of USD swaptions traded in major tenors in 25 basis point strike increments.
- This covers all expiries. A 3m10y is grouped together with a 1y10y if they were traded at the same strike.
- This covers Payers, Receivers (and Straddles if reported as a single line). It excludes all “packages” for now.
- It looks at new volumes traded in the quarter. This is not the same as Open Interest (such as the CME Heat Maps) but it nevertheless gives an idea of activity.
- Red areas show the “hottest” strikes and tenors, those with the most notional volume traded.
- We saw strikes all the way up to 6.75% trade in the quarter (for 7Y and 10Y underlyings), however activity notably drops off at ~6% strikes for 1Y and 2Y underlyings, and at 5.25% for everything else.
- The highest strike with more than $1bn traded in a particular tenor was 6.25%, which saw over $1.25bn traded versus 1Y and 10Y (the underlyings are also referred to as “tails” FYI).
- The red areas largely reflect where the at-the-money rates were as vol trading is naturally concentrated around these areas. The red areas nicely highlight the inversion of the curve as they occur at lower strikes further out the curve.
- The most active tenor was 1Y, with a huge $745bn traded across all strikes in Q3 2023.
- There is then quite a gap to activity in 10Y underlyings, with $374bn traded. This is consistent with our previous analysis where 1Y and 10Y tenors always see the largest notional amounts trading.
- Note how diverse the activity is in 1Y strikes – from 0.25% to 6.5%. The 3.75% and 4.00% strikes in 10Y both saw large amount of notional activity – more so than for any strike in 1Y apart from 5.25%. Notable not just because 10Y notional carries 9.1x as much risk with it, but because there were large amounts of notional traded across a huge range of strikes for 1Y tails.
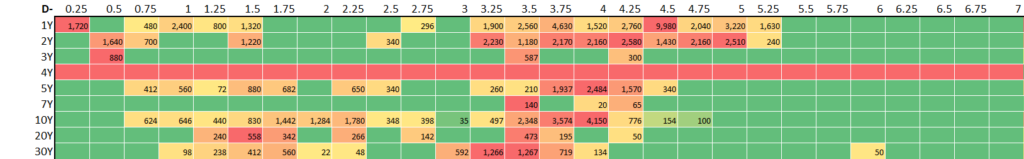
Receivers Activity
Now looking at activity only in Receivers:
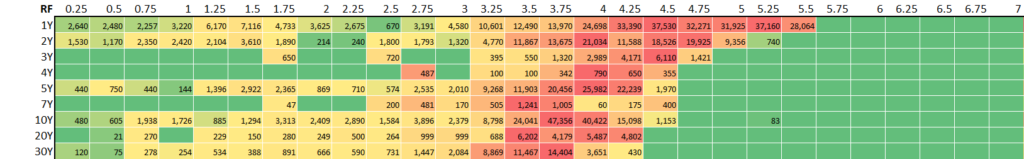
- Total activity in Receivers accounted for 42% of overall Swaption activity (measured by notional) – much higher than the 33% we saw last time, but potentially skewed by the omission of Straddles in the effective trade count.
- The most active underlying was 1Y, with a large range of strikes traded, with $10bn or more traded from 3.25% strikes all the way up to 5.5%.
- Receivers in 20Y underlyings were again relatively more active – just as we noted in the previous blog. They accounted for 59% of total Swaptions activity versus 20Y tails, a much higher proportion than any other maturity (all other maturities saw 32-48% of activity in Receivers). Strikes in 20Y mainly varied from 3.5% to 4.25%.
Payers
And for Payers only;
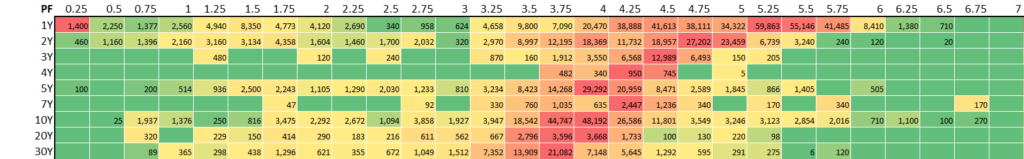
- Payers accounted for 52% of total Swaptions activity as measured by notional.
- The most active underlying and strike was 1Y 5.25%. This was nearly 25% higher in notional terms than the next most active strike outside of 1Y tails (10Y 4%).
- It continues to surprise me how relatively inactive both 4Y and 7Y underlyings are compared to 3Y, 5Y and 10Y. A good lesson in liquidity there.
In Summary
- 2023 is a record year by trade count for Swaptions reported to US SDRs, but largely as a function of Straddles now being reported as two trades.
- When changes like this happen to SDR data, it should really carry a health warning – hopefully our readers appreciate us belaboring the point in today’s blog!
- Despite the data changes, it is still clear that the huge sell-off in Rates has driven elevated levels of activity in Swaption markets.
- Non-linear volumes are notoriously tricky to interpret, and so users of SDR Swaption data must look at both trade counts and notional amounts. We know that some of our users even calculate underlying deltas.