- Well done Tradeweb for making APA and MTF data available to Clarus for analysis.
- Our APA analysis casts transparency over the off-venue market for the first time.
- 7,000 IRS trades, over €800bn in notional and €400m in DV01 to look at.
- We take this data to estimate the uptake of the European Trading Obligation in the D2C market.
Bravo Tradeweb. With Added Clarus.
Tradeweb were kind enough to provide us with both their APA and MTF data for the week 9th – 16th January 2018. This is our first opportunity to look at MIFID II data outside of the usable Bloomberg data.
The Tradeweb APA provides a healthy chunk of data regarding Interest Rate Swaps traded off-venue.
Well done Tradeweb.
Both for giving us this data (thank you!) but also for making the pipes work such that 7,000 previously completely invisible swaps can now be brought to the public’s attention. Finally, some transparency for European Rates markets.
It’s now up to us to make sense of the data. Clarus will now cleanse, augment and analyse this data to make it usable. We do this for a lot of data.
Here’s what we found in Week One.
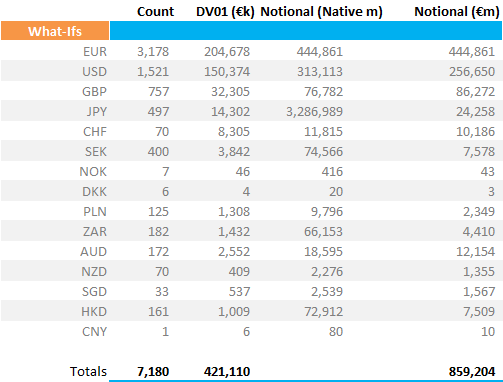
Weekly Aggregated Statistics
The APA reported the following Interest Rate Derivatives (excluding option products):
Showing;
- For the six trading days from 9th – 16th January, over 7,000 Interest Rate Derivative trades were reported.
- Trades in 15 different currencies were seen.
- They totalled €859bn in notional.
- The approximate amount of risk was €421m DV01 (remember that thanks to the ISIN debacle we don’t know enough details about the trades to calculate an accurate DV01…or price…or even start date….).
It is useful to “anchor” this versus another source of data. So let’s look at SDR data in the US from Bloomberg and DTCC. How much trading did the SDRs see?
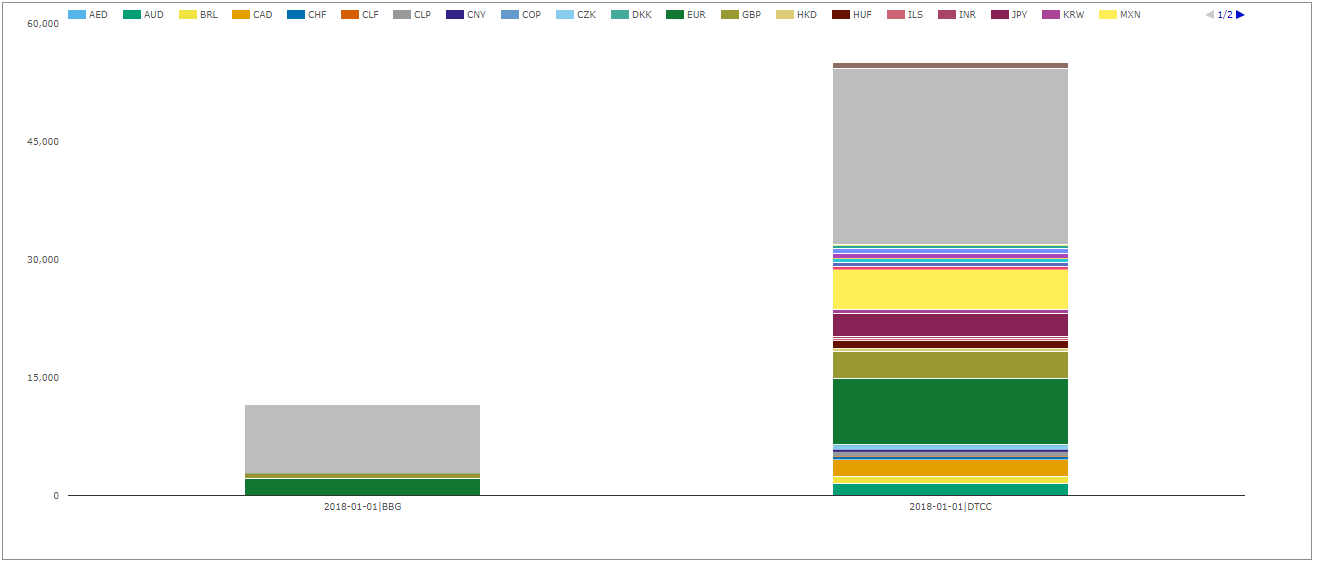
Showing;
- For the US market, over 66,000 fixed-float interest rate swaps were reported in the same week.
- 32 different currencies traded (although only 9 on Bloomberg).
- $5trn reported to the DTCC SDR. But “only” $807bn on the Bloomberg SDR. So Tradeweb, in a more competitive European reporting space, saw a higher notional reported to its’ APA than Bloomberg did to its’ SDR.
- $1.9bn DV01 (based on accurate calculations because we know the precise economic terms of a swap…) reported to the DTCC SDR. But again, Bloomberg’s SDR saw a lower amount of risk reported – at $438m.
- The Tradeweb APA data looks to be broadly comparable to the Bloomberg SDR in size.
I’m pretty certain this APA data excludes Tradeweb MTF trades. It is therefore almost exclusively off-venue trades (it may include trades executed on other venues- does anyone know if other venues report to TW?). The Bloomberg SDR only sees trades reported by the Bloomberg SEF.
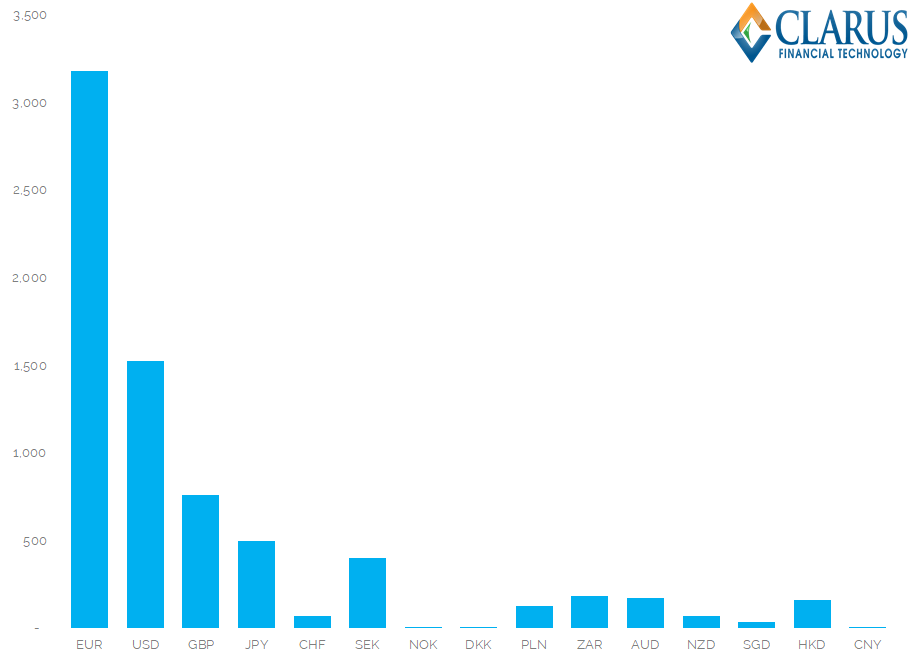
EUR IRS Dominates Trading
The APA sees just under half of all IRS in EUR. For comparison, the TW MTF saw 73% of all IRS traded in EUR.
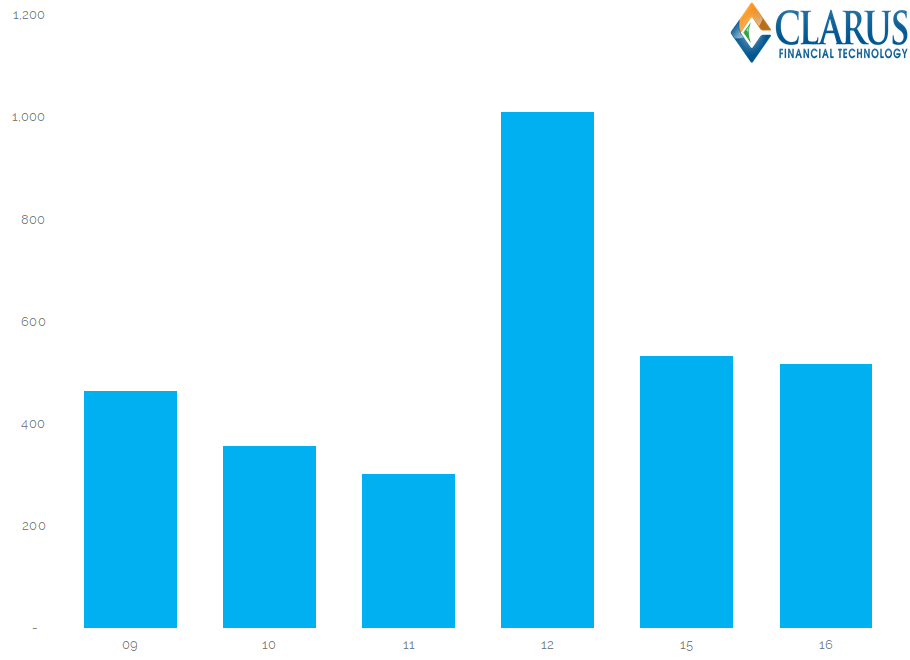
Most trades were transacted on 11th & 12th January…
Looking at Transaction Date:
But most trades were reported on 12th January….
…which was a Friday, once again showing that Tuesdays are not necessarily the peak day for publication that we expect.
For IRS reported to the TW APA, we saw the following publication delays:
- 66% published same day*
- 22% published with a one-day lag
- 5% published with a 2-day lag
- 5% published with a 3-day lag
- The remaining 2% of trades (by trade count) took longer to be published….
*Update 02/02/2018 – Having queried this with our data source, this is not an accurate report card for when the trades were made public. The absence of the deferral flags in the data set makes it hard to tell for sure. The execution dates are certainly accurate however.
EUR IRS Notional Amounts are dominated by short-end trading
No surprises there:
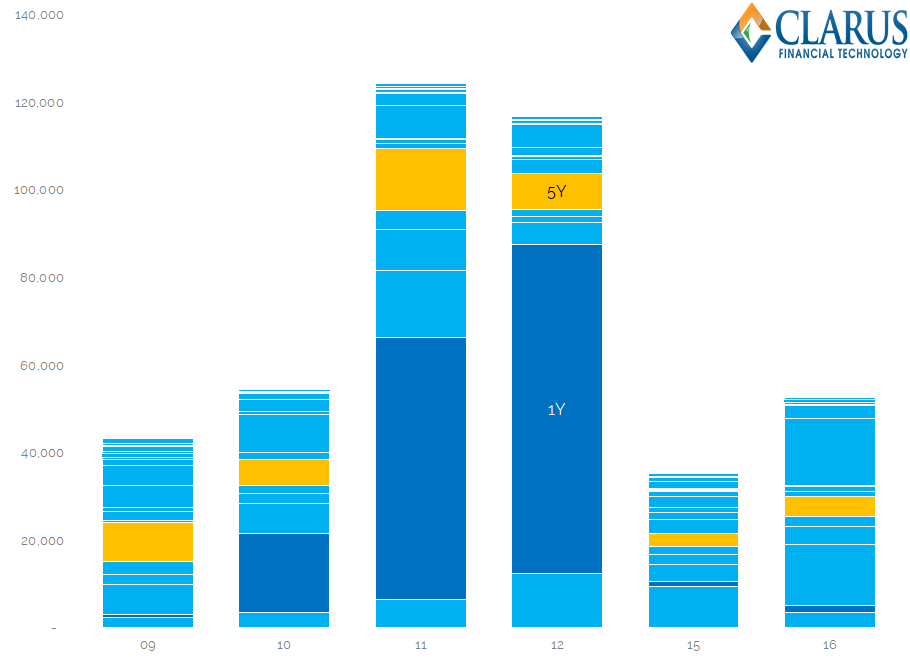
Good job that Clarus have a nifty microservice to easily convert into DV01s, a maturity-agnostic measure of risk.
EUR IRS trading happens mainly in 5y, 9y and 10y….
The dominance of 5y and 10y tenors is similar to what we see in the US. However, there is far less long-end trading (surprising?), and instead 9y (the maturity of the EUREX Bund contract) is the second most traded tenor.
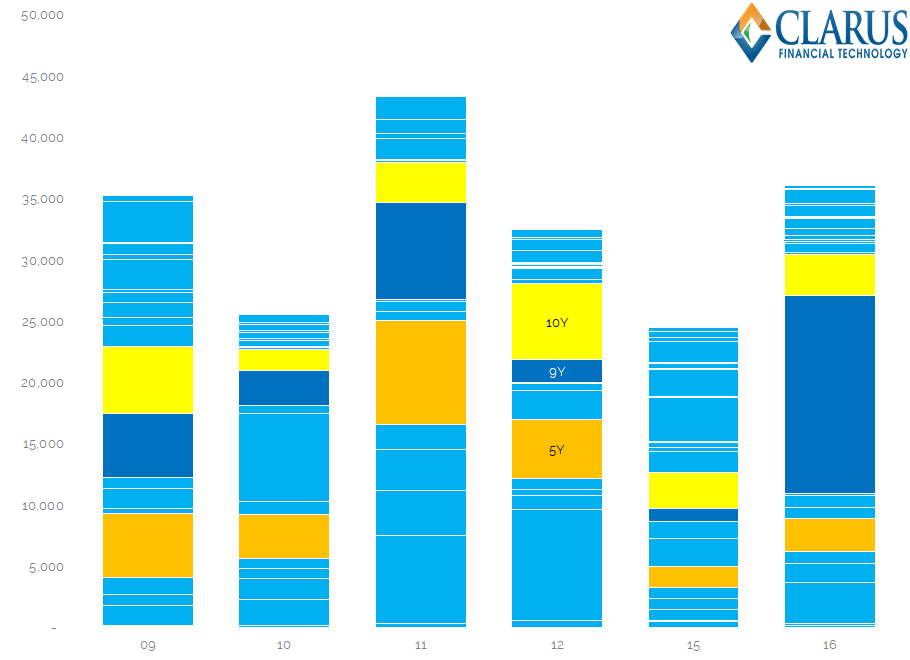
Good job we know all about invoice spreads in Europe….from SDR data!
The European Trading Obligation has seen limited success so far….
Here are the volumes traded per tenor on the TW MTF and the TW APA:
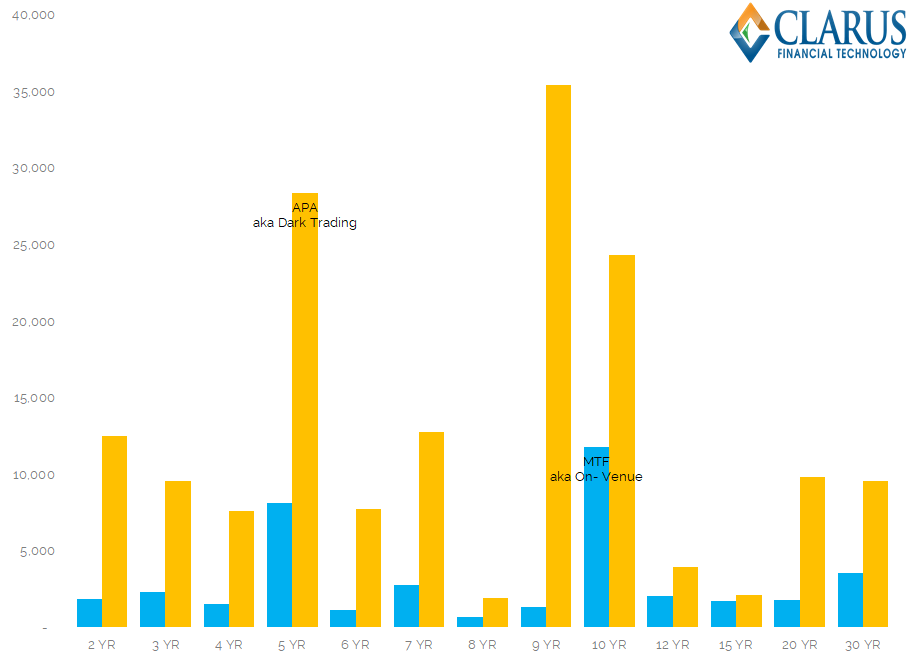
Some rudimentary conclusions can be drawn by making some broad assumptions:
- Let’s assume that all EUR IRS reported to the TW APA are transacted off-venue (I don’t have all of the flags from Tradeweb in our data file to be sure, but it sounds about right).
- The ISIN debacle means that we can only assume that all swaps are spot starting and hence subject to the Trading Obligation.
- So far, I only have equivalent (and clean) data for the Bloomberg MTF and APA on the 10th January.
- Best guess for the Bloomberg MTF ADV is €5.5m DV01 (based on two data points only. We’ll refine this ASAP as we process more data). This compares with an ADV on the Tradeweb MTF of €9m DV01. Let’s take a first guess of €14.5m ADV trades across an MTF.
- ADV in EUR IRS reported to the Tradeweb APA was €34m DV01.
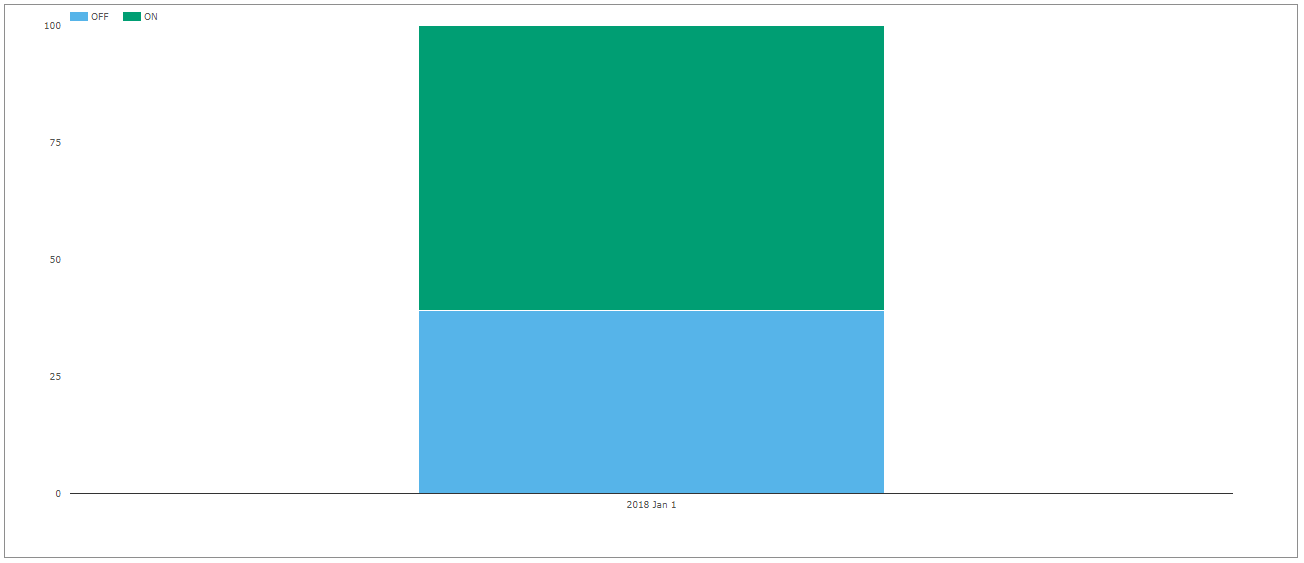
- If we look at only the maturities subject to the Trading Obligation in Europe, we find that only 31% of D2C risk was traded on-venue (BMTF €5.5m, TW €6.8m, APA €27.6m in terms of ADV DV01 figures).
- For MAT tenors in the US, a comparable statistic is that 61% of MAT trades are executed on-SEF (across both D2D and D2C venues).
Please note that these figures are extremely early conclusions. We need better data to refine them, which is slowly coming.
In Summary
- Tradeweb look to have a healthy market share in the D2C EUR IRS MTF market.
- Most risk continues to be traded off-venue, which suggests limited success of the Trading Obligation so far.
- These are very early conclusions so please take them with caveats in hand.
- We will continue to work with the data available to refine our analysis.