- USD IRS , OIS and SOFR volumes
- EUR IRS, OIS and €STR volumes
- May compared to prior months and 1Q 2021
- CCP market share for currency and product
- CCPView provides transparency on Swap volumes
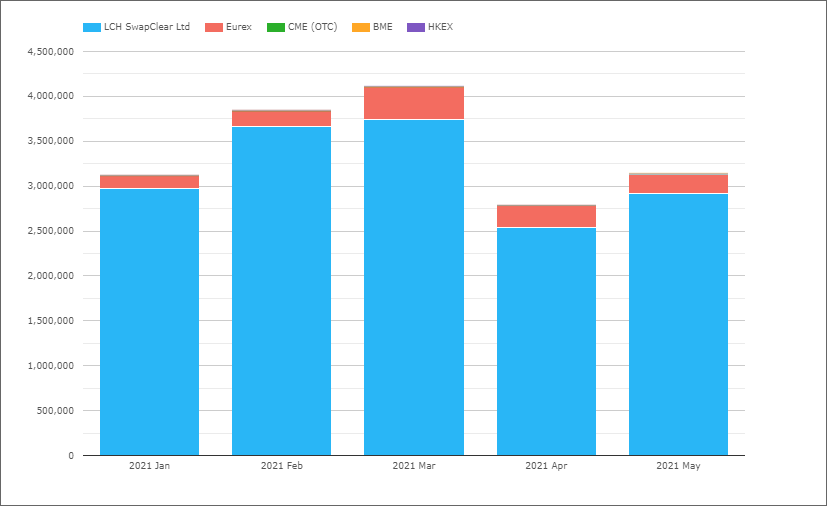
USD IRS
From CCPView, USD IRS only, so excluding OIS, Basis, ZC, VNS and FRAs.

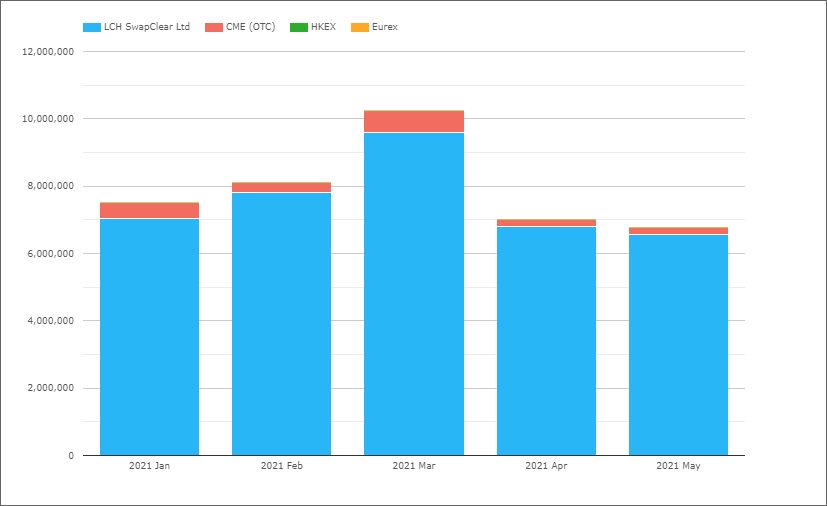
- May with $6.8 trillion, similar to April and down from the high in March
- LCH SwapClear with $6.6 trillion in May, a share of 97.1%, up from 94.5% in Q1 2021
- CME OTC with $198 billion in May, a share of 2.9%, down from 5.5% in Q1 2021
- Comparing Client volumes at LCH SwapClear with CME OTC volumes (assuming all CME volume is client), in May 2021, the respective shares were 92.5% vs 7.5%, while in Q1 2021 they were 88% vs 12%
- HKEX with $1.275 billion in May and a cumulative $3 billion YTD
- Eurex with a cumulative $2 billion YTD
Part of the relative increase at LCH SwapClear over CME OTC is probably due to the fact that FRA Reset volumes generated by (NEX Reset, TP MatchBook and Dealerweb) moved from using only the product FRA to also using IRS as single period swaps, see Toxic FRAs, Fallbacks and SPS and this portfolio maintenance activity mostly clears at LCH.
We can observe this effect by looking at monthly IRS and FRA volumes since Jan 2020.
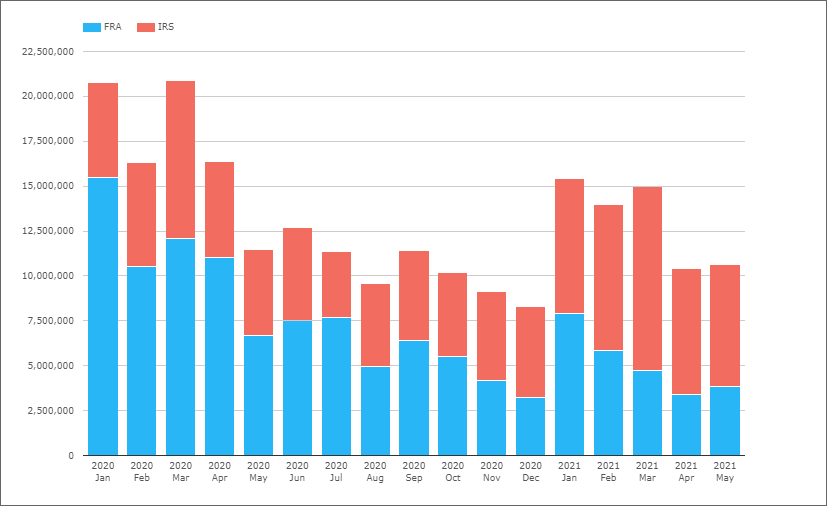
Showing over time the sharply lower FRA volumes and how these were always higher than IRS each month until 4Q 2020 and a continuing drop since.
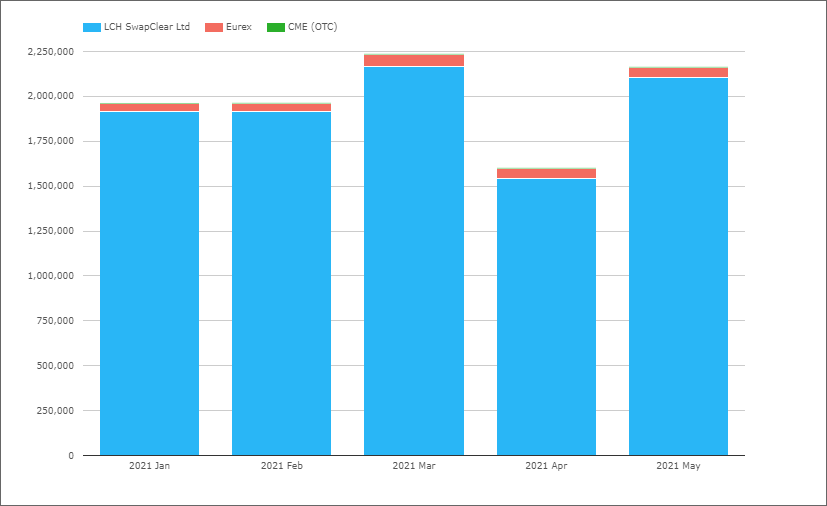
USD OIS
Next Overnight Index Swaps that reference FedFunds or SOFR.
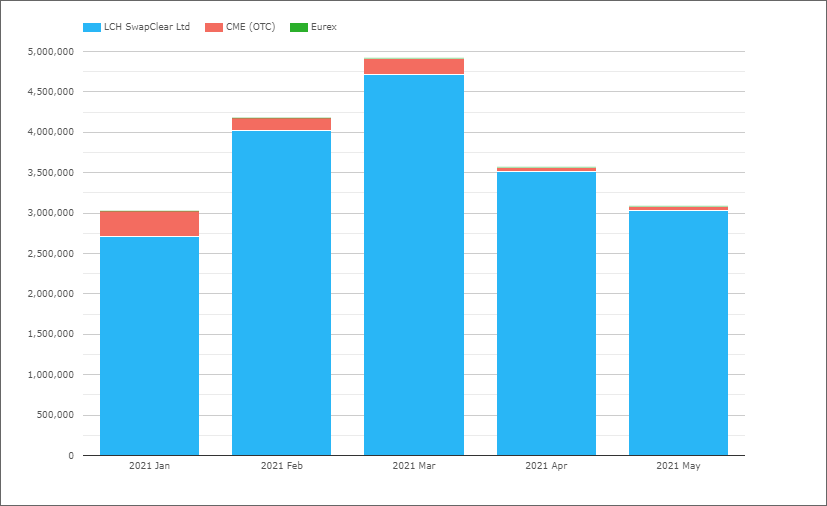
- May with $3.1 trillion, down from $3.6 trillion in April and the $4.9 trillion high in March
- LCH SwapClear with $3 trillion in May, a share of 98.1%, up from 94.4% in Q1 2021
- CME OTC with $58 billion in May, a share of 1.9%, down from 5.6% in Q1 2021
- Comparing Client volumes at LCH SwapClear with CME OTC volumes (assuming all CME volume is client), in May 2021, the respective shares were 97.2% vs 2.8%, while in Q1 2021 they were 92.1% vs 7.9%
- Eurex with a cumulative $2.1 billion YTD
There is no portfolio maintenance activity for OIS ( a daily averaging product) that uses FRAs or SPS, so the relative increase at LCH SwapClear is not due to this but results from a larger drop in OIS volumes at CME than LCH over this period.
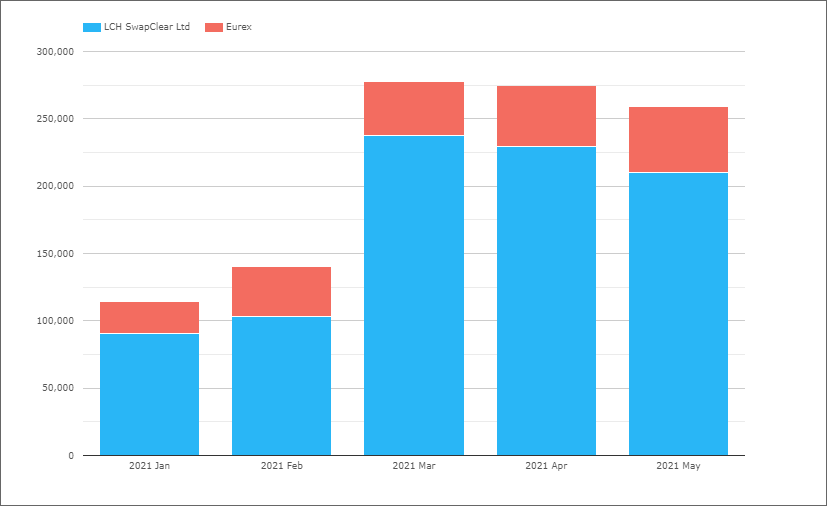
USD SOFR
Swaps which reference SOFR, both OIS and Basis.
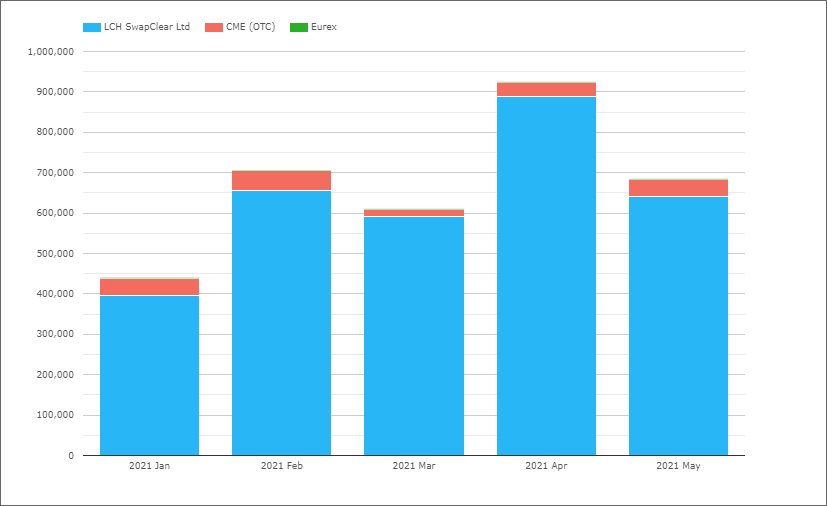
- May with $685 billion, down from $925 billion in April and up from $610 billion in March
- LCH SwapClear with $642 billion in May, a share of 94%, up from 93.6% in Q1 2021
- CME OTC with $41 billion in May, a share of 6%, down from 6.3% in Q1 2021
- Eurex reporting $1.5 billion YTD, all in Jan 2021
While we do not have a split of the SOFR volumes between OIS and Basis, if we crudely estimate that 50% is OIS and 50% Basis, then the total May volume of $685 billion gives us $342 billion of SOFR OIS; a figure which is contained within the overall OIS (FF & SOFR) volume of $3.1 trillion from the prior section. This allows us to estimate the share of OIS as 89% FedFunds and 11% SOFR.
CME-LCH CCP Switch
In SEFView, we can isolate Swap volume that is CME-LCH CCP Switch trades.
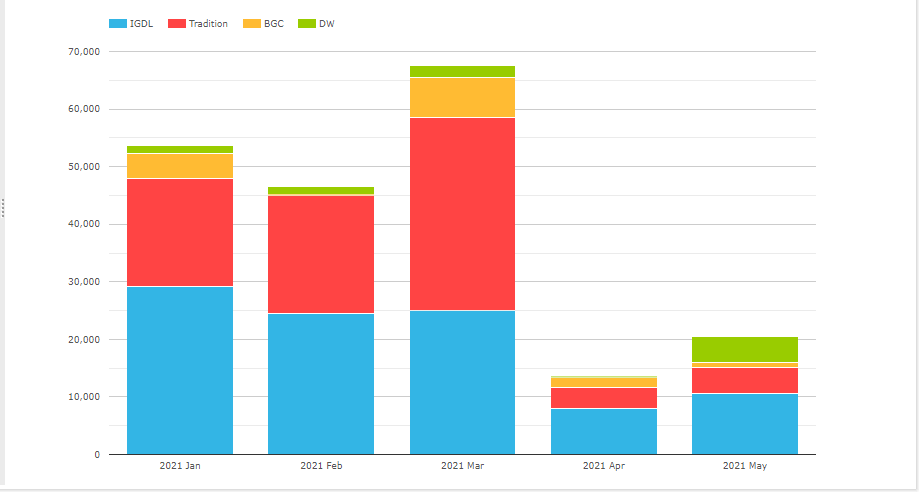
Showing a sharp drop from the $68 billion in March to just $14 billion in April. Not sure if this is a contributor to the lower CME share in April and May compared to 1Q 2021.
IGDL (ICAP) with the largest cumulative YTD notional of $97 billion, followed by Tradition with $81 billion.
EUR IRS
Next EUR IRS only, so excluding OIS, Basis, ZC, VNS and FRAs.

- May with €3.1 trillion, up from €2.8 trillion in April and down from €4.1 trillion in March
- LCH SwapClear with €2.9 trillion in May, a share of 92.9%, down from 93.8% in Q1 2021
- Eurex with €221 billion in May, a share of 7%, up from from 6.1% in Q1 2021
- CME with a cumulative €12.5 billion YTD
- BME with €19 million in March and HKEX with €2 million in May
Eurex continuing to gain market share, with its 1Q 2021 share of 6.1% now up to 7.9% in the 2 realized months (April & May) of 2Q 2021.
Also worth noting that as EURIBOR is not ending, we do not see the same migration of FRA volumes to SPS that is happening in USD, GBP, CHF & JPY.
EUR OIS
Overnight Index Swaps that reference EONIA or €STR.
- May with €2.2 trillion, up from €1.6 trillion in April and similar to €2.2 trillion in March
- LCH SwapClear with €2.1 trillion in May, a share of 97.2%, similar to the 97.4% in Q1 2021
- Eurex with €61 billion in May, a share of 2.8%, similar to the 2.6% in Q1 2021
Comparing 1Q2021 with the two months of Q2021, we see Eurex share in OIS increasing from 2.6% to 3.1%, a gain of 0.5%, compared to the 1.8% absolute increase in IRS (6.1% to 7.9%, see prior section).
€STR Swaps
Swaps which reference €STR, both OIS and Basis.
- May with €260 billion, down from €275 billion in April and €278 billion in March
- LCH SwapClear with €210 billion in May, a share of 81.1%, same as Q1 2021
- Eurex with €49 billion in May, a share of 18.9%, same as Q1 2021
As we have noted before the EUREX share in €STR at 19% is far higher than its share of OIS or IRS.
LCH-EUX CCP Switch
It would be interesting if we could quantify the volume of CCP Basis Swaps that switch risk from LCH to Eurex or vice-versa, but unfortunately unlike Dodd-Frank transparency that our SEFView product can utilize, we cannot get comparable data from MiFID II transparency. Hopefully next year…
That’s It
There is a lot more data in CCPView and SEFView.
Volumes by tenor buckets: 2Y, 5Y, 10Y, 20Y, 30Y.
Daily, weekly, monthly, quarterly or annual.
Volume in DV01 terms, Open Interest and ADV.
Swaps in many more currencies and product types.
EM with Asia Pac, EMEA, LatAm.
And Futures and Options in all major currencies.
Please contact us if you are interested in a subscription.