- Is USD SOFR trading becoming a real thing now?
- We use CCPView, SDRView and Clarus Microservices to measure activity levels.
- We find a record amount of risk traded in April 2019 versus SOFR.
- We also see Compression activity of back-dated trades in SOFR.
- Read on to find out more details.
SOFR Volumes April 2019
You only have to look at my inbox to see how much trading occurred in SOFR last month. This was undoubtedly a record month for activity:

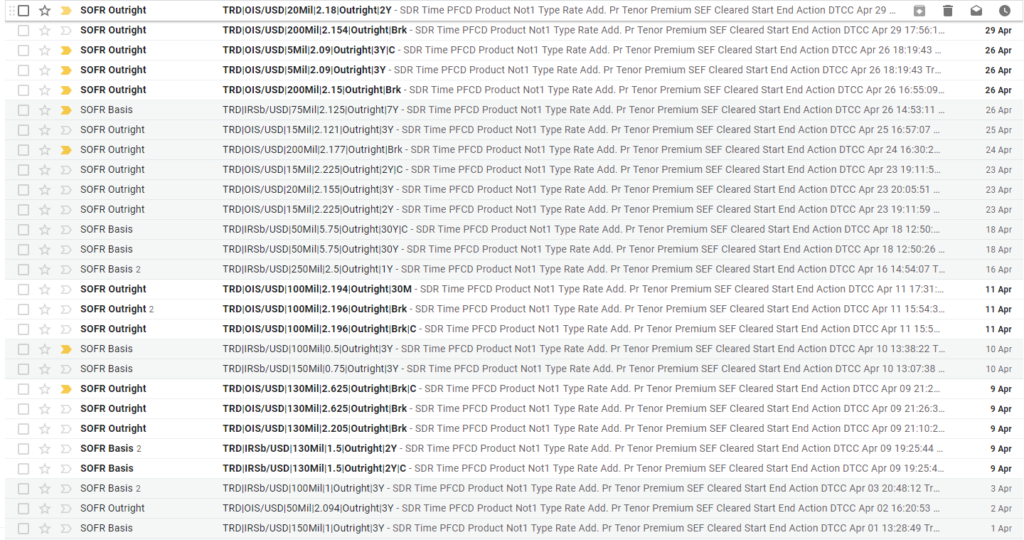
Showing;
- There has typically been activity on every trading day – it is not as patchy as previously.
- We did not see any extremely short-dated 3-day trades in April.
It appears that SOFR swap trading is slowly becoming a real “thing”. The above emails were received thanks to email alerts set-up in SDRView Pro.
Below I present the data behind those emails and what it means for trading activity in SOFR.
SDRView Pro
Our SDRView Pro browser-based app is designed for traders and brokers to have open on their desktops at all times. It provides a real-time view of SDR trades as they are reported. These can be viewed using the embedded charts or as a condensed and simplified “ticker” view of daily activity.
It also offers user-configurable email alerts that can be defined at the currency or product level, including thresholds for DV01 or notional amounts.
The last month of SOFR activity in outright OIS is shown below:

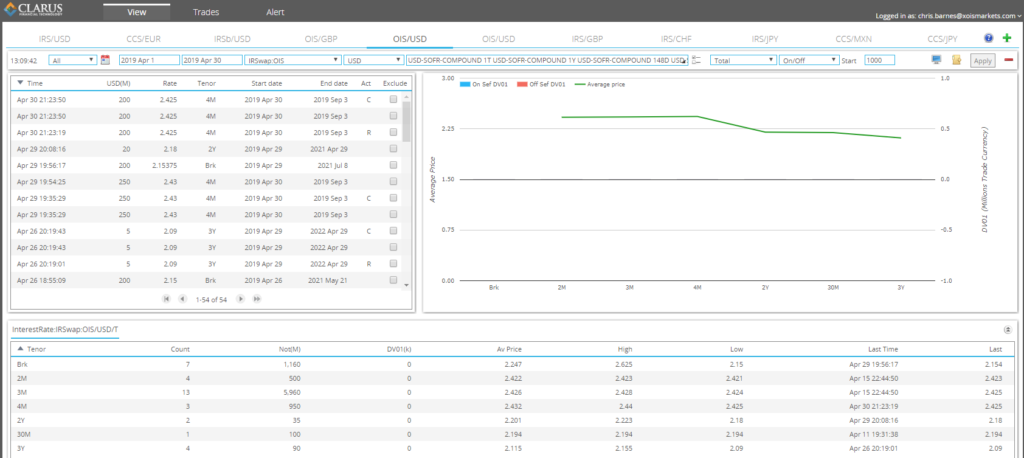
Showing;
- A total notional of $8.795bn traded in April 2019 of outright OIS.
- Maturities ranging from 2 months to 3 years.
- 3 month was the most traded tenor – 13 times.
- There were 14 trades longer than one year maturity – a sign that more duration is trading.
- The term structure is beginning to take shape on the curve (see chart).
SDRView Researcher
Our SDRView Researcher browser-based app is designed for all market participants who are interested in tracking volume-based activity over a longer period of time. The app provides a window into the data history, and it is designed to make navigating, exploring and exporting SDR data that much simpler. SDRView Pro concentrates on recent trading activity; SDRView Researcher concentrates on trends in the data over longer periods of time.
Most of our data management resources are spent in curating this data, and augmenting the trades to calculate DV01 amounts, NPVs and assigning package types such as maturity spreads, butterflies or compression.
Recent SOFR activity is shown below;

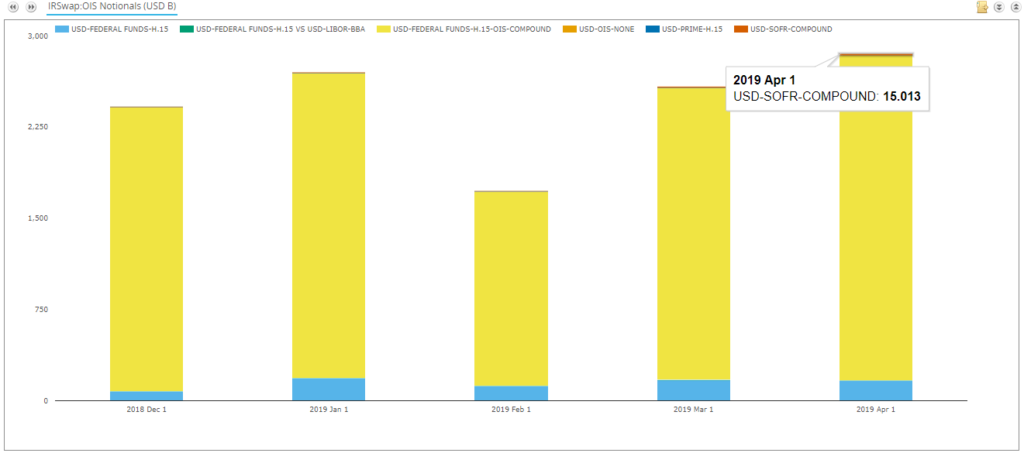
Showing
- All OIS swaps traded in USD since December 2018. The red sliver of SOFR volume is getting noticeably larger each month!
- A total of $15 bn traded in outright SOFR OIS during April 2019.
- Eagle-eyed readers will notice that this is a different notional amount to that reported by SDRView Pro above (at $8.795bn).
Where does this difference come from?
Drilling down into the SOFR swaps in SDRView Researcher, we see that there were also 18 Back Starting swaps reported to the SDRs during April. These are excluded from our SDRView Pro filters, because they are typically not price-forming transactions, therefore not relevant to current trading activity.
In terms of this blog, however, they are somewhat interesting!
- I don’t recall seeing back-dated trades in SOFR before.
- 16 of the 18 swaps were executed at an identical time on the 12th April. This suggests they were transacted as part of a Compression cycle.
- Does this mean that these SOFR swaps were torn up? Or were they being backloaded into Clearing as part of a package? We don’t normally see backloads reported as far as I am aware.
Overall, using SDRView Res we therefore see the following picture of activity:
- 52 outright OIS trades, totaling $15bn.
- 16 basis trades, totaling $1.76bn.
CCPView
Finally on our tour of SOFR, it is worth noting that we have concentrated on data from SDRs so far. This is public transaction level data that is reported by US Persons. As such, it does not cover the entire global market – although it is a pretty good assumption that it covers most of the current SOFR activity.
CCPView, on the other hand, covers the entire global cleared market. It takes public data directly from CCPs themselves.
I therefore took a look at the most recent SOFR data from LCH – which can be found here as well.
Importantly, it includes SOFR data by tenor, something that SDRView Pro and Res also include.
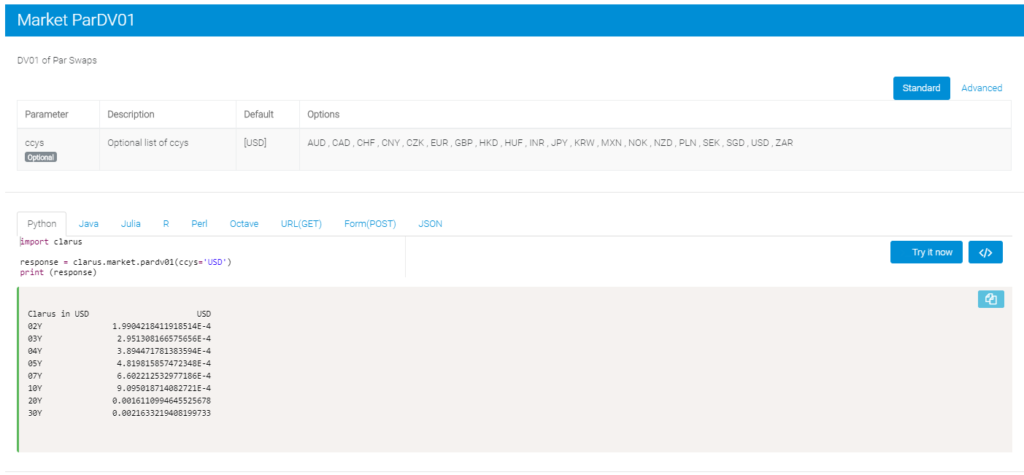
Using this tenor data, I have combined it with our ParDV01 method via Clarus Microservices. This allows me to compare notionals across different tenors using a maturity-agnostic measure of the amount of risk traded (DV01). The call in python or via Excel is super simple and intuitive:

The data reveals a real achievement for SOFR trading;

April 2019 was the largest trading month ever for SOFR swaps
- Look at that! April 2019 was the largest month on record for the amount of risk traded in swaps versus SOFR!
- A total of $2.17m DV01 traded.
- This covers both OIS outrights and basis swaps so far as I can tell from the LCH website (we will verify).
- These are single counted volumes, consistent with the Clarus Data Principles.
- The above figures are estimates due to the crude bucketing of tenors in the data, but we believe it to be accurate when cross-checked against the SDR data.
- A DV01 measure such as this is infinitely preferable to the notional measure that is normally published, because it avoids very short dated, large notional trades from skewing the data.
With April a short trading month (Easter holidays always eat into activity), this increase in SOFR activity is particularly noticeable.
I think that this now signals trading moving away from test trades and into real risk management.
One to keep an eye on, via our Clarus Data Products, throughout the LIBOR transition period.
In Summary
- April 2019 was a record month for USD SOFR swaps activity.
- There were 68 trades totaling over $17bn in notional (single counted).
- This signals that trading is moving from test trades to real risk management. There was even some Compression!
- We estimate that over $2m in DV01 of risk was traded.