- What is the biggest market in USD Rates? Are futures bigger than swaps? Are cash bonds even bigger?
- We build on important research from both CME and the CFTC to try to answer those questions.
- We look at Clarus data to measure the DV01 traded in both swaps and futures in long-end USD Rates.
- We can now provide a complete view of the USD Rates complex thanks to tenor data in cleared swaps.
Market Structure
There is a simple question that is often asked and is actually pretty hard to answer:
Which is the biggest market in USD Rates – Swaps, Futures or Cash bonds?
Motivated by some recent CME research and our new tenor data in CCPView, I set out to answer that question.
Futures versus Cash
The CME published a great article in January, and I think that it is well worth a read by everyone in the market:
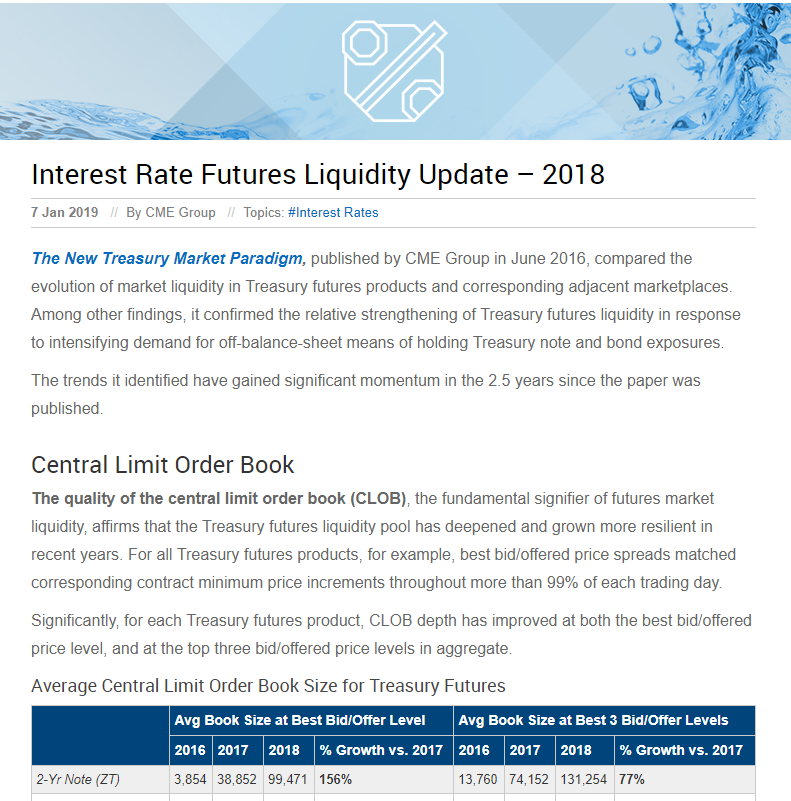
Of particular note to me was the following chart:
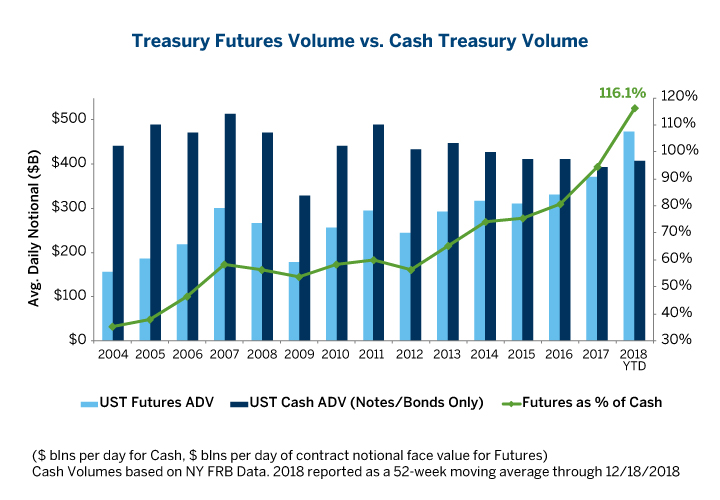
- This chart shows the Average Daily Volume traded in US bond futures and compares it to the average daily volume transacted across cash bonds.
- Traditionally, the cash bond market has always been the largest, most traded market.
- However, this has recently changed.
- There is now a greater average daily volume transacted in futures linked to cash bonds, rather than cash-bonds themselves.
Therefore, answering one of our questions posed at the beginning, we know that futures are larger than cash bonds.
What About Swaps?
The CME note also references an interesting paper from the CFTC, snappily titled:
The Liquidity Hierarchy in the U.S. Treasury Market: Summary Statistics from CBOT Futures and TRACE Bond Data
Written by Lee Baker, Lihong McPhail and Bruce Tuckman, it looks at an array of data from the Rates market. One particular chart of theirs caught my eye:
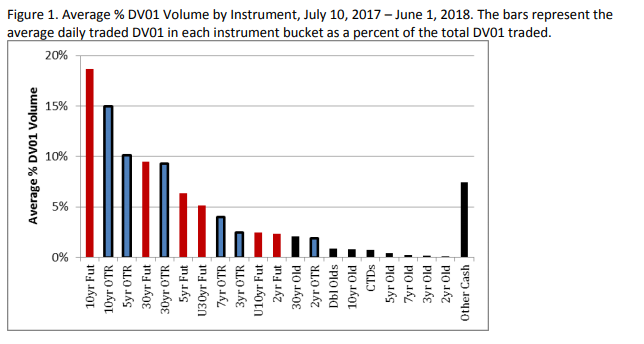
Which shows the percentage of DV01 that was traded in each instrument.
Having now seen two charts comparing cash and futures, I immediately thought “I wish we could add OTC swaps into that mix“.
I’ve previously had a quick look at this kind of thing, but only really had incomplete answers – for example when we compared the Spreadover market to the underlying UST market itself.
This time, however, is different.
Futures versus Swaps
CCPView now includes tenor data from both LCH and CME. Therefore, combining with our volume data from the CME on their Futures, we can compare like-for-like maturities in Futures and Swaps by running a single query.
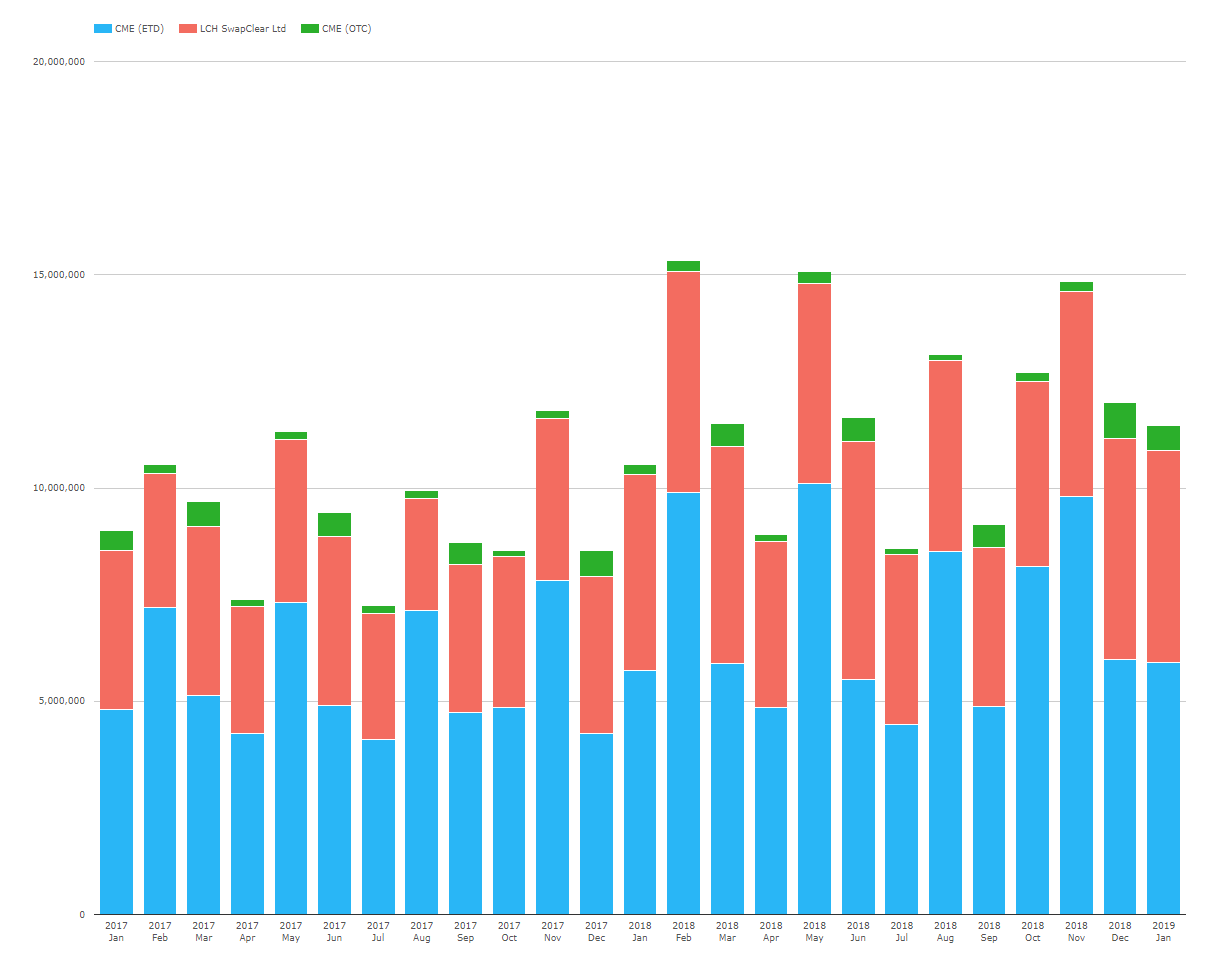
- I think this chart is awesome.
- It shows, in a single view, the notional volume of US T-Note futures with maturities of 5y, 7y and 10y, plus the US T-Bond future with a nominal maturity of 25y.
- Against that, we have the OTC volume reported by CME and LCH SwapClear in their 5y, 10y and 30y buckets.
- Finally – a like-for-like comparison between Futures volumes and OTC volumes in a single chart.
When we run the same chart on a percentage basis we find that:
- The percentage of notional traded as a future is highest during roll months (i.e. Feb, May, Aug, Nov).
- In these roll months, the percentage traded as a future can be as high as 72%.
- In non-roll months, the range is more like 47-57%.
- Difficult to see a trend.
Swaps as a Percentage of Futures Volume
Armed with this data, I also converted to DV01 equivalents, to make sure there is zero bias in the data (e.g. just in case all swaps volume happens to be in the shortest possible maturities). We have been unable to do this analysis previously because we did not have cleared swaps data by tenor. Now we do!
And in the spirit of comparing to the CME chart, I’ve recreated the analysis they did, but using futures as the base.
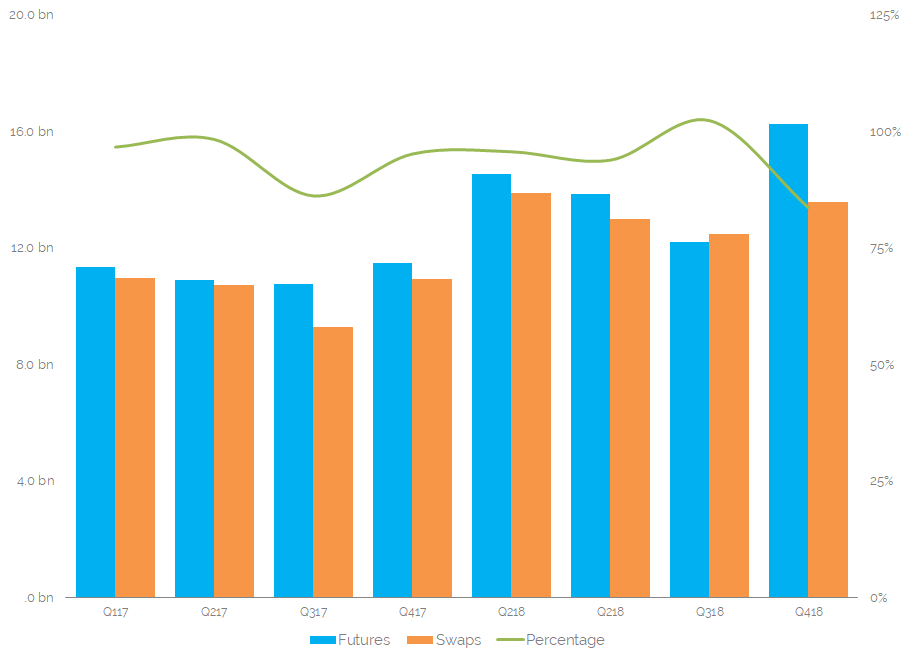
Showing;
- A quarterly time-series to smooth out the roll months in futures volumes.
- Volumes are expressed in DV01, providing a maturity agnostic measure of risk, similar to the CFTC chart.
- Both Swaps and Futures have seen an increase in volumes since Q1 2017, with Q4 2018 an overall record quarter for volumes when measured in DV01.
- Importantly, we can finally compare the amount of risk traded in standardised futures contracts versus the amount of risk traded in standardised tenors of OTC swaps.
The chart shows that the amount of risk that is traded in Swaps and Futures is very evenly matched during all quarterly periods. Swaps trading accounts for anything from 84% to 102% of risk traded in the (UST) futures market.
So to answer the question I posed at the top of the blog:
Futures tend to be the largest market in Rates trading. Swaps saw more risk trade in Q3 2018, but the swaps market tends to be about 6% smaller than futures. Overall, Swaps and Futures are pretty evenly matched in size and the analysis suggests that both are now larger than the cash-bond UST market.
The Overall Swaps Markets
Now that tenor data is included in CCPView, many analyses of this type are possible. For example, I have included both vanilla IRS, OIS and Inflation swaps in the OTC swaps notional. And the tenor data is bucketed into 5y, 10y and 30y for swaps. However, this excludes the short-end, where we could go on to look at the risk traded in 2y swaps versus both Eurodollars and short-dated T-Note futures.
I will have to leave that to our subscribers to examine.
In Summary
- The amount of risk traded in USD Swaps is broadly equivalent to the amount of risk traded in USD futures.
- The ratios range from 84% to 102% quarter-to-quarter.
- Futures tend to be the largest market in USD Rates, followed by Swaps. UST Cash bonds are the smallest market at the moment.