- Total volumes in USD Rates hit new records in 2023, growing by 35% since 2020.
- Volumes grew across US Treasuries, bond futures and OTC swaps.
- Clarus provides volume data by tenor for all of these asset classes under a single data subscription.
- Our data shows that bond futures have seen the strongest growth in the past four years.
We have previously noted that EUR Rates are now larger than USD Rates in terms of notional traded across OTC swaps (see here and here). This change has arisen because EUR has continued in a multi-rate environment – both €STR and EURIBOR swaps still trade, whilst USD has largely moved to SOFR, with Fed Funds still active in the short end.
In light of which, I wanted to refresh an old blog to see which areas of the curve had changed in the US market.
CCPView provides granular data on traded volumes across Futures, Swaps and US Treasuries. With the relative change to EUR markets, I was interested to see what had happened to volumes across the USD curve.
USD Outright Volumes
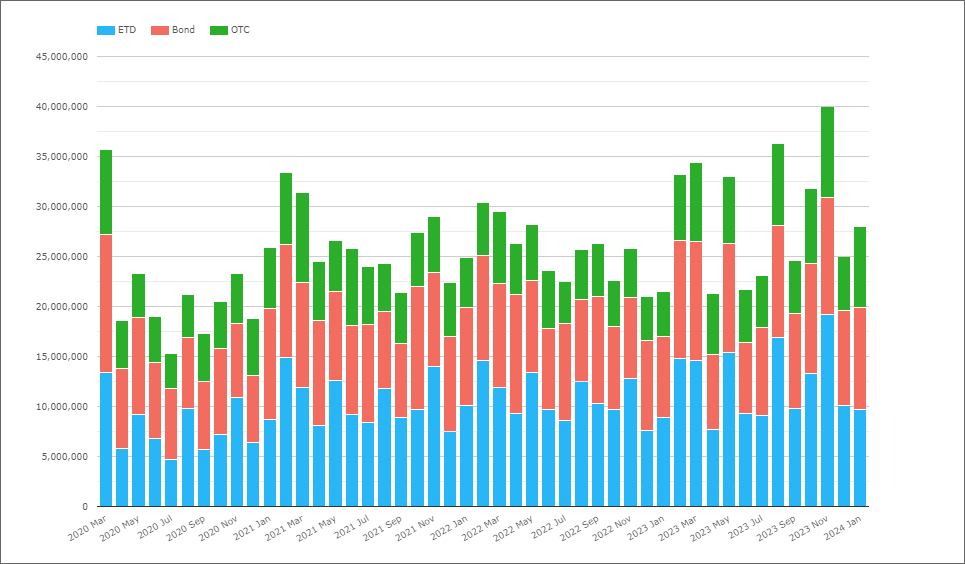
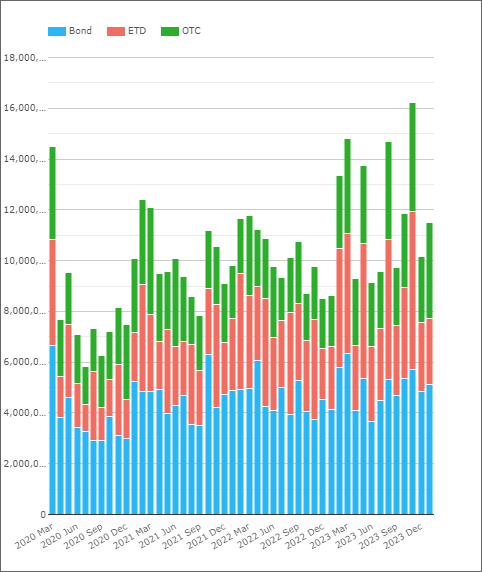
The chart below shows monthly volumes since March 2020:
Showing;
- Monthly volumes in notional equivalents across all long-dated USD rates products.
- The chart looks at all products with tenors longer than 2Y – covering Bonds (US Treasuries), ETD (bond futures) and OTC (interest rate swaps and OIS).
- March 2020, when post-trade transparency data was first made available for US Treasuries, was obviously an unusual month with $35Trn+ traded across all products.
- However, these volumes have recently been surpassed – first in August 2023 and more recently November 2023.
- 2023 saw six months (half the year!) when volumes were over $30Trn equivalent – the first time we’ve ever seen this.
Product Split in USD Rates
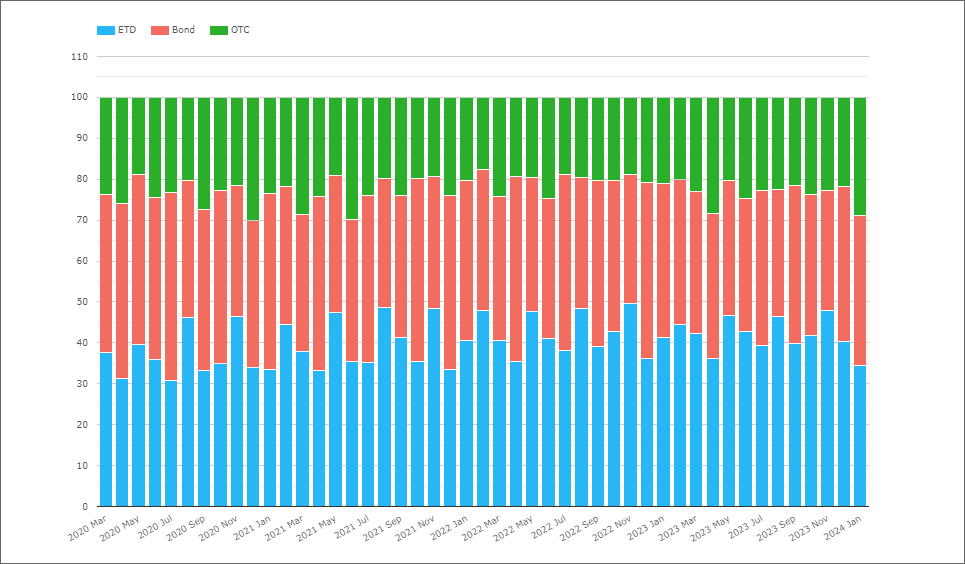
The chart below shows the same data as above, but as a percentage of volumes traded:
Showing;
- ETDs (Bond Futures) are seeing an increase in usage. In 2020, they accounted for 37% of volumes. This has gradually increased over the three years since, to now sit at 42%.
- The increased usage of ETDs has seen both Bonds and OTC reduce slightly.
- Bonds (USTs) made up 39% of traded volumes in 2020. That has since reduced to 35%.
- OTC markets accounted for 24% in 2020, and was at 23% in 2023.
- Exchange Traded Derivatives (Bond Futures) can now be considered the “largest” of the three markets. Useful for considering where the most “liquidity” lies if you have a large chunk of risk to move.
10 Years
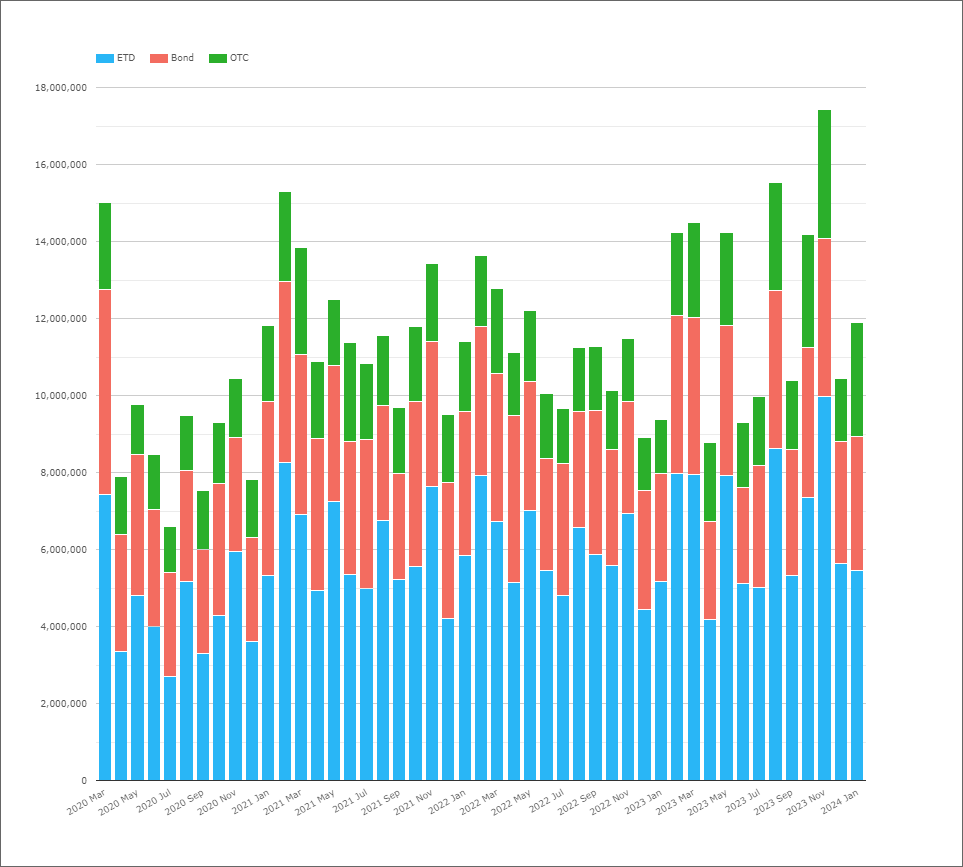
We can run the same analysis by any tenor we choose. The 10Y area of the curve is up first:
Showing;
- Volumes in the 7Y-10Y area of the curve. This therefore covers both the CME T-Note and the CME Ultra-10Y ETD contracts.
- For cash bonds, monthly average volumes have increased by 7% from 2020 to 2023.
- OTC swaps saw volumes increase by 45% – topping $2.2Trn per month in 2023. Not bad considering it was the only market going through benchmark transition!
- ETD saw even larger growth in volumes, increasing by 50% to stand at over $6.6Trn notional equivalent each month in 2023.
- ETDs therefore accounted for about 54% of all volumes in the (7Y-) 10Y area of the curve, up from 48% in 2020.
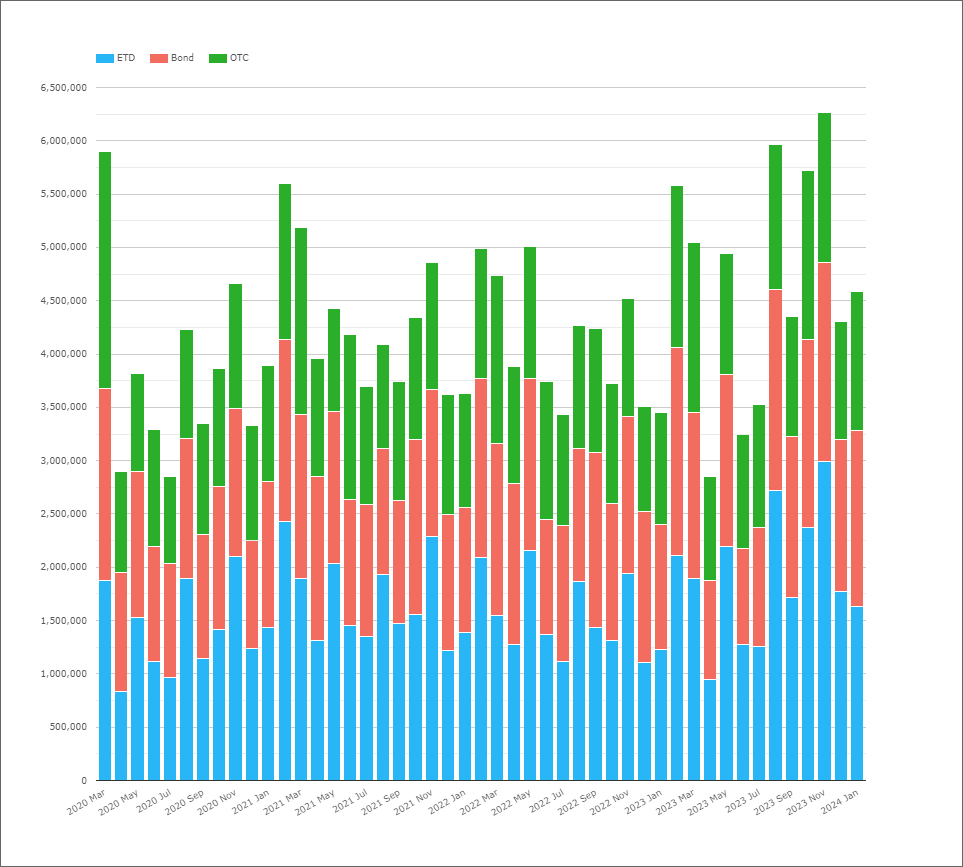
Long Rates – 30Y
Showing;
- Volumes longer than 15Y. Ideally we would look just at 30Y, but the CME “long bond” UST future has a deliverable maturity of 15Y so it makes sense to compare with USTs and Swaps of similar maturities.
- ETDs have again seen the most amount of growth for these maturities, increasing by 33% since 2020. This meant they made up 40% of traded volumes in 2023, up from 37% in 2020.
- OTC derivatives remain the least traded asset class in these long-dated maturities, with volumes reducing from 30% to 28% of volumes (despite OTC volumes actually growing by 10% over the period).
- Finally, cash bond USTs have seen average monthly volumes grow by 16% since 2020, with their share oscillating between 32-24% year on year.
- The changes in asset class mix are small but they have shown a consistent trend over the years. It is interesting to see that some trading is moving from OTC to ETDs.
- For all of the asset classes, volumes have grown in this important area of the curve – where a lot of risk is transferred.
- For OTC trends, it is near impossible to unpick the impact of SOFR transition on the volumes. Would volumes be larger in OTC if we were still in a LIBOR world? I think it is impossible to say.
5 Years
- US Treasury volumes account for the largest share of volumes in the short-end of the curve, but their dominance has waned in recent years.
- USTs accounted for 47% of monthly volumes in 2020. Despite growing by 32% since then, their overall share of volumes dropped to 43% in 2023.
- Again, ETDs have benefitted, with their share of volumes increasing from 26% to 32% in this area of the curve.
- OTC volumes dropped slightly from 28% to 25%.
We also note that ETD and OTC compete against Eurodollar futures for trading activity in this part of the curve (although not as much as in the 2Y and shorter tenors). Our ETD figures for this chart only look at bond futures.
In Summary
- Volumes surpassed $30Trn equivalent in six months during 2023 – the first time this has ever happened in USD Rates.
- Since 2020, volumes have grown across Bond Futures, USTs and Swaps.
- Average Monthly Volumes in Bond Futures in 3Y-5Y maturities grew by 81% between 2020 and 2023.
- Volumes grew by 45% in the 10Y area of the curve for Swap markets.
Finally, something that is not shown in the charts above:
- Really long-dated USTs were the only area that saw volumes shrink, with tenors longer than 25Y reducing by about 15% since 2020 (despite growth for these tenors in both Futures and Swaps). This means that Swap markets are now larger than UST markets for these “ultra-longs”.