Please see Part I of this Spreads & Butterflies series here.
Last week, we saw that up to 45% of vanilla, spot starting USD swaps can be considered part of a maturity spread. This week, we expand the analysis to identify exactly which spreads and butterflies are trading (for the sake of clarity, these blogs will refer to maturity spreads as “spreads”, and, in the future, spreads versus US Treasuries as “swap spreads”).
For ease of comparison, we retain the same trade date as the previous blog (17th September), but we expand the analysis to include all USD swaps done on-SEF on that day. Using the Clarus API, this gives us a total trade population that is 25% larger, but we do not see a meaningful increase in the number of additional spreads or ‘flies. This is pretty much as expected, given that these additional trades are, by their very nature, non-standard.
SPREADS
Let’s gloss over the details of the tweaks we’ve developed this week to the spread-identification algorithm, and jump straight to the chase. On the day of the last FOMC, which spreads traded? The graph below gives a pretty good one-screen overview:

The chart above shows, for example, that 10 years was traded as part of a spread in a total of $2.4m DV01. Of these spreads, most were versus 5 years ($1.4m) and 30 years ($875k). The reciprocal amount of 5 years traded against 10 years ($1.4m) is shown as the purple area on the five-year column.
Overall, we see that:
- 23 different combinations of maturities traded as a spread on this single day (e.g. 2y vs 3y, 2y vs 10y, 4y vs 5y etc etc etc)!
- A DV01 of $8.24m, or 20%, of all USD on-SEF trades can be identified as being one leg or another of a spread trade (excluding butterflies – see below).
- 5y (28%) and 10y (29%) are most frequently one-leg of a spread.
- The 5y vs 10y spread accounts for 34% of all spreads traded.
- There were 94 2-legged spread trades in total.
BUTTERFLIES
We know that swaps market participants are not happy just trading one maturity against another. As well as steepeners and flatteners, we also want to trade the curvature – i.e. butterflies. Given that 5y, 10y and 30y are the most frequent legs of spreads, I expected to see something similar in butterfly space, with 5y10y30y the “go-to” fly.
Not for the first time, the data has proven me wrong! Overall, we see:
- 11 different ‘flies traded.
- The 5 year point on the curve is the only maturity that occurs as the belly of more than one butterfly – appearing in 2y5y10y, 3y5y30y and 4y5y6y.
- 13% (DV01 of $5.25m) of all USD on-SEF trades can be identified as being one leg or another of a ‘fly trade.
- There were 53 3-legged ‘fly trades in total. In terms of frequency, 3y4y5y traded 13 times, more than any other ‘fly.
Additionally, I’ve found the best way to look at the ‘flies is to sum the DV01s to see which point on the curve is seen as the “pivot” point. So I take all instances where the point on the curve is the belly, and sum by DV01:
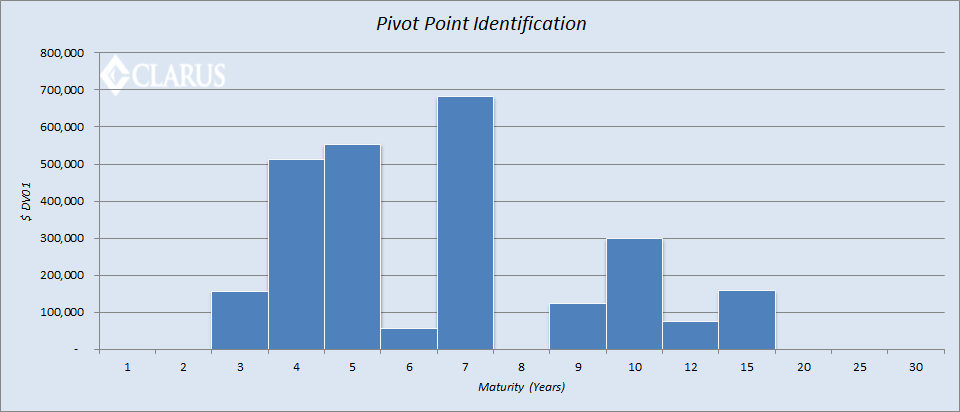
So much for 5y10y30y being the go-to ‘fly! Rather, we see that 5y7y10y is the most significant structure, accounting for 26% of all butterfly risk traded. We can actually see that 5y10y spreads plus the 5y7y10y ‘fly account for over 10% of the total DV01 traded on September 17th!
Amazingly, there is stark little evidence of being able to “leg” into ‘flies by means of combining two spreads. If we re-run the algo across the population of spread trades, we find only one instance where-by the spreads could combine to create a butterfly – and this despite “daisy-chains” of trades up to 12 in number. This suggests that either SEFs are unable to create a synthetic ‘fly in their CLOBs, or bid-offers are tighter on the ‘fly offerings. Answers in the comments section below please.
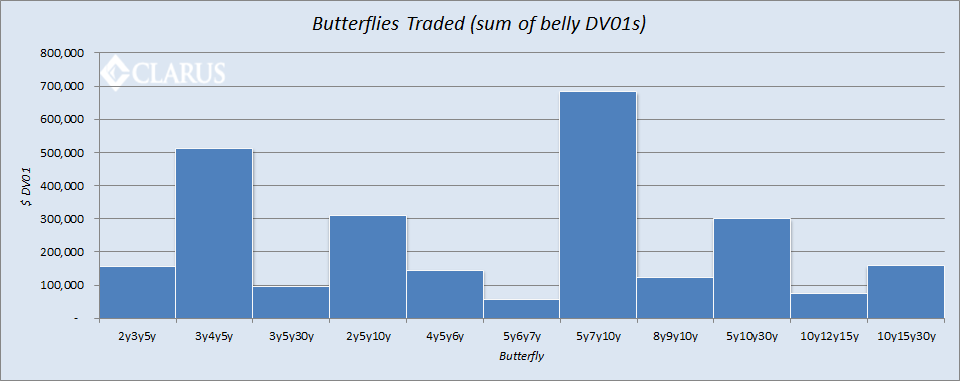
Happily, seeing as only 11 different ‘flies traded, we can also present the total risk that traded in each structure:
SUMMARY
- Out of a total on-SEF trade population for a single day, 33% of the DV01 traded is related to spread or butterfly trades.
- The sheer number of different spreads trading (23) is in stark contrast to the concentration in ‘flies, where only 11 different structures trade.
- 5y10y is the most traded spread.
- 5y7y10y is the most-traded ‘fly.
Most importantly, we are now able to distil our trade universe into trades that take a view on the curve versus those with outright DV01 exposures. We’ll continue to expand upon this theme over the coming weeks.