In this article I will look at Swap Execution Facility (SEF) volumes and market share in 2016 for Credit, Foreign Exchange and Interest Rate Derivative asset classes.
Clarus SEFView collects daily volumes published by each SEF and normalises this data to allow meaningful comparison and determination of market share statistics.
Summary:
- CRD
- Index, Option and Tranche products
- CDX.NA.IG is the largest
- Bloomberg dominates with 74% market share
- FXD
- IRD
Onto the charts, data and details.
CRD Volumes and Share
Lets start with Credit volumes by currency for each month.
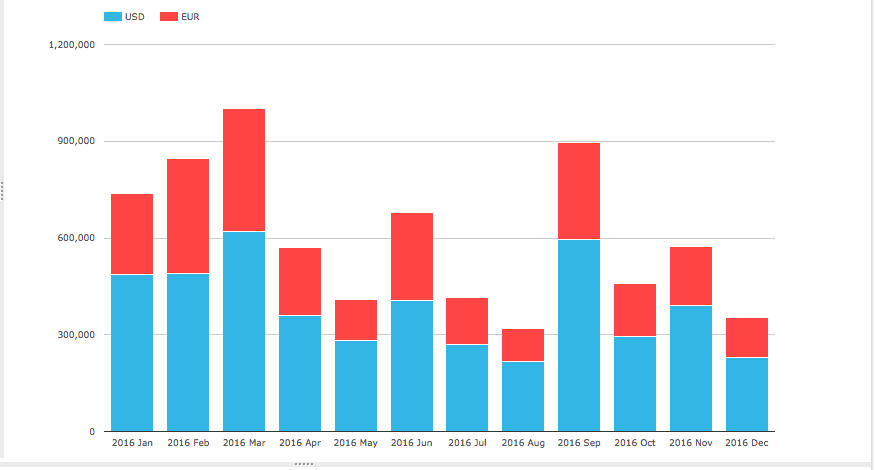
Showing that:
- USD is the largest (CDX.NA.IG, CDX.NA.HY, CDX.EM)
- EUR is next ( iTraxxEurope and iTraxxEuropeCrossOver)
- (Recall CFTC SEF rules govern Index not Single-name)
- USD is 65% and EUR 35% of the overall volume
- March and Sept were the highest volume driven by series rolls
Next lets look at a chart of market share in percent by gross notional for SEFs by month.
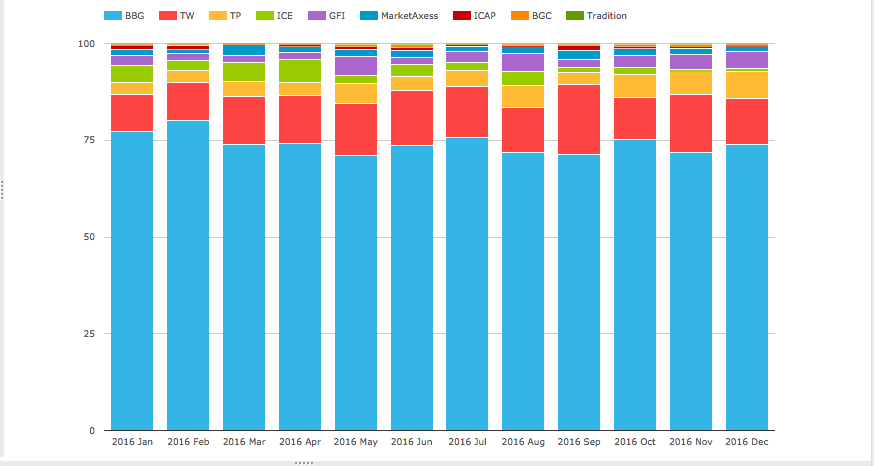
Showing that:
- BBG retains a commanding share of 74% for the year (2015 was 73%)
- Tradeweb is next with 13% (2015 was 11%)
- Tullet with 4% and USD only
- ICE with 3% for the year, but trending down significantly in last quarter (2015 was 4%)
- GFI with 2.6% and MarketAxess with 1.8%
- All others are 1.3% combined share
Next a chart of Currency and Product Type for 2016.
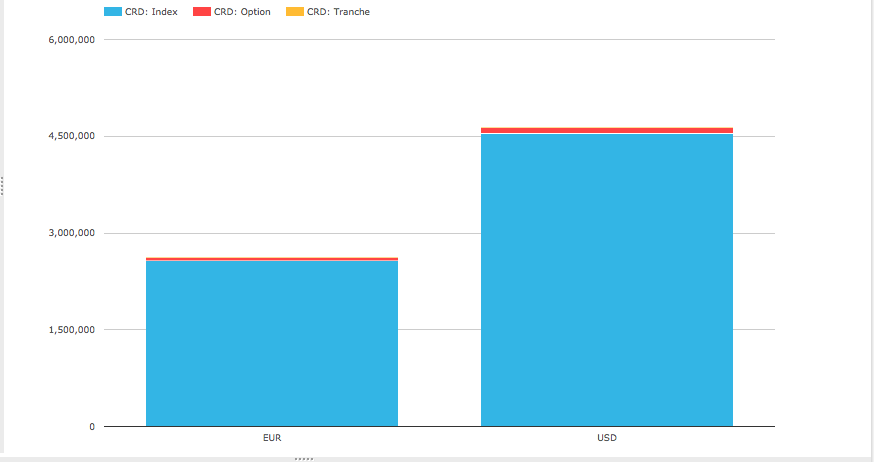
- EUR Index volume is $2.5 trillion, Option is $48.5 billion and Tranche is $1.2 billion gross notional
- USD Index volume is $4.5 trillion, Option is $71.6 billion and Tranche is $4.0 billion gross notional
And finally for Credit a chart of volume by Index for the current on the run series.
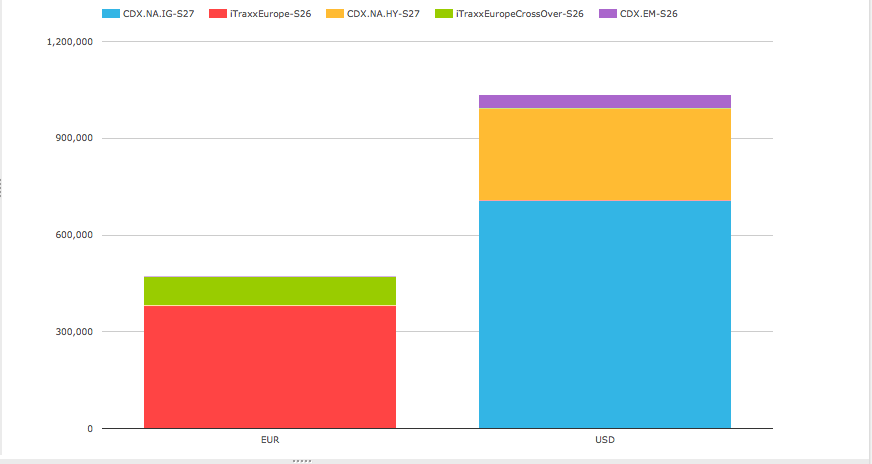
Showing CDX.NA.IG is by far the largest, followed by iTraxxEurope and CDX.NA.HY.
Thats it for CRD.
FXD Volumes and Share
Lets now look at FXD volumes by month and product type.
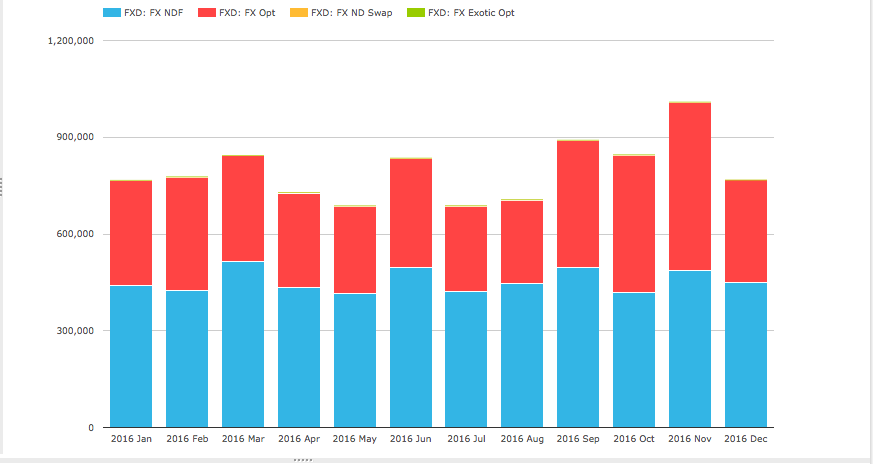
Showing that:
- Non-Deliverable Forwards (NDF) are the largest volume product with 60%
- FX Options (FXO) are next with 40%
- Others are comparatively insignificant
- November 2016 was the highest volume month
Next FX NDF by Currency pair percentage share and by month.
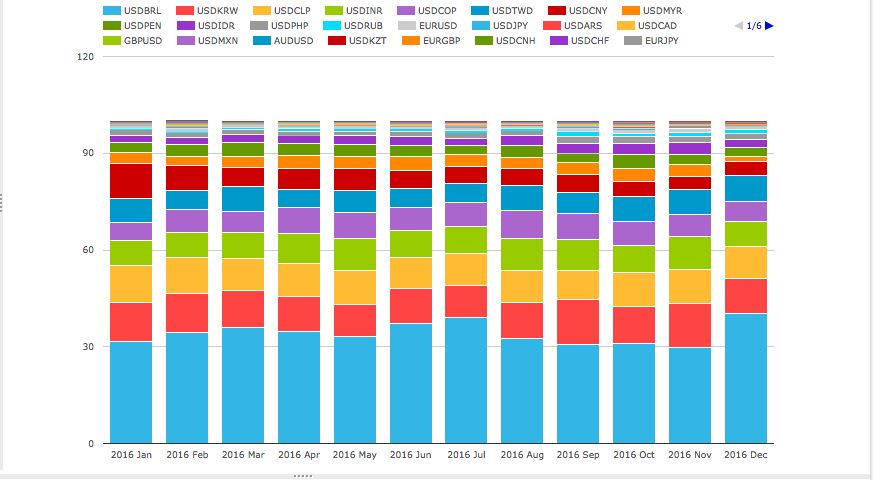
Showing BRL, KRW, CLP, INR, COP, TWD, CNY, MYR, PEN, IDR are the largest ten by volume.
NDF volumes are dominated by D2D SEFs with 94% vs 6% for D2C.
So lets first chart NDF percent market share for D2D SEFs by month.
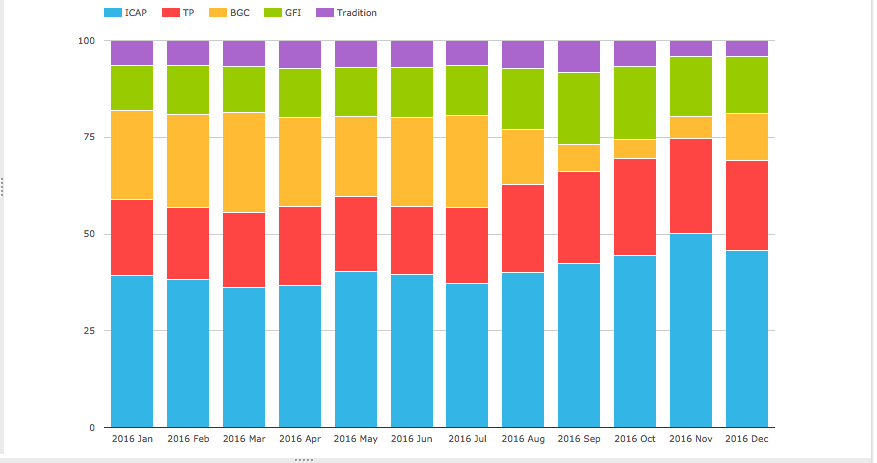
Showing:
- ICAP with the largest share at 40.8% (2015 was 32.8%)
- Tullet next with 21.2% (2015 was 19.1%)
- ICAP + Tullet is 62%
- BGC with 17.3% (2015 was 23.5%)
- GFI with 14.2% (2015 was 16.4%)
- BGC + GFI is 31.5%
- Tradition with 6.5% (2015 was 8.2%)
We know certain SEFs have distinct strengths in LatAm, Asian or European currency pairs, but will leave that to those of you interested to check yourself in SEFView.
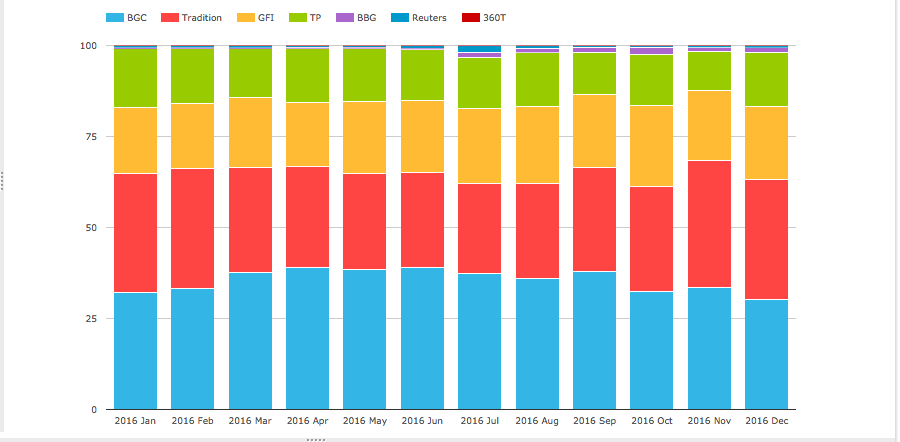
Next a chart of NDF percent market share for D2C SEFs by month.
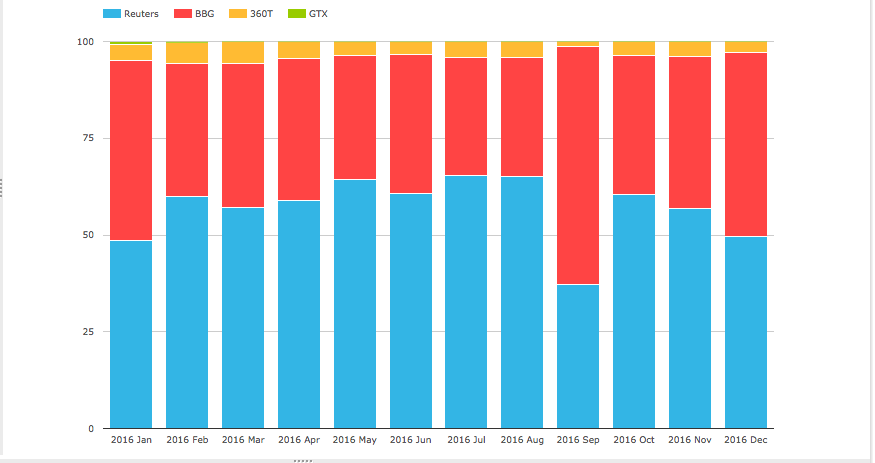
Showing:
- Reuters with the largest share at 55% for the year (2015 was 57%)
- Bloomberg next with 41% for the year (2015 was 37%)
- 360T with 3.6% (2015 was 6%)
- Some variation in share month on month e.g. Sep 2016
FXO volumes are dominated by D2D SEFs with 98.5% vs 1.5% for D2C, so lets just chart FXO percent market share for all SEFs by month.
Showing:
- BGC with the largest share at 35.3% for the year (2015 was 35.8%)
- Tradition next with 29.7% (2015 was 28.5%)
- GFI with 19.7% (2015 was 19.5%)
- BGC + GFI is 55%
- Tullet with 13.7% (2015 was 15%)
- Remaining SEFs are each less than 1%
- So no change from 2015 market share percentages.
Thats it for FXD.
IRD Volumes and Share
Lets now turn to the largest asset class IRD and start with a chart of gross notional by month for Vanilla Fixed Float Swaps and OIS Swaps (all currencies).
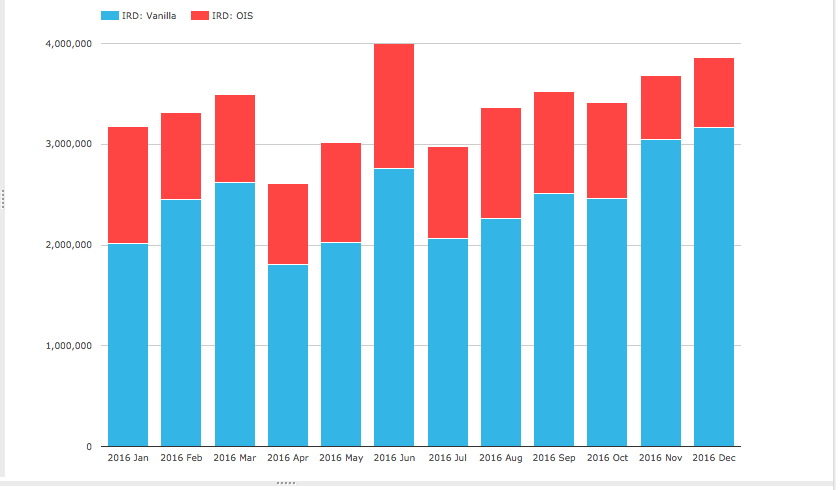
Showing that:
- June was the highest volume month, followed by December
- A rising volume trend from August onwards
- Vanilla IRS is the largest product
- Volume ranges from $2 trillion to $3 trillion per month (including SEF Compression)
- OIS Swaps is the second largest product
- Volumes ranges from $650 billion to $1.2 trillion per month
- (Note we exclude FRAs as they are predominantly portfolio maintenance and not price-forming)
Next the remaining IRD product types.
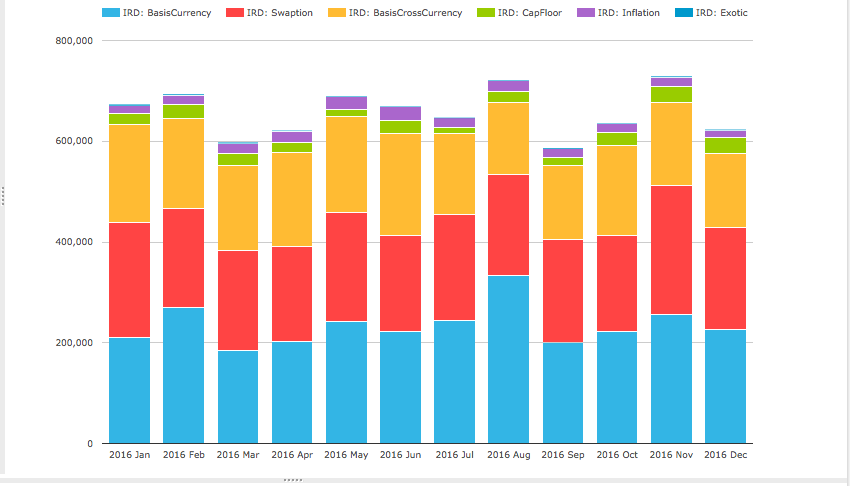
Showing:
- Cumulatively these products average $650 billion a month (25% of Vanilla IRS)
- Basis (Single) Currency are the highest, averaging $235 billion a month
- Swaptions are next, averaging $205 billion gross notional a month
- Basis Cross Currency average $170 billion gross notional a month
- CapFloors average $23 billion a month
- Inflation Swaps average $20 billion a month
Next the percent market share charts for each of the product types.
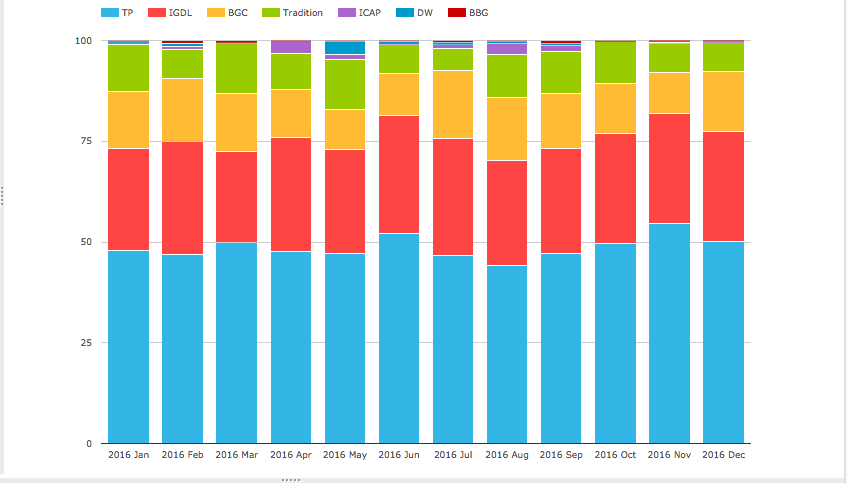
IRD Vanilla in USD, EUR, GBP by DV01 percent share by month.
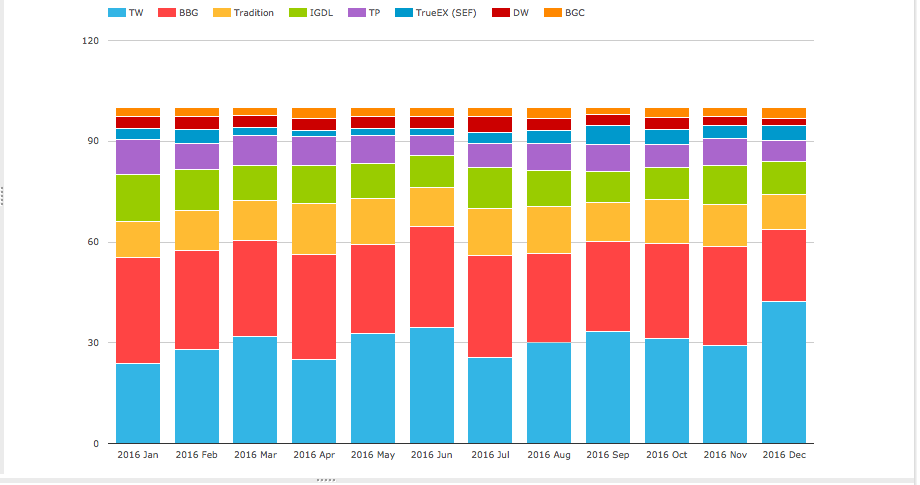
Showing that:
- Tradeweb has the largest share at 31%
- Dec 2016 share was particularly high (See SEF Compression in December Swaps review)
- Tradeweb + Dealerweb together would be 34.6%
- Bloomberg is next with 28%
- Tradition with 12%
- ICAP 11% and Tullets 8%, together would be 18.6%
- TrueEx 3.5%
- Dealerweb 3.4% and BGC 2.7%
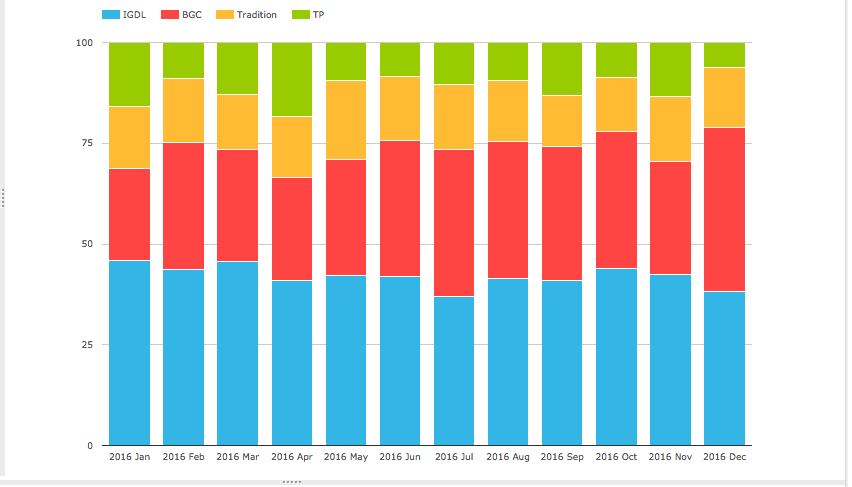
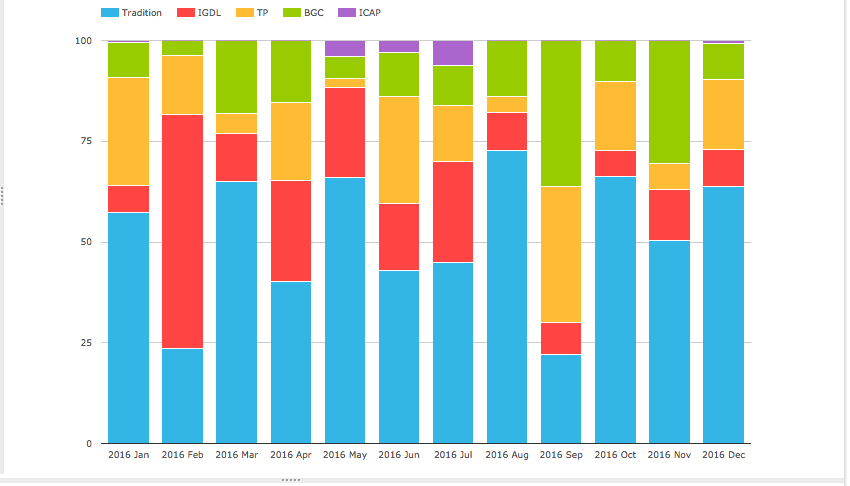
OIS Swaps in USD, EUR, GBP by DV01 percent share by month for the D2D SEFs.
Showing:
- BGC the highest at 30.8%
- Tullet 30.2%, IGDL 28.4%, together 58.6%
- Tradition 10.6%
Basis (Single) Currency Swaps in USD, EUR, GBP by DV01 percent share by month.
Showing:
- Tullet with 48.5%
- IGDL/ICAP with 28%
- Together these would be 76.5%!
- BGC with 13.4%
- Tradition with 9.1%
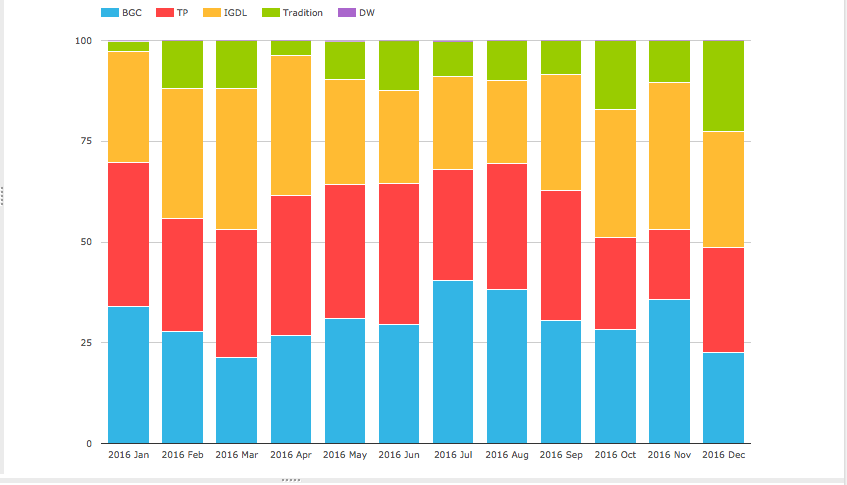
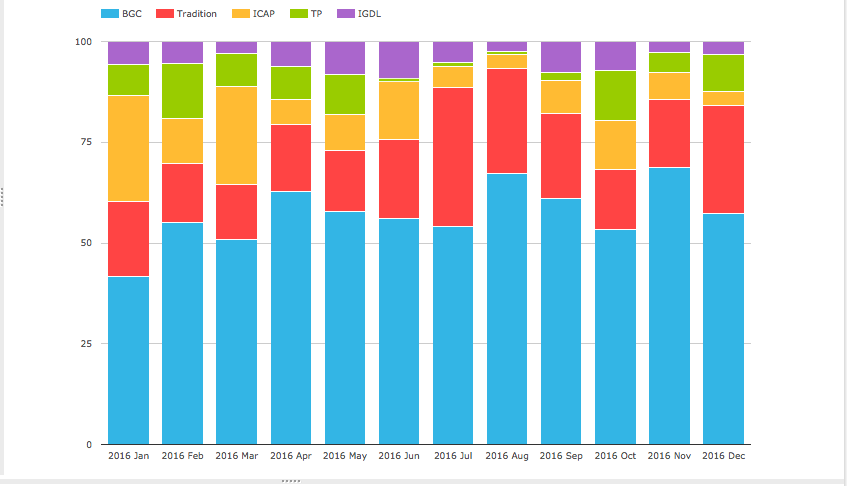
Swaptions in USD, EUR, GBP by Gross Notional percent share by month.
Showing:
- IGDL with 42%
- BGC with 31.4%
- Tradition with 15.3%
- Tullet with 11.3%
- IGDL + Tullet would be 53.3%
Basis Cross Currency Swaps in all currency pairs by Gross Notional percent share by month.
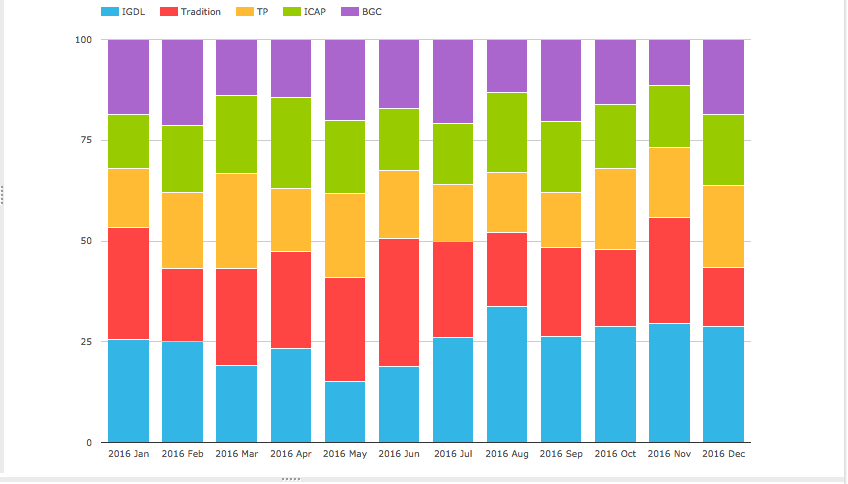
Showing:
- IGDL with 24.7% and ICAP with 17.2%, together 41.9%
- Tradition with 23.3%
- Tullet with 23.3%
- IGDL+ICAP+Tullet with 65.2%
- BGC with 17.2%
CapsFloors in all currencies by Gross Notional percent share by month.
Showing:
- Tradition with 51.8%
- IGDL + ICAP with 18.4%
- Tullet with 15.4%
- IGDL + ICAP + Tullet with 33.8%
- BGC with 14.4%
- A lot of variability month to month
Inflation Swaps in all currencies by Gross Notional percent share by month.
Showing:
- BGC with 57.5%
- Tradition with 19.6%
- ICAP + IGDL with 16.5%
- Tullet with 6.4%
Thats all the products in our first two IRD charts above.
One final chart, CME-LCH USD Switch trades by DV01 percent share by month.
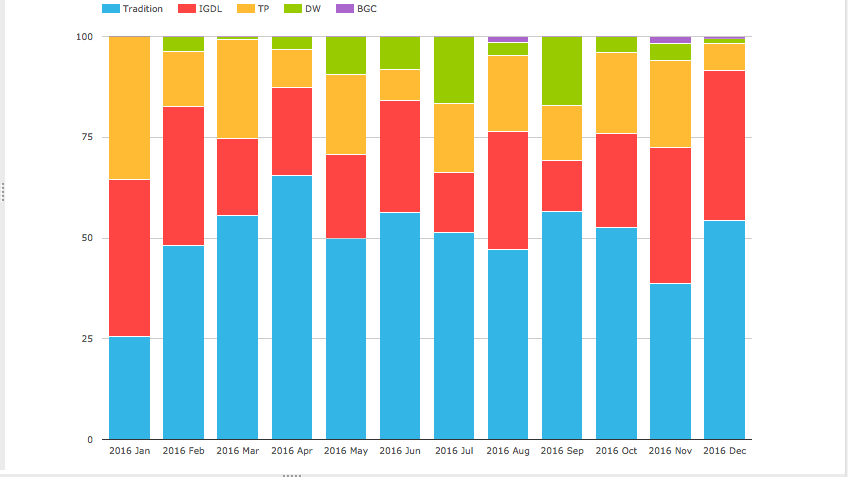
Showing:
- Tradition with 49.6%
- IGDL with 27%
- Tullet with 17.5%
- IGDL + Tullet with 44.5%
- DW with 5.6%
The End
Thats it, only 19 charts to summarise SEFs in 2016.
I hope you found ones useful to your interest.
If not using SEFView you can create your own.
It will be interesting to see how 2017 market share develops.
The merger of ICAP and Tullet is happening.
The market expects further Rate increases in the US.
Protectionist trade policies may start to gain ascendence.
What will these mean for volume and market share?
Only time will tell.
Next month we will publish our monthly Swaps Review.