Welcome back for this weeks edition. This week will be short on commentary but long on data. I usually have the liberty of a handful of hours to collate and prepare comments on Monday, but today I had the pleasure of attending SEFCON IV which took away some of my free time.
THE DATA
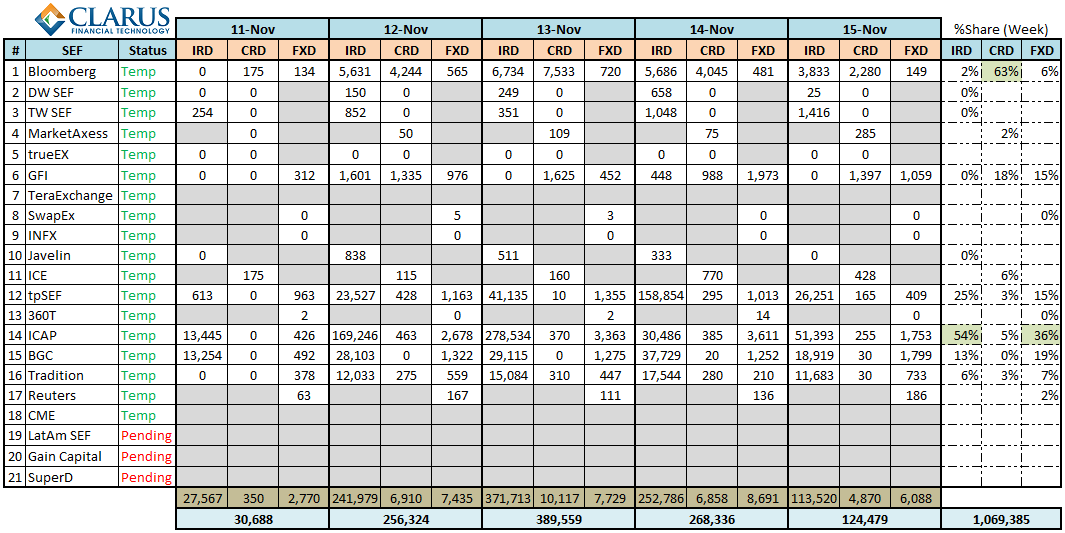
Friday Nov 15th marked the end of the 7th calendar week. We’re starting to pile up some good history now. With the usual caveats, lets dive into the numbers, starting with this weeks headline table.
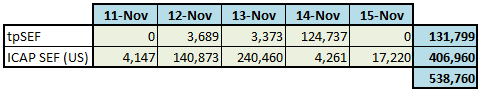
Looking at just FRA activity for the week:
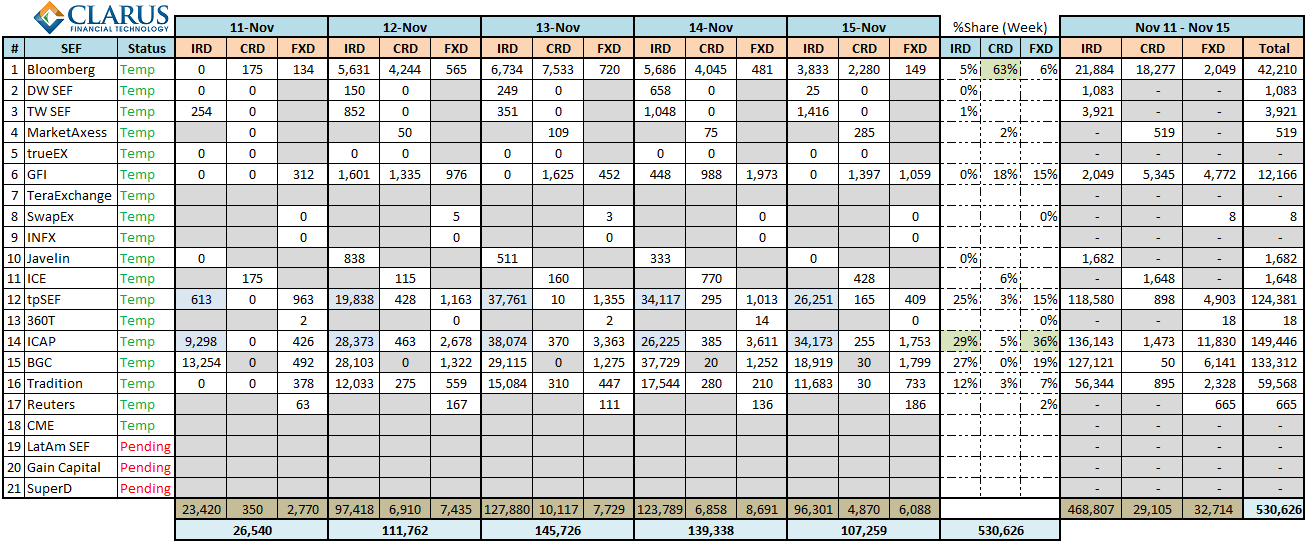
Removing FRA’s leaves us with a normalized table of activity:
NOW LETS PUT THIS INTO PERSPECTIVE
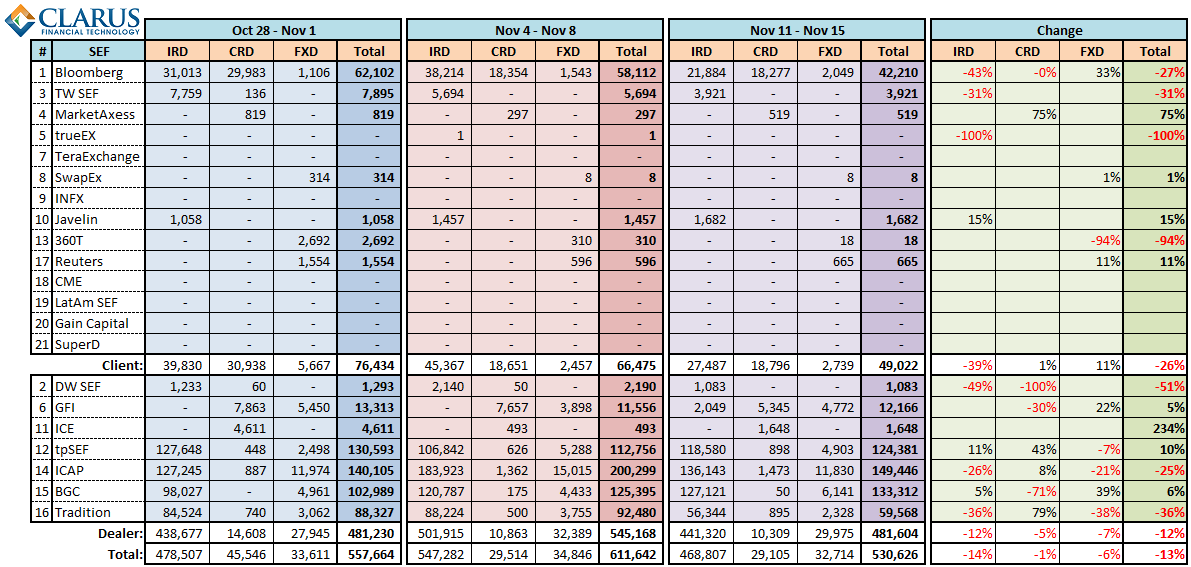
We now have enough data to start analyzing trends, particularly through the Nov 2 no-action relief. Here is the most recent 3 weeks of data, with change calculated for the final two weeks. Like last week, I have separated this into D2D and D2C:
QUICK ANALYSIS
1) D2C client volumes dropped 26%. Is the Nov 2 no-action relief expiration to blame?
2) Monday Nov-11 was a US holiday, so does that explain why we’re off 26%?
3) Mondays are historically low volume. Quickly looking back at last week, Monday Nov-4 only accounted for 12% of the weeks activity, so this does not explain it.
4) D2C Rates activity was off 39%, accounting for much of the change. FX and Credit basically flat.
5) D2D activity off 12%, I would think we can explain this fully by the holiday.
LEAVE YOUR INTERPRETATION
Use the comment section, we want to hear your interpretation of the results.
UPDATE
This weekly issue of SEF updates is not the most current. To see all SEF posts, including the most recent, please click through to the SEF Category.
I can offer insight to the Bloomberg numbers since I was responsible for the west coast and my clients were using the platform way ahead of the official SEF designation, so to be clear, it is no surprise to see the Bloomberg volume above in your figures as it has been this way for the last 2 to 3 years, meaning the electronic volume over the platform, and that isn’t confidential as the group made their volumes known at conferences that were attended by many. I think now with the CFTC clarifying over the last week or so the ‘ALL TO ALL’ concept, Bloomberg has a franchise to protect as the other inter-dealer markets/SEFs will be after that volume with better pricing. Thank you again for publishing all of the volumes in one place, very nice work.
Tod, I am curious about the lack of activity on SwapEx. With State Street’s dominant buy side position as a service provider, one would think that they would capture a bit more interest than what is being shown. It looks like they had some testing done with them at launch, and then very little going on. State Street announced the launch of SwapEx last year in February, which would seem to give them some time to build some base. Do you have any thoughts on this? Thanks, Mike