In this article I look at 2018 Swap Execution Facility (SEF) market share for Credit, Foreign Exchange and Interest Rate Derivative asset classes, in a similar format to my 2017 SEF Market Share Statistics.
A brief summary is that 2018 was a banner year for SEFs, with volumes up in all asset classes and most products and currencies.
Summary:
- CRD
- FXD
- FX NDF and FX Options
- NDF volumes up 23% and FXO up 54%
- In NDF BRL is by far the largest currency
- FX NDF, D2D is led by TP with 46% share
- FX NDF D2C is led by Reuters with 50%
- In FXO, EUR-USD is by far the largest pair
- GFI and BGC the largest in EUR-USD and GBP-USD
- Tradition the largest in USD-JPY and USD-CAD
- IRD
- Vanilla IRS volumes in major currencies are up 36%
- Tradeweb the largest with 38%, ahead of Bloomberg with 30%
- D2C SEFs increasing their share to 73.5% from 65%
- OIS volumes only up 7.5%
- Basis Swap volumes up 90%, with TP the largest at 53%
- Swaption volumes up 35%
- BGC on top from IGDL, reversing their 2017 positions
- Cross Currency Swaps, BGC and IGDL close
- CapFloors, Tradition the largest with 55%
Clarus SEFView has daily volume data published by each SEF, which is filtered, normalised and aggregated to allow meaningful comparison of market share statistics.
Onto the charts, data and details.
CRD Volumes and Share
Starting with Credit volumes by currency for each month.
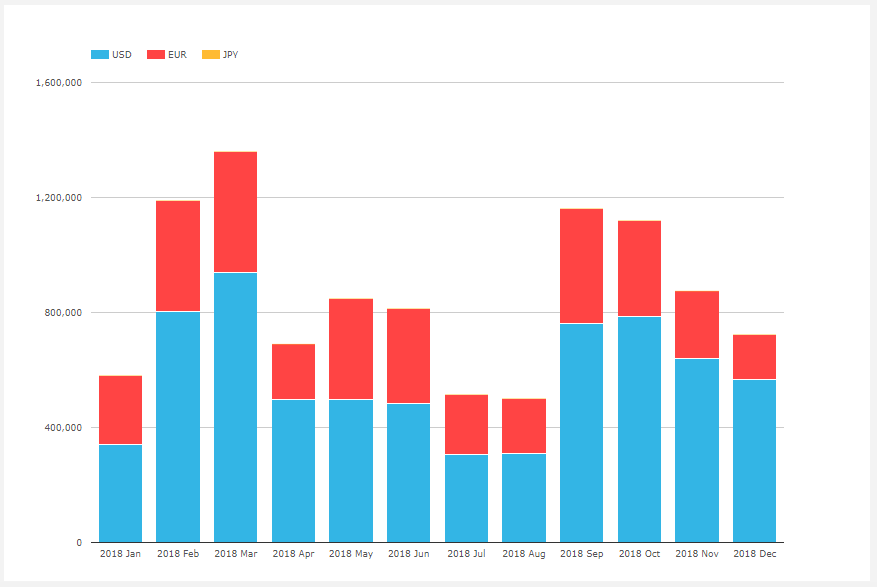
- USD is the largest (CDX.NA.IG, CDX.NA.HY, CDX.EM)
- EUR is next ( iTraxxEurope and iTraxxEuropeCrossOver)
- (Recall CFTC SEF rules govern CDS Index not Single-name, so the latter are not included)
- USD volume much higher in 2018 at $6.9 trillion, compared to $4.3 trillion in 2017, an increase of 60%
- EUR volume also higher, $3.45 trillion vs $2.6 trillion, up 33%
- Feb, Mar (rolls), Sep (rolls), Oct were the highest volume months
- Jan, Jul and Aug with subdued volumes
Next lets look at a chart of market share in percent by gross notional for SEFs by month
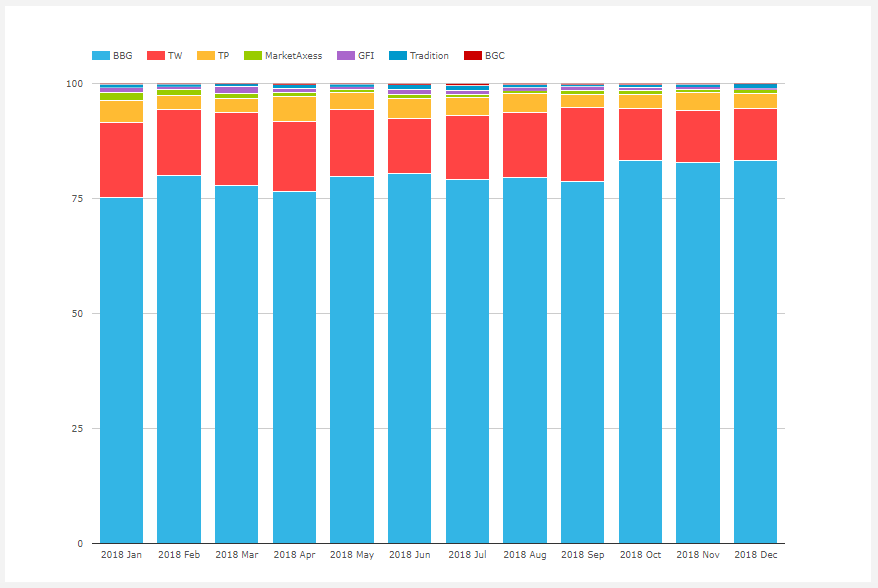
- Bloomberg with a commanding share of 80% for the year, up from 77% and 74% in prior years
- Tradeweb is next with 14%, the same as in 2017
- Tullet with 3.6% is down from 4.5% in 2017
- GFI with 0.9% is down from 1.9% and 2.6% in prior years
- MarketAxess with 0.9% is down from 1.3% and 1.8%
- Tradition with 0.7% is up from 0.5% in 2017
Next a chart of Currency and Product Type for 2018.
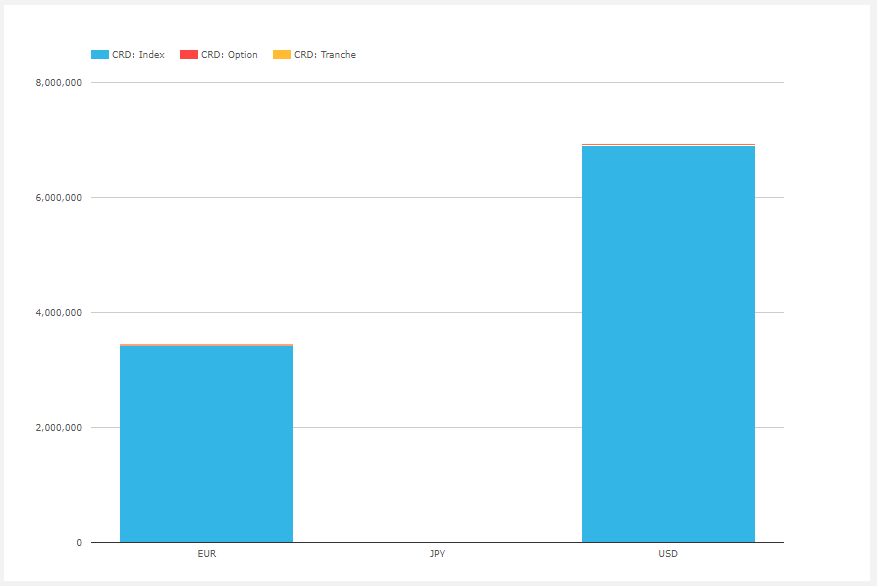
- EUR Index volume is $3.4 trillion, Option is $24 billion and Tranche is $360 million, compared to $2.6 trillion, $35 billion and $800 million respectively in 2017
- USD Index volume is $6.9 trillion, Option is $33 billion and Tranche 400 million, compared to $4.3 trillion, $47 billion and $1.4 billion in 2017
Index volumes in USD indices much higher than 2017, while Options are lower.
And finally for Credit a chart of volume by Index for the current on the run series.
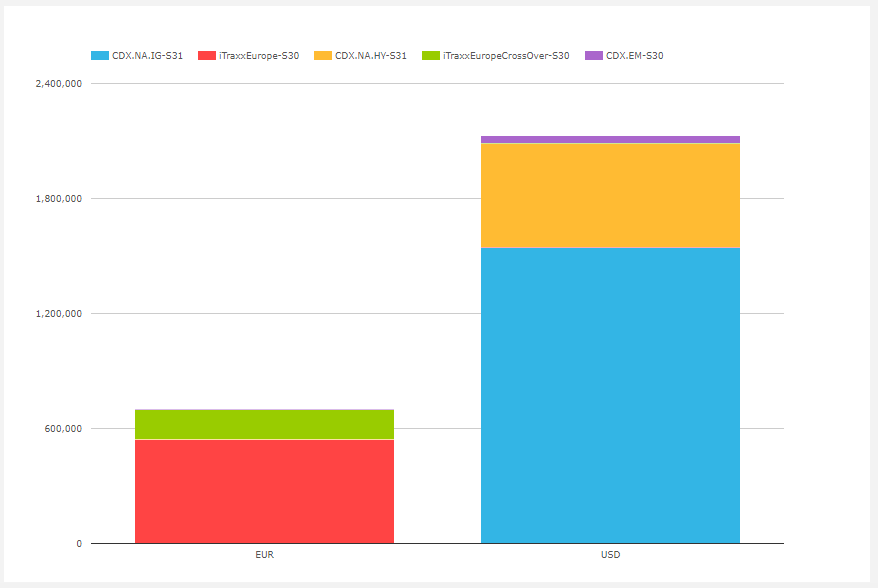
- CDX NA IG S31 is by far the largest with $1.55 trillion, up from $730 billion in 2017, an increase of 112%
- iTraxx Europe S30 next with $545 billion up from $420 billion in 2017
- CDX NA HY S31 with $540 billion up from $275 billion, an increase of 96%
- iTraxx EuropeCrossOver S30 with $154 billion up from $110 billion
- CDX EM S30 with $42 billion up from $35 billion
That’s it for CRD.
FXD Volumes and Share
Lets now look at FXD volumes.
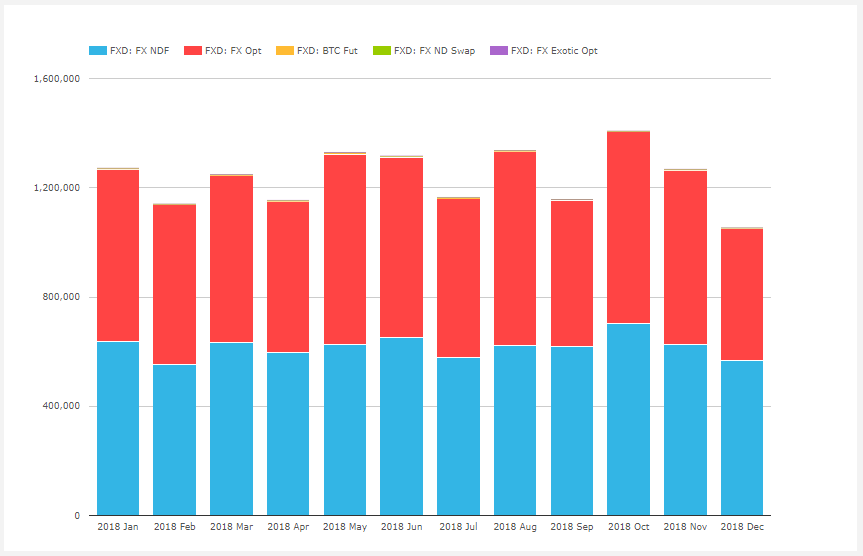
- Non-Deliverable Forwards (NDF) is the largest product with $7.4 trillion, up from $6.0 trillion in 2017, an increase of 23%
- FX Options (FXO) also with $7.4 trillion, far higher than the $4.8 trillion in 2017, an increase of 54%
- Others are comparatively insignificant e.g. Bitcoin Futures $42 billion
- Oct 2018 was the highest volume month (in 2017 it was Nov)
Next FX NDF volumes by currency pair.
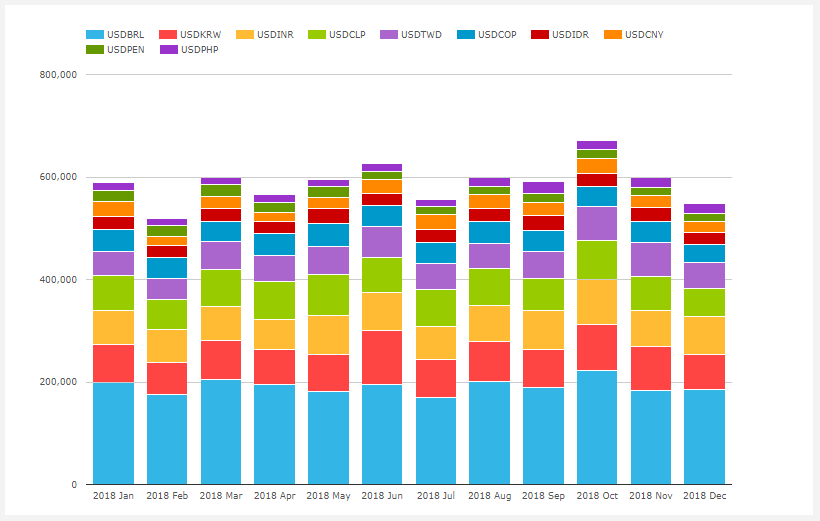
- The largest 10 currencies (in size order) BRL, KRW, INR, CLP, TWD, COP, IDR, CNY, PEN, PHP
- BRL by far the largest with $2.3 trillion and higher than $2 trillion in 2017
- KRW next with $930 billion, far higher than the $640 billion in 2017
- INR with $850 billion and CLP with $820 billion
Also of interest and not shown in the chart is that in 2018, there was $6.5 billion of FX NDF in the 5 largest deliverable currency pairs, AUD, CAD, EUR, GBP & JPY, primarily on GFI and Reuters. This is most likely driven by Uncleared Margin Rules (UMR) to delta-hedge FX Options which need to be margined under UMR and as FX Forwards are excluded from UMR, NDFs must be used.
NDF volume in the 10 largest currencies is dominated by D2D SEFs with 92% vs 8% for D2C, which compares to 94% vs 6% in 2017.
So lets first chart NDF percent market share for D2D SEFs by month.
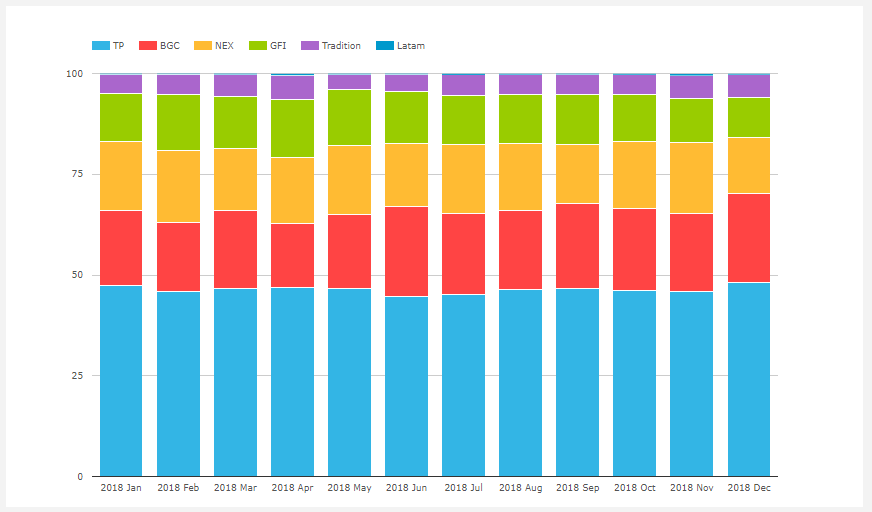
- TP the largest SEF with 46.4% share in 2018
- BGC with 19.6%, up from 14% in 2017
- NEX with 16.3%, no figures in full year 2017
- GFI with 12.4%, similar to the 13% in 2017
- Tradition with 5%, same as 2017
- Latam with 0.3%, same as 2017
(In SEFView, I could produce separate market share for LatAm and Asian currency pairs, but that would be more charts in this blog, so will leave that to those of you interested to do yourself).
Next the D2C SEFs.
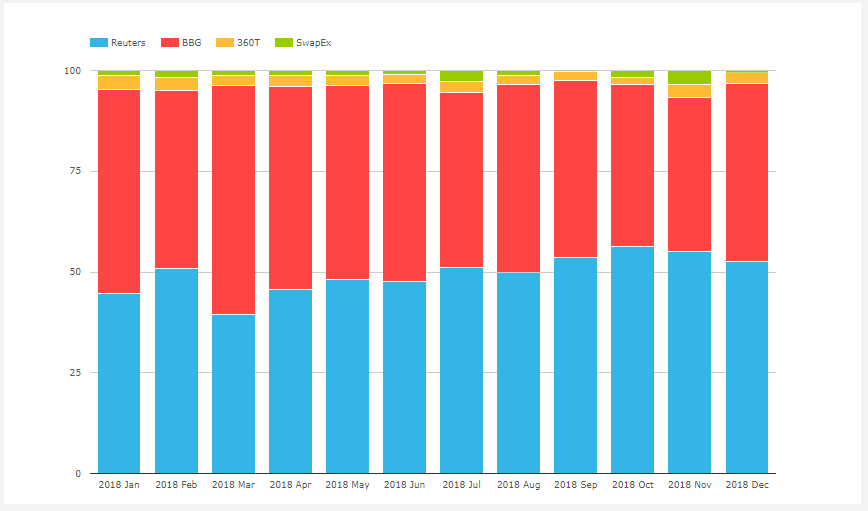
- Reuters the largest with 49.5%, slightly down from 51% in 2017
- Bloomberg next with 46.5%, up from 45% in 2017
- 360T with 2.6%, down from 4%
- SwapEx with 1.4% (mostly in KRW)
Next FX Option volumes by currency pair.
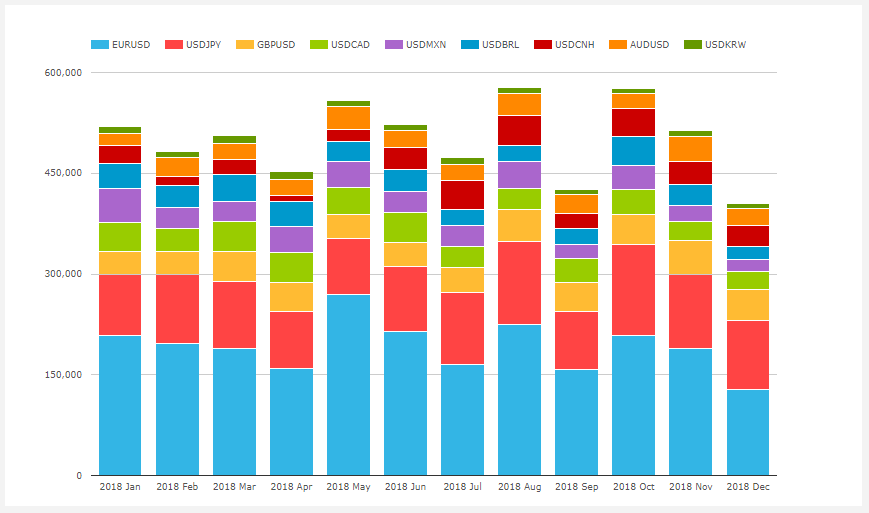
- The largest 10 currency pairs vs USD (in order) EUR, JPY, GBP, CAD, MXN, BRL, CNH, AUD, KRW
- EUR-USD by far the largest with $2.3 trillion
- USD-JPY next with $1.2 trillion
FXO volumes are dominated by D2D SEFs with 99.6% vs 0.4% for D2C.
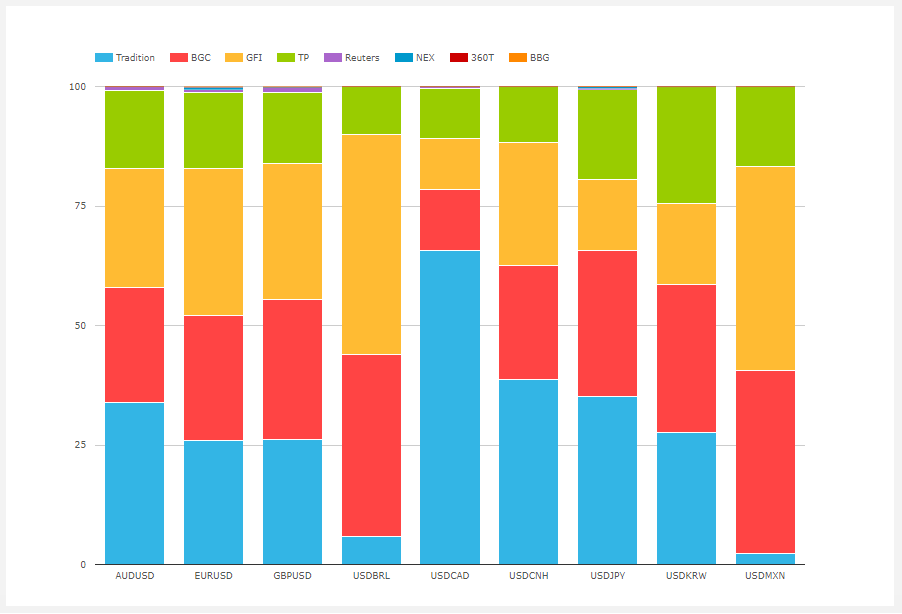
- EUR-USD with GFI 30.7%, BGC 26.1%, Tradition 26%, TP 15.8%
- USD-JPY with Tradition 35%, BGC 35.5%, TP 18.9%, GFI 14.8%
- GBP-USD, GFI and BGC the largest
- USD-CAD, Tradition the largest
Thats it for FXD.
IRD Volumes and Share
Lets now turn to IRD, starting with Vanilla Interest Rate Swap volumes.
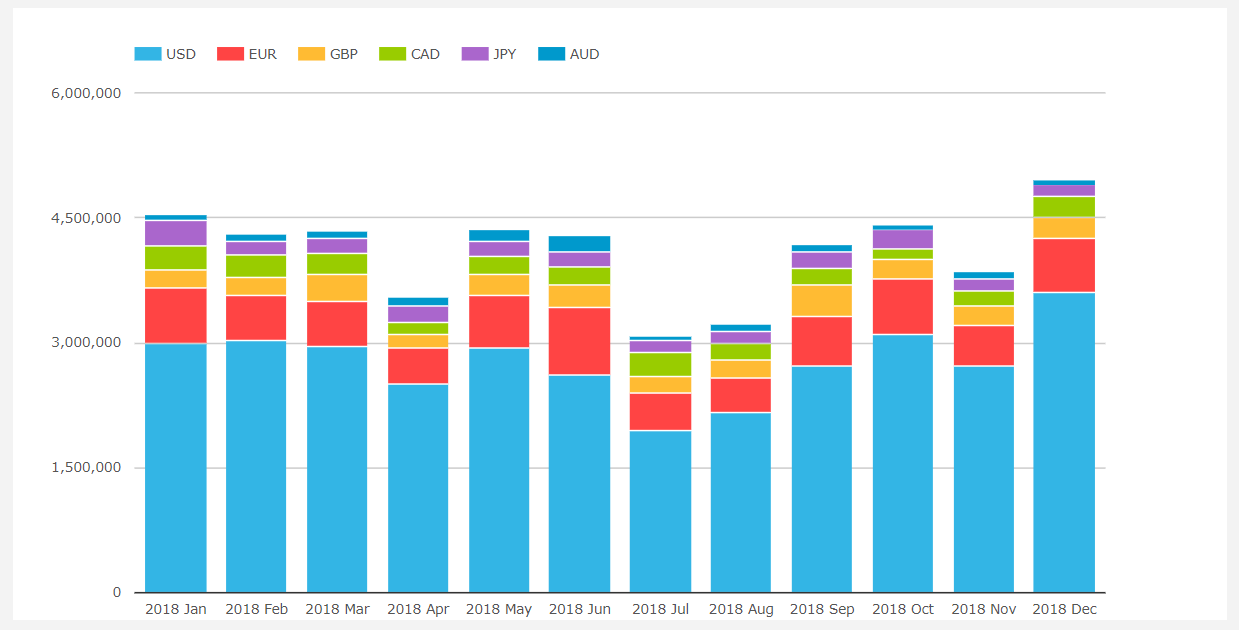
- USD by far the largest with $33.3 trillion in 2018, up 30% from $25.7 trillion in 2017
- EUR next with $6.9 trillion, up 86% from $3.7 trillion
- GBP with $3 trillion, up 114% from $1.4 trillion
- CAD with $2.6 trillion, up 44% from $1.8 trillion
- JPY with $2.2 trillion, down from $2.4 trillion
- AUD with $1.1 trillion, up from $860 billion
- An overall $49 trillion, up 36% from $36 trillion in 2017
- December the highest month with $ 5 trillion
- July the lowest month with $ 3 trillion
Note, we provide a free Daily Briefing for USD Swaps, you can sign-up here.
Next Overnight Index Swaps.
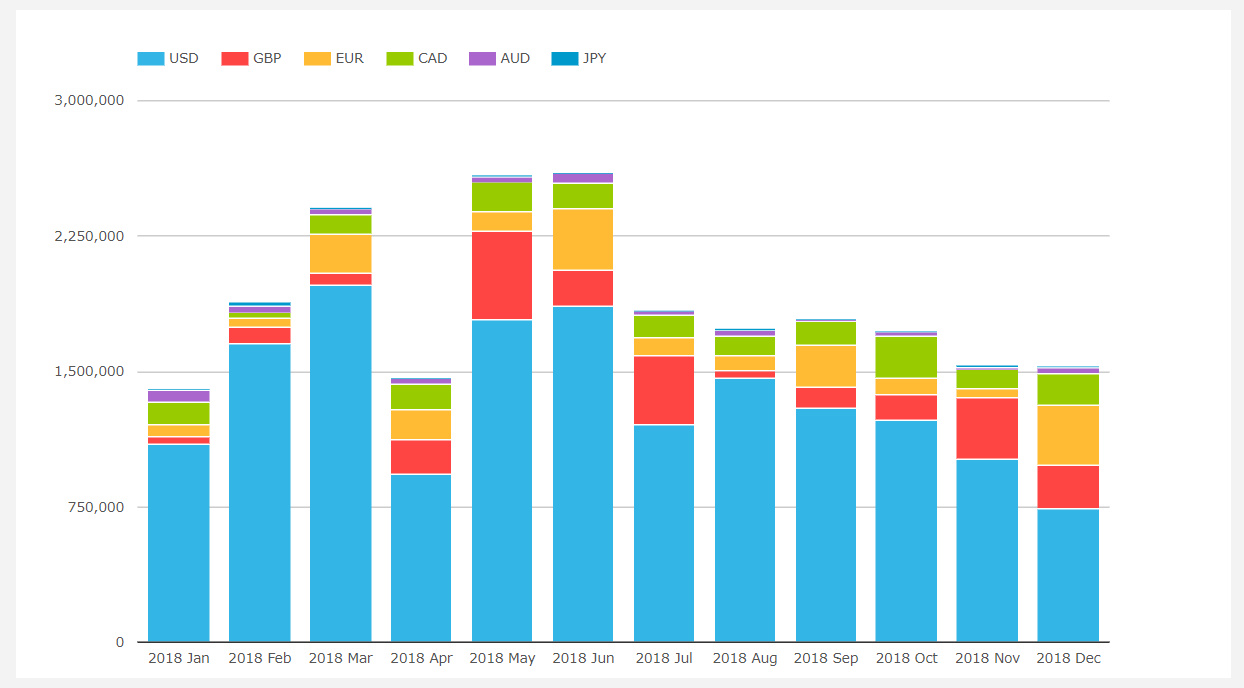
- USD by far the largest with $16.3 trillion in 2018, down from $17 trillion in 2017
- GBP next with $2.3 trillion, up from $870 billion
- EUR with $1.8 trillion, up from $1.5 trillion
- CAD with $1.6 trillion, up from $900 billion
- AUD with $390 billion, up from $600 billion
- An overall $22.5 trillion, up from $20.9 trillion in 2017, an increase of 7.5%
- June the highest month with $ 2.6 trillion
- April the lowest month with $ 1.5 trillion
And other IRD product types.
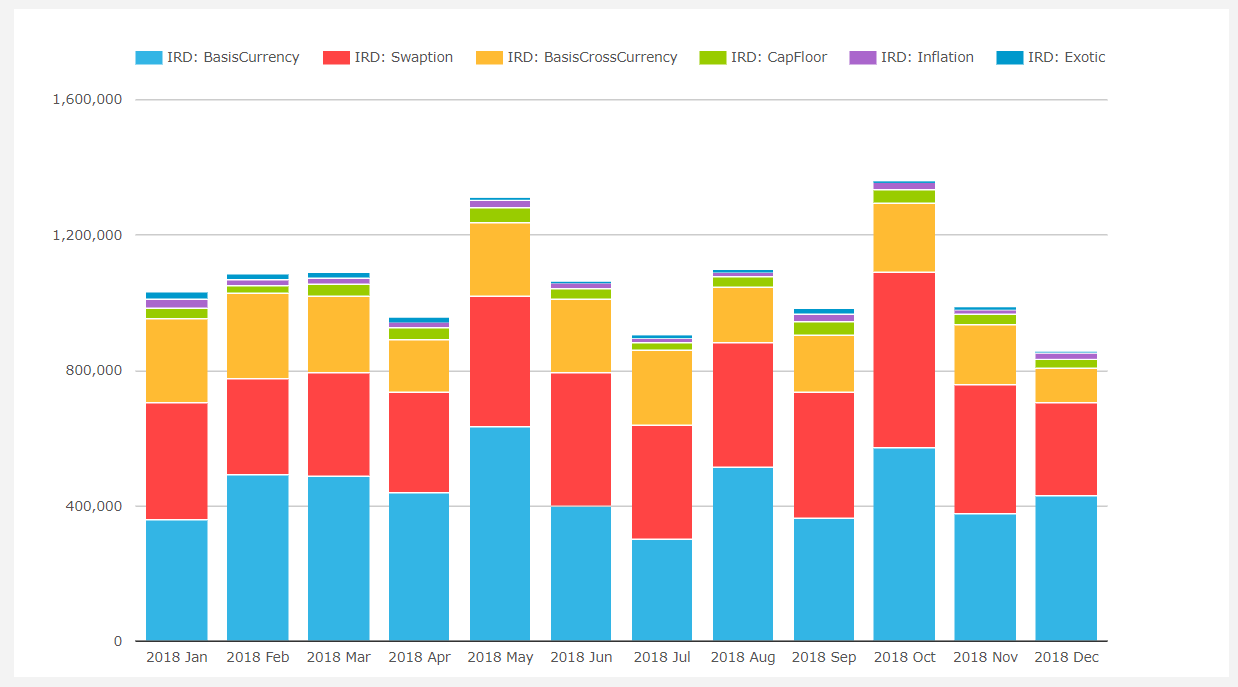
- These products averaged $1.06 trillion a month, up from $740 billion and $650 billion in prior years
- Basis (Single) Currency are the highest, averaging $450 a month, massively up 90% from $235 billion a month in 2017 and 2016
- Swaptions $350 billion a month, up 35% from $260 billion in 2017 and $205 billion per month in 2016
- Basis Cross Currency average $196 billion a month, same as 2017
- CapFloors average $32 billion a month, similar to 2017
- Inflation Swaps average $19 billion a month, down from $22 billion a month in 2017
- Exotics average $12 billion a month, significantly up from $3 billion a month
Next market share for selected product types.
Vanilla IRS
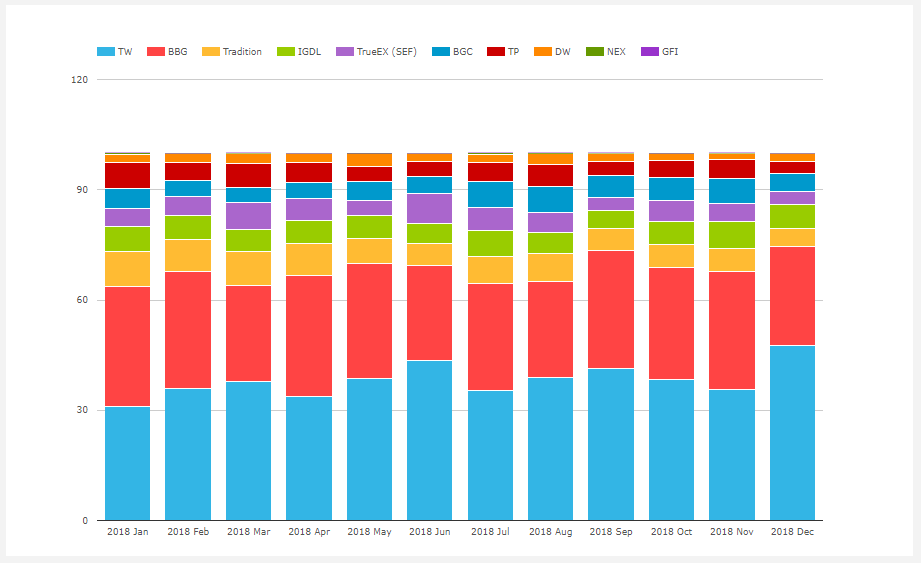
- Tradeweb with 38.3% pulling away from Bloomberg with 29.8%
- (In 2017 these were 31.4% to 30.4% respectively)
- TrueEx the other D2C with 5.4% (up from its 3.2% in 2017).
- These three D2C SEFs with 73.5% volume, up from 65% in 2017
- While the D2D SEFs have 26.5% of the volume
- (Note D2C volume is not all price forming, given their substantial portfolio maintenance activity also generates new trade volume)
- Tradition the top D2D SEF with 7.3%
- IGDL next with 6.3%
- BGC with 5.4%, TP with 5% and DW with 2.4%
Basis (Single) Currency Swaps
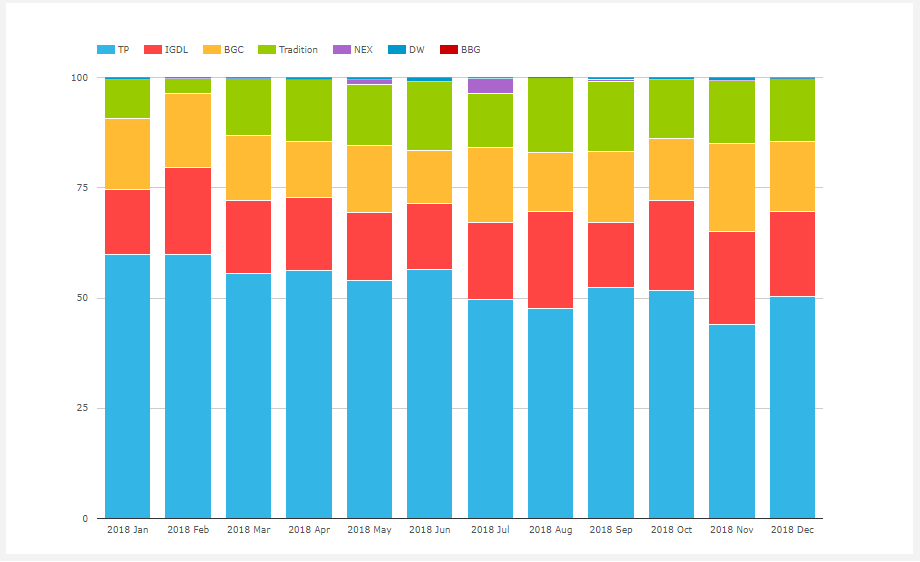
- TP with 53.3%, slightly up from 52% in 2017
- IGDL with 17.8%, down from 21%
- BGC with 15.3%, up from 13.7%
- Tradition with 12.8%, significantly up from 7.7%
- Dealerweb with 0.4%, down from 0.7%
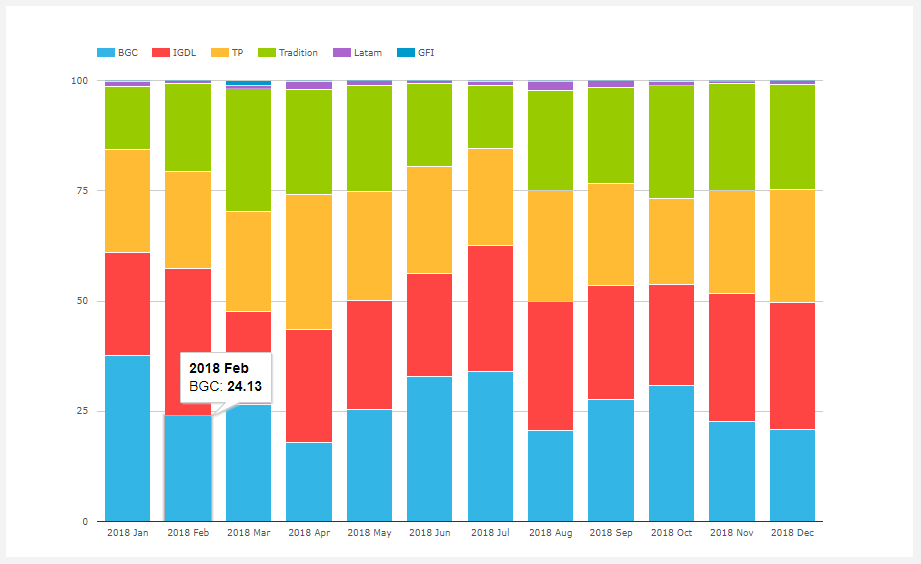
Swaptions
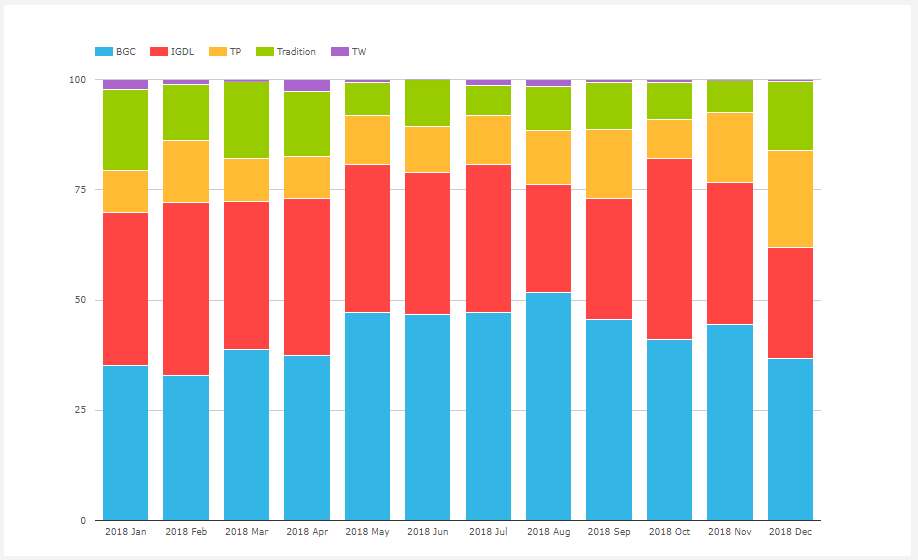
- BGC the largest with 44.5%, up from 32% in 2017
- IGDL next with 32%, down from 44% and 42% in prior years
- TP with 15.9%, up from 11%
- Tradition with 7.3%, down from 12% and 15% in prior years
- Tradeweb with 0.3%
Basis Cross Currency Swaps
- BGC the largest with 27.6%, up from 22%
- IGDL next with 26.1%, up from 22%
- Tullet with 23.6%, up from 20%
- Tradition with 21, similar to 20% in 2017
- ICAP was 14% in 2017, so it’s share seems to have been divided up between BGC, IGDL and Tullet
- Latam with 1.1%, up from 0.5%
CapsFloors
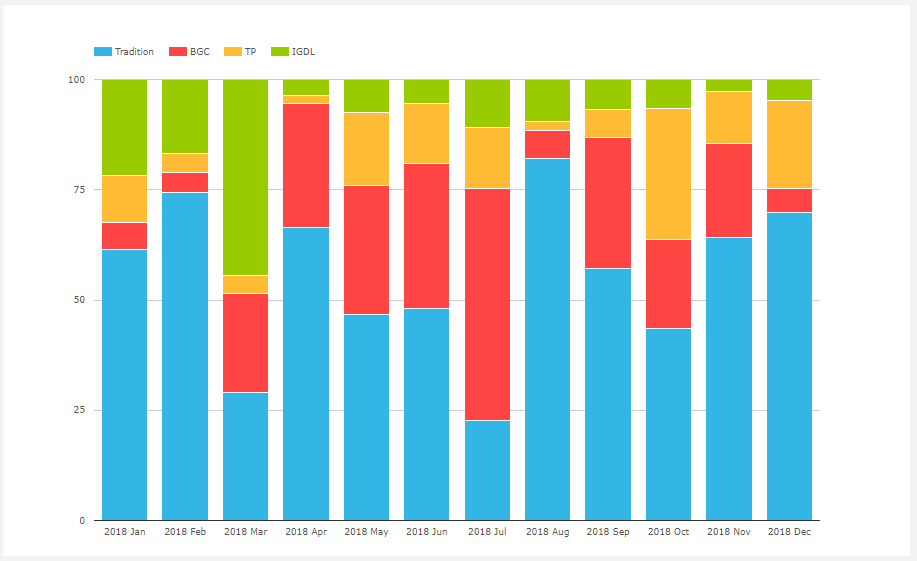
- Tradition with 55%, up from 45%
- BGC with 21.8%, up from 21%
- IGDL with 11.4%, down from 17%
- Tullet with 11.7%, down from 16%
- A lot of variability month to month
- Not surprising given the small number of transactions in large notional
That’s it for IRD.
The End
That’s it, 18 charts to summarise SEF statistics in 2018.
There are many more I could have created, given the product/ccy/sef dimensions available.
I hope you found ones useful to your interest.
If not, using SEFView you can create your own.
Please contact us for a subscription if you don’t have one.
It will be interesting to see how 2019 market share develops.
The US is poised on will the Fed continue or stop raising rates
Bond and equity markets are poised on bear or bull.
What will these mean for volume and market share?
Only time will tell.
We publish regular Swaps Review articles.
Under Vanilla IRS you only show major currencies. Can you post additional Vanilla IRS categories such as non-majors or overall market?
Thank you for your comment.
I will look to do this in the near future, most likely in a new blog.
I wonder how much of the increase is just a general volume increase as opposed to volume shifting from off to on SEF. Is there a quick way to find out in SDRview?
Doing an aggregate of 2018 and 2017 separately on SDRView tells me on SEF increased ahead of OFF SEF – see below. This is mainly driven by a shift of cleared trades from off to on SEF.
Cleared YoY
$bn %
Total 13,699.11 25%
OFF 2,784.27 11%
ON 10,914.84 36%
2018
Total 69,324.06
OFF 28,059.97
ON 41,264.09
2017
Total 55,624.95
OFF 25,275.70
ON 30,349.25