In this article I look at 2017 Swap Execution Facility (SEF) market share for Credit, Foreign Exchange and Interest Rate Derivative asset classes, in a similar format to my 2016 SEF Market Share Statistics.
Clarus SEFView has daily volume data published by each SEF, which is filtered, normalised and aggregated to allow meaningful comparison of market share statistics.
Summary:
- CRD
- FXD
- IRD
- Vanilla IRS with $3 trillion monthly gross notional in 6 major ccys
- Other IRD products with $740 billion a month
- Vanilla IRS market share led by Tradeweb + Dealerweb
- OIS Swaps D2C by Tradeweb with TrueEx showing a huge increase
- TP-ICAP (TP, ICAP, IGDL) starting to dominate many products
- OIS Swaps, Basis Single Ccy, Basis Cross Currency, Swaptions
- CapFloors and CME–LCH Basis Swaps led by Tradition
- Inflation led by BGC
Onto the charts, data and details.
CRD Volumes and Share
Starting with Credit volumes by currency for each month.
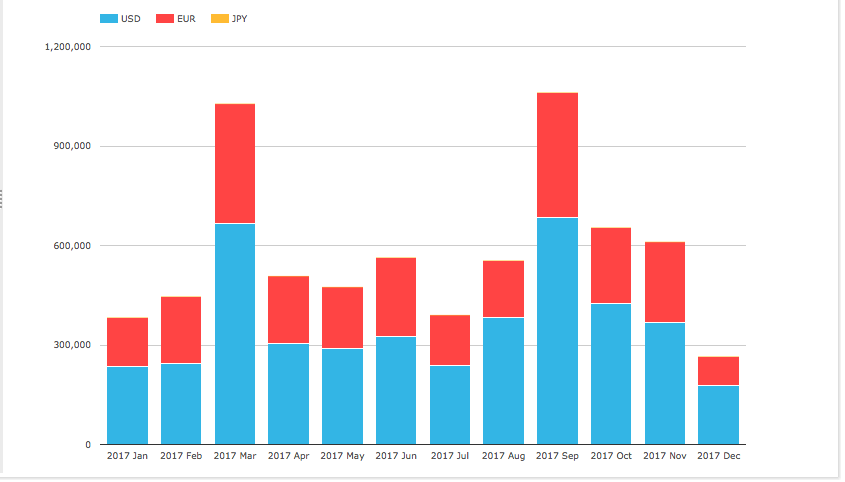
- USD is the largest (CDX.NA.IG, CDX.NA.HY, CDX.EM)
- EUR is next ( iTraxxEurope and iTraxxEuropeCrossOver)
- (Recall CFTC SEF rules govern CDS Index not Single-name, so the latter are not included)
- USD is 63% and EUR 37% of the overall volume, with JPY < 0.01%
- March and September were by far the highest volume driven by series rolls
- Other months with subdued volume, particularly Jan, Jul and Dec.
Next lets look at a chart of market share in percent by gross notional for SEFs by month.
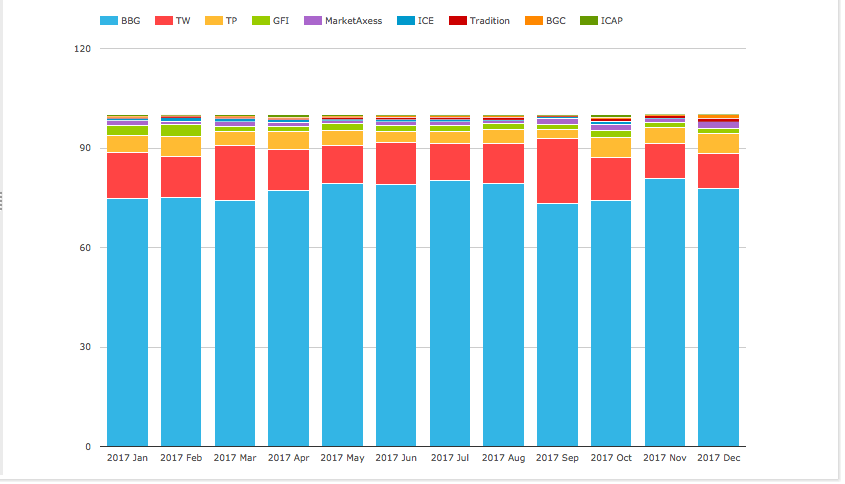
Showing that:
- Bloomberg with a commanding share of 77% for the year (2016 was 74%)
- Tradeweb is next with 14% (2016 was 13%)
- In March and September Tradeweb was slightly higher at 16% and 20%
- Most likely due to capturing proportionally more share in series roll activity
- Tullet with 4.5% and ICAP 0.4%, which started consolidated reporting in November
- GFI with 1.9% (2016 was 2.6%)
- MarketAxess with 1.3% (2016 with 1.8%)
- ICE with 0.6% for the year, down from 3% in 2016 and no volume in Dec
Next a chart of Currency and Product Type for 2017.

- EUR Index volume is $2.6 trillion, Option is $35 billion and Tranche is $800 million gross notional
- USD Index volume is $4.3 trillion, Option is $47 billion and Tranche is $1.4 billion gross notional
- JPY Index volume with 400 million
Index volumes are similar to 2016, but Option and Tranche both significantly down.
And finally for Credit a chart of volume by Index for the current on the run series.
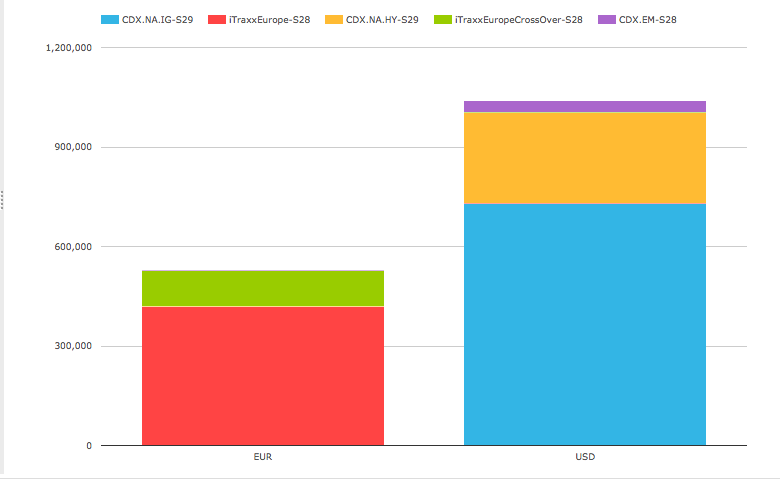
- CDX NA IG S29 is by far the largest with $730 billion
- iTraxx Europe S28 next with $420 billion
- CDX NA HY S29 with $275 billion
- iTraxx EuropeCrossOver S28 with $110 billion
- CDX EM S28 with $35 billion
Thats it for CRD.
FXD Volumes and Share
Lets now look at FXD volumes.
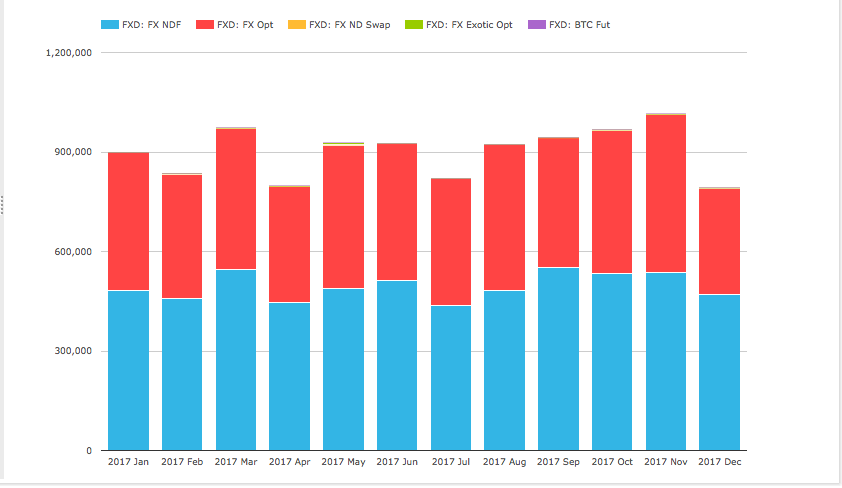
Showing that in 2017:
- Non-Deliverable Forwards (NDF) is the largest product with $6.0 trillion
- FX Options (FXO) next with $4.8 trillion
- Others are comparatively insignificant
- November 2017 was the highest volume month (same as 2016)
Next FX NDF volumes by currency pair.
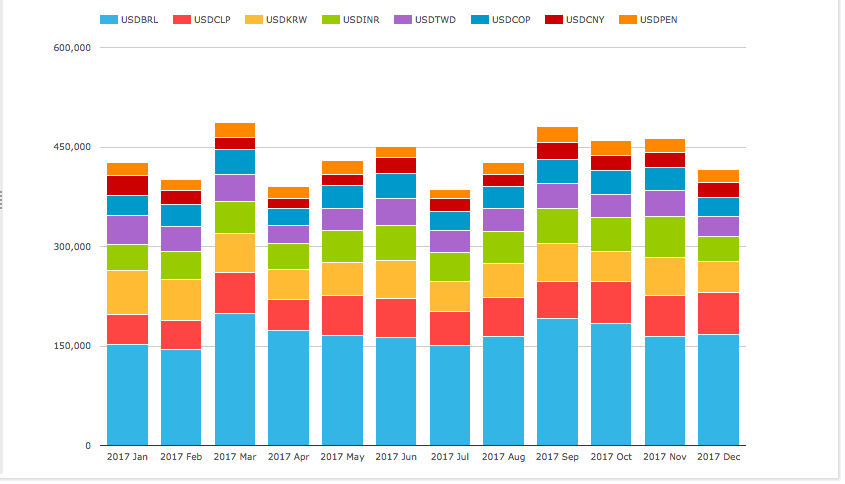
- The largest 8 currencies (in size order) BRL, CLP, KRW, INR, TWD, COP, CNY, PEN
- BRL by far the largest with $2 trillion in 2017
- CLP next with $670 billion
- KRW the largest Asian currency with $640 billion
- March 2017 the highest volume month in 2017
- Pretty consistent month on month volumes
NDF volumes in these currencies are dominated by D2D SEFs with 94% vs 6% for D2C.
So lets first chart NDF percent market share for D2D SEFs by month.
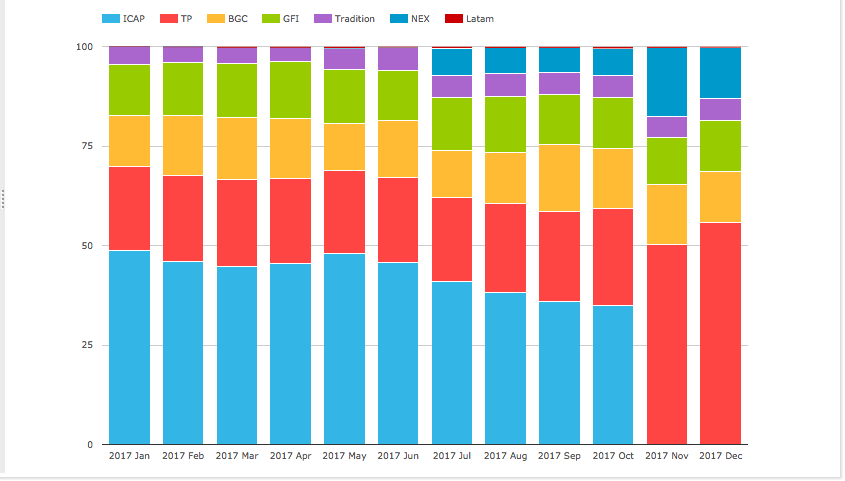
- ICAP the largest SEF (but merged into Tullet from Nov onwards)
- ICAP + Tullet combined with a 63% share in the year
- NEX split out from ICAP with 17% and 13% in Nov and Dec
- BGC and GFI with 14% and 13% respectively
- Tradition with 5%
- Latam with 0.3%
Next the D2C SEFs.
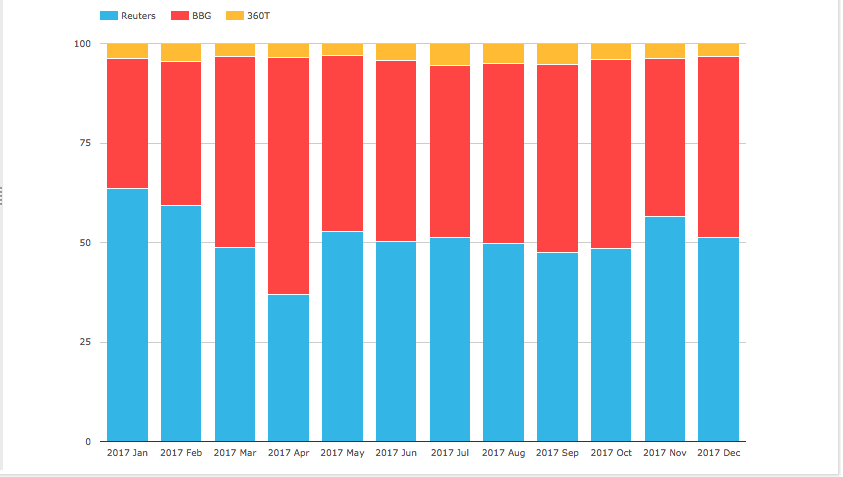
- Reuters the largest with 51% share in the year (2016 was 55%)
- Bloomberg next with 45% (2016 was 41%)
- 360T with 4% (2016 was 3.6%)
FXO volumes are dominated by D2D SEFs with 98.7% vs 1.3% for D2C.
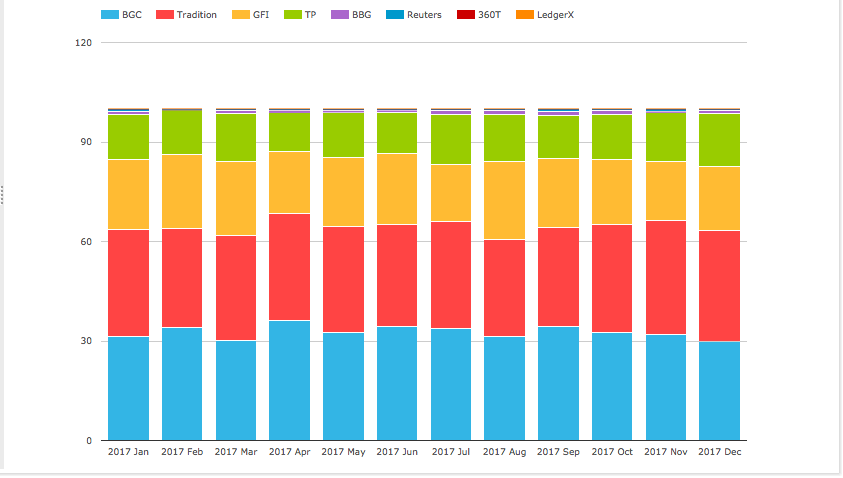
- BGC the largest with 32.7% share in the year (2016 was 35.3%)
- Tradition next with 31.7% (2016 was 29.7%)
- GFI with 20.5% (2016 was 19.7%)
- BGC + GFI with 53.2%
- Tullet with 13.8% (2016 was 13.7%)
- Remaining SEFs with less than 1%
- Low month on month variability in market share
Thats it for FXD.
IRD Volumes and Share
Lets now turn to IRD, starting with Vanilla Interest Rate Swap volumes.
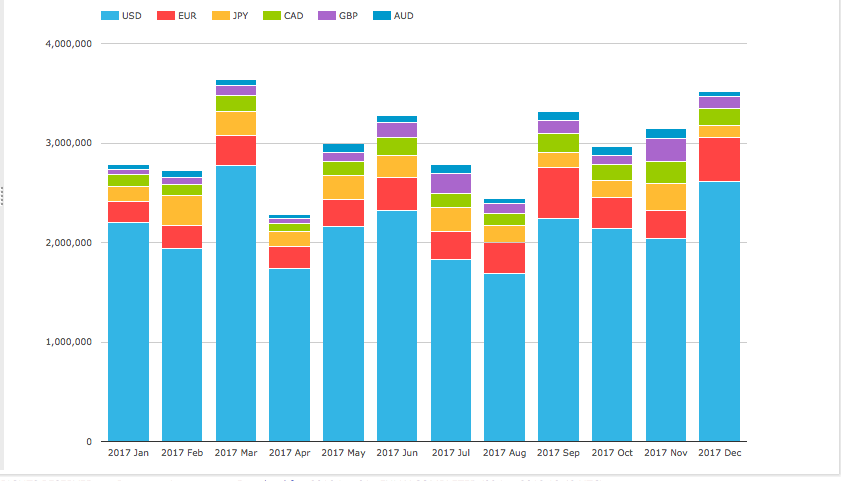
- USD by far the largest with $25.7 trillion in the year
- EUR next with $3.7 trillion
- JPY with $2.4 trillion
- CAD, GBP, AUD make up the major currencies
- An overall $36 trillion in these six currencies
- March the largest month with $3.6 trillion
- April the lowest with $2.3 trillion
- Q1 and Q4 with the highest volume
Note, we now provide a free Daily Briefing for USD Swaps, you can sign-up here.
And other IRD product types.
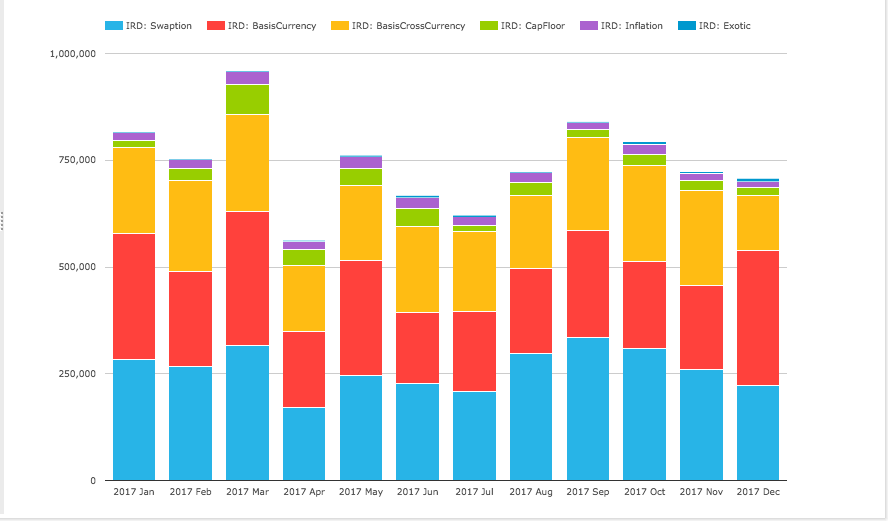
- Cumulatively these products averaged $740 billion a month (2016 was $650 billion)
- Swaptions are the highest at $260 billion a month, up from $205 billion in 2016
- Basis (Single) Currency next, averaging $235 billion a month (same as 2016)
- Basis Cross Currency average $195 billion, up from $170 billion in 2016
- CapFloors average $30 billion, up from $23 billion
- Inflation Swaps average $22 billion a month, similar to 2016
- Exotics average $3 billion a month
Next market share for each product type.
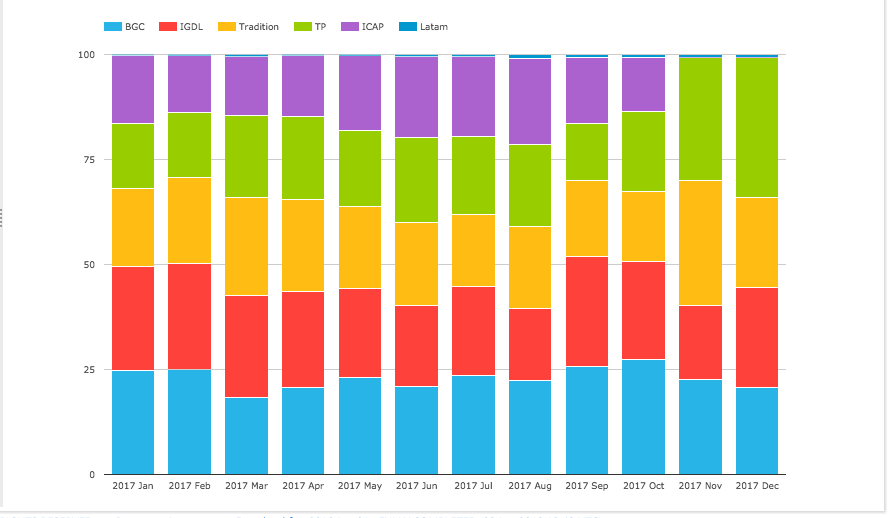
Vanilla IRS
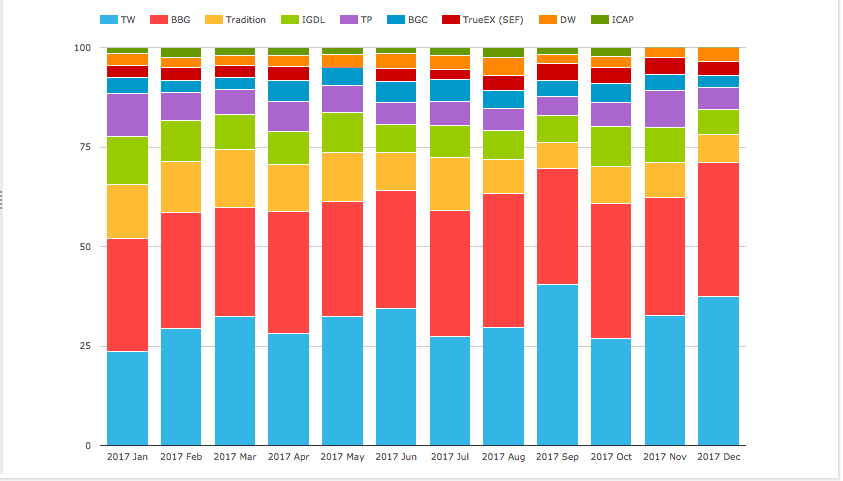
- Tradeweb and Bloomberg vying for top position each month
- Tradeweb with 31.4% just pipping Bloomberg with 30.4%
- Tradeweb with Dealerweb (3.1%) combined is $34.6%
- Tradition is next with 10.6%, though showing a weaker Q4
- IGDL with 8.7%, Tullets 6.7% and ICAP 1.6%
- The combined share of these three is 17%
- BGC with 4.2%
- TrueEx with 3.2%
CME-LCH USD IRS Switch trades
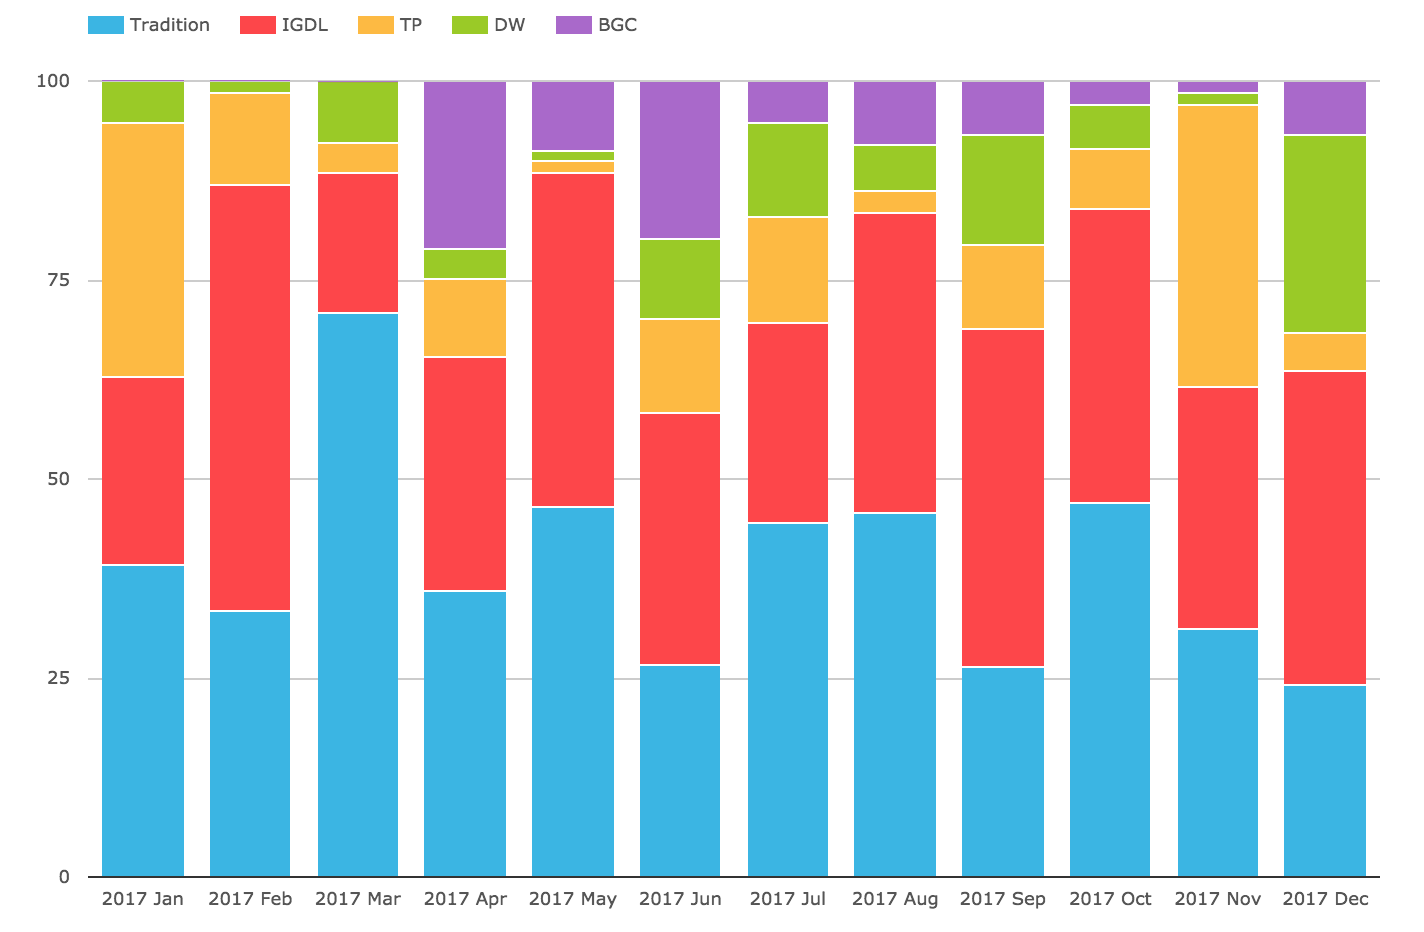
- Tradition in the lead with 41% (2016 was 50%)
- IGDL narrowing the gap with 32%, up from 27% in 2016
- IGDL higher than Tradition in 4 out of the 12 months
- Tullet next with 14%
- Dealerweb 7% and BGC 6%
Overall much lower volume in 2017 than 2016, particularly in Q3.
OIS Swaps – D2D SEFs

- Tullet the largest with 38%, rising from 32% in Q1 to 52% in Q4
- BGC next with 25%
- IGDL with 20%, dropping from 23% in Q1 to 15.5% in Q4
- Tullet, ICAP and IGDL together with 51% share
- Tradition with 13.6%, Q4 well down from Q1
- Dealerweb showing volume in some months
OIS Swaps – D2C SEFs
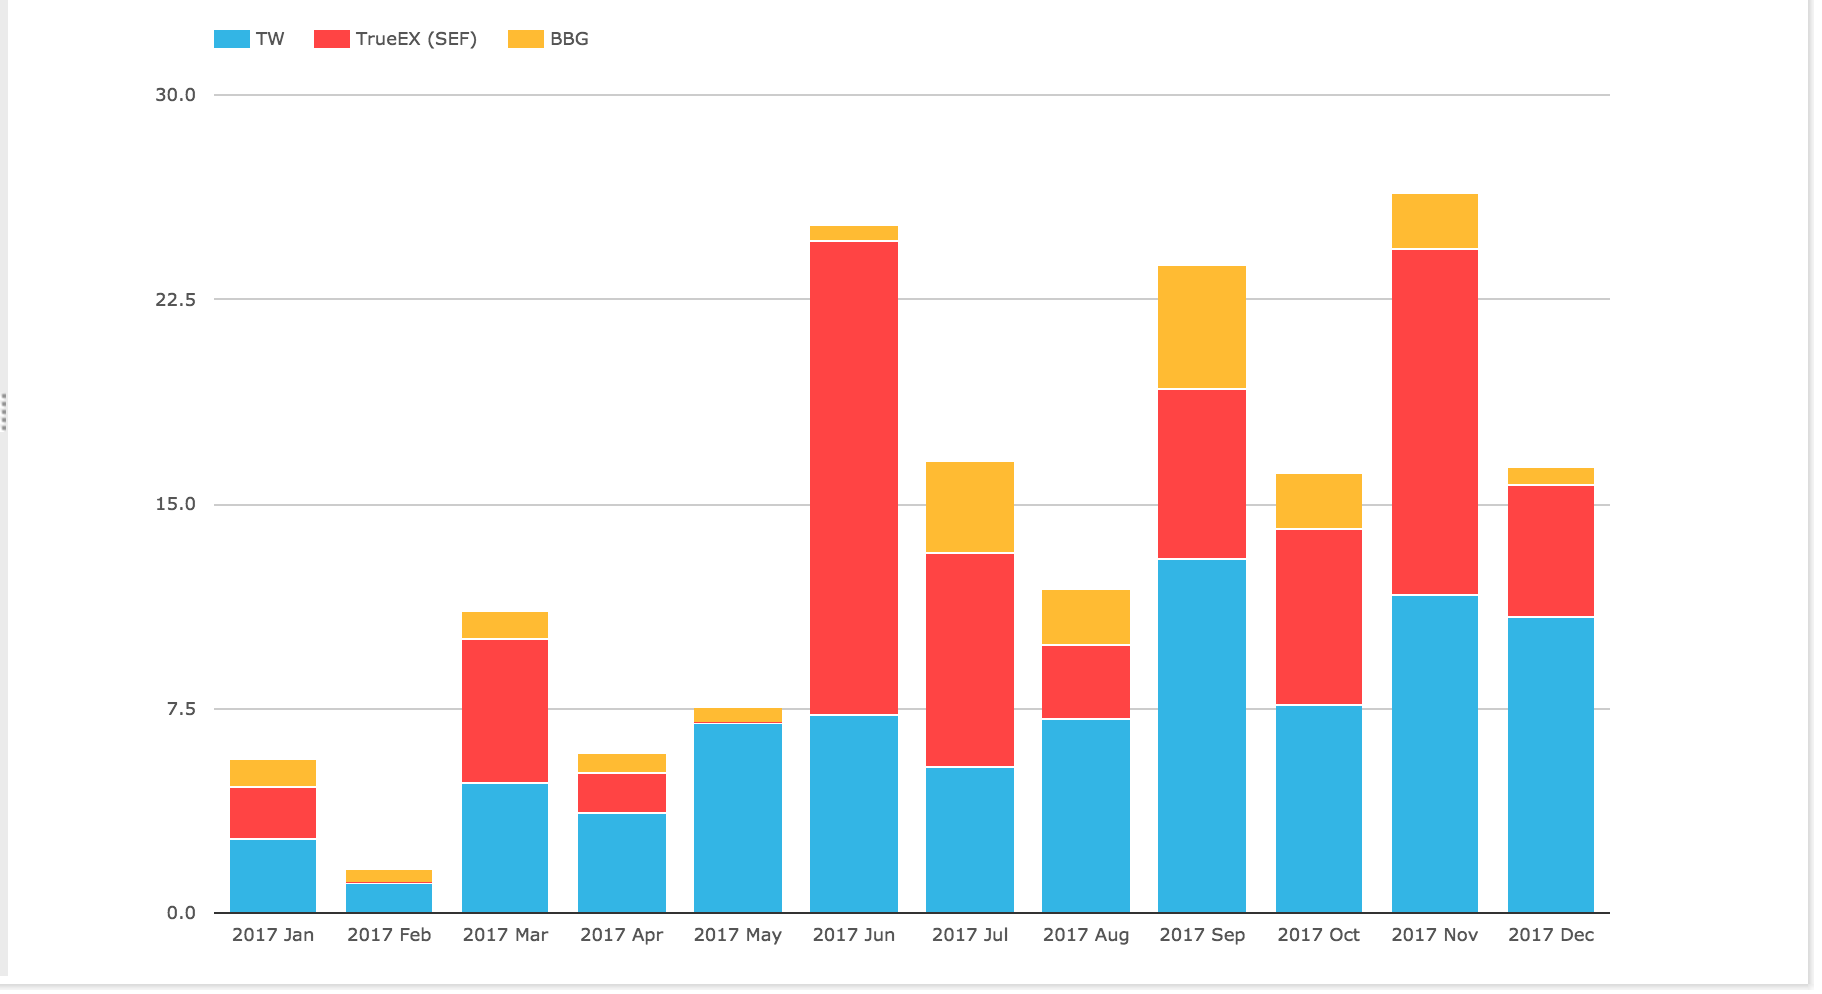
- Showing monthly volume in DV01 millions
- Huge increases at TrueEx in March, June and November
- Due to OIS roll volume (see March 2017 Swaps Review)
- Tradeweb also picking up this roll activity in the later part of the year
- Tradeweb with a 49% share of 2017 volume
- TrueEx with 40%
- Bloomberg with 11%
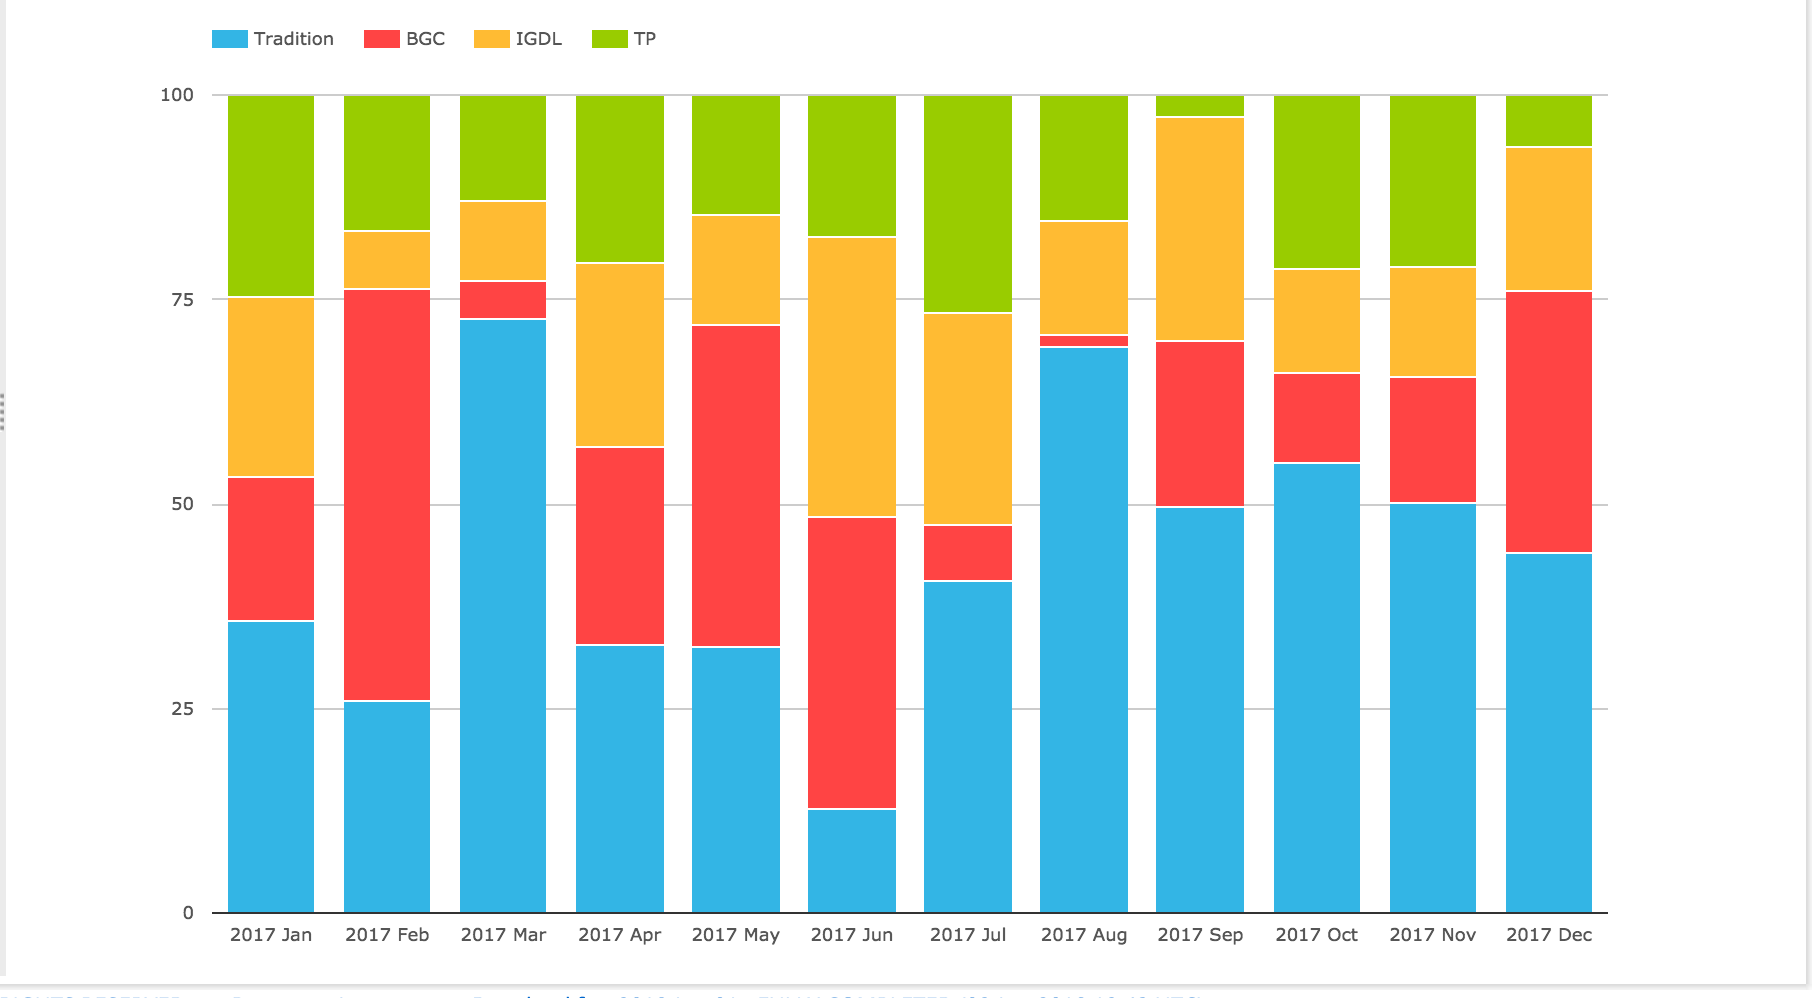
Basis (Single) Currency Swaps
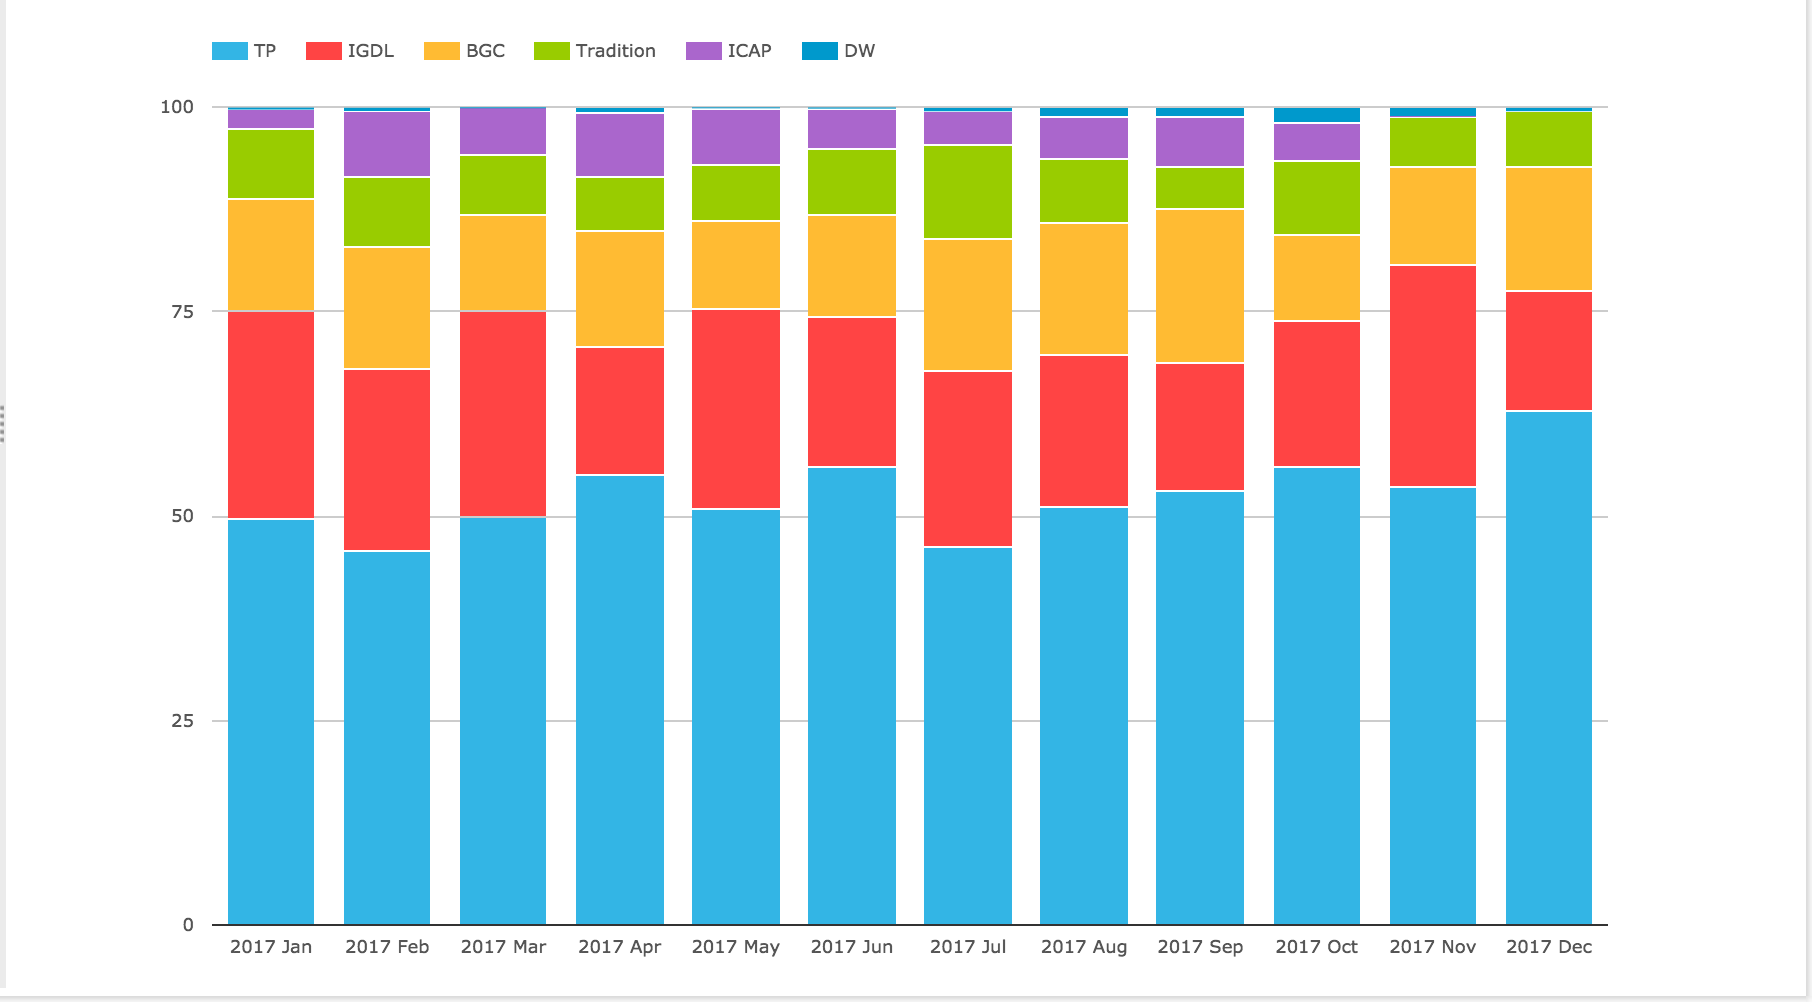
- Tullet with 52% and rising at year end with ICAP consolidation
- IGDL with 21%, slightly down in later half of the year
- BGC with 13.7%
- Tradition with 7.7%
- Dealerweb with 0.7%
Swaptions
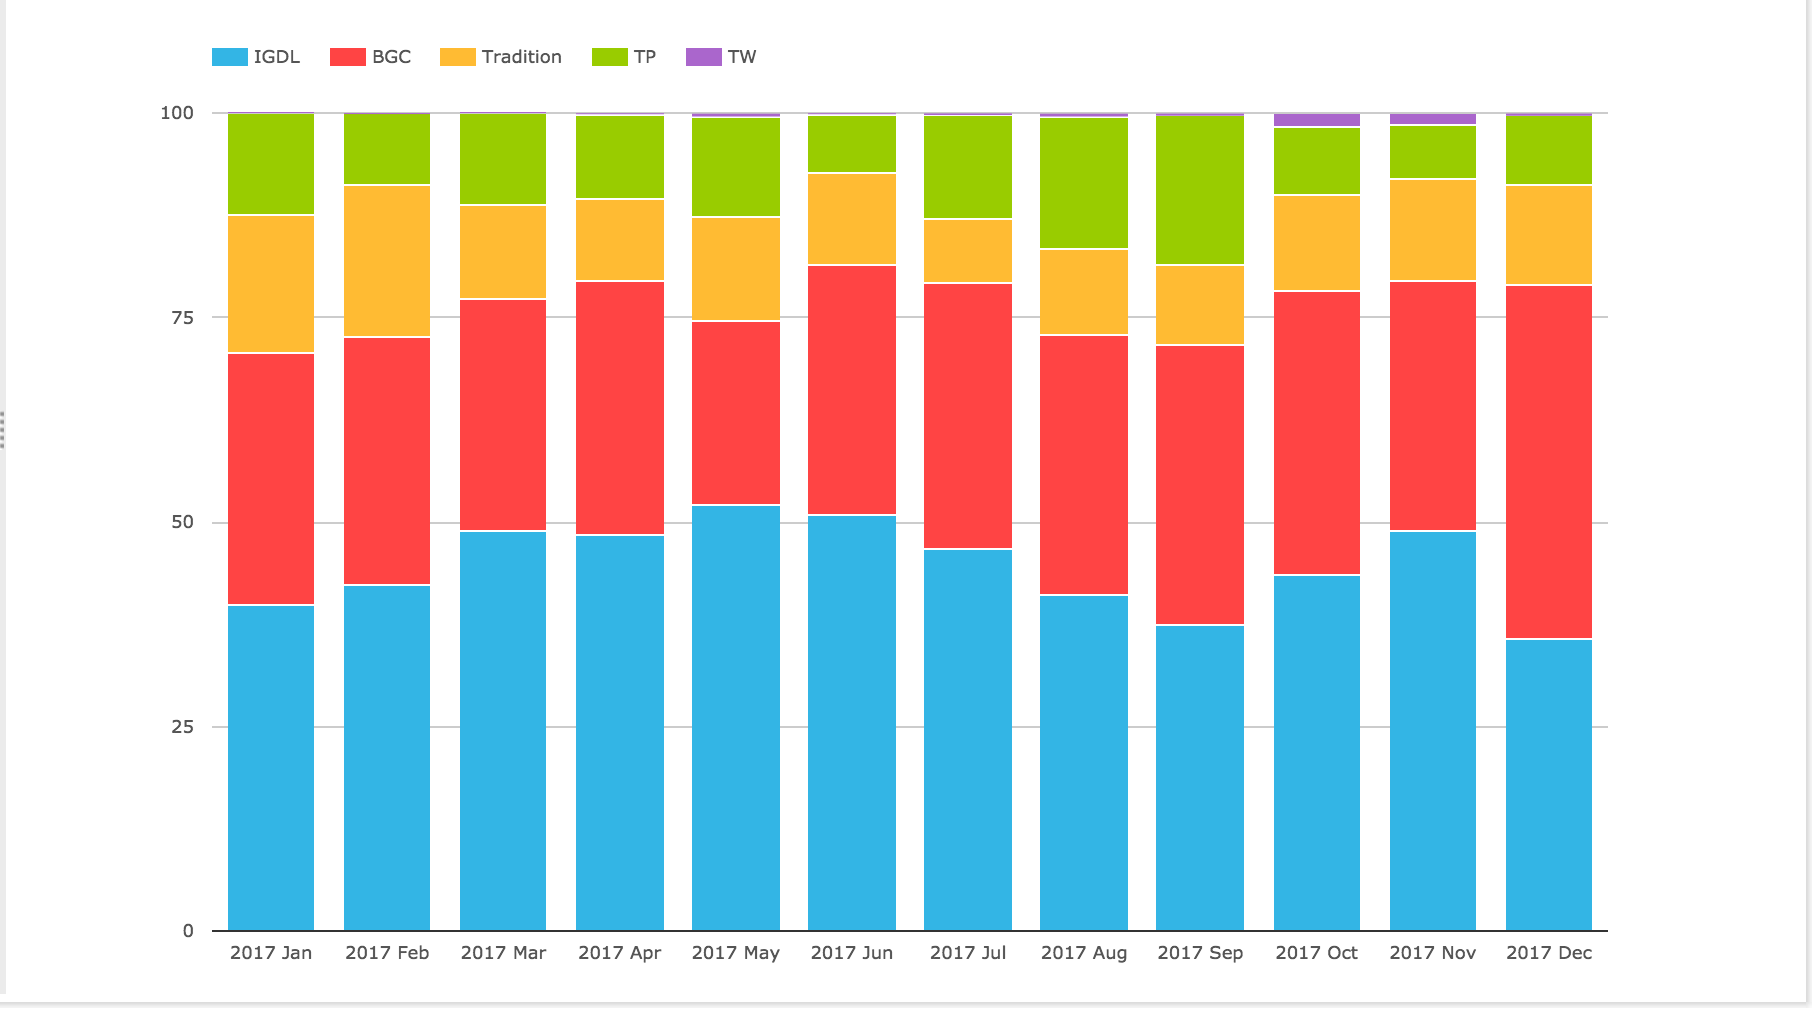
- IGDL with 44% (2016 was 42%)
- BGC with 32%
- Tradition with 12% (2016 was 15%)
- Tullet with 11%
- IGDL + Tullet would be 55%
- Tradeweb showing volume each month from April
Basis Cross Currency Swaps
- BGC the largest with 23%
- IGDL next with 22%
- Tullet with 20% and ICAP with 14%
- These two consolidated would be 34% and in top position
- Tradition with 20%
- Tullet with 23.3%
- Latam with 0.5%
CapsFloors
- Tradition with 45%
- And very high volume (and share) in March
- BGC with 21%
- IGDL with 17%
- Tullet with 16%
- A lot of variability month to month
- Not surprising given the small number of transactions in the product
Inflation Swaps
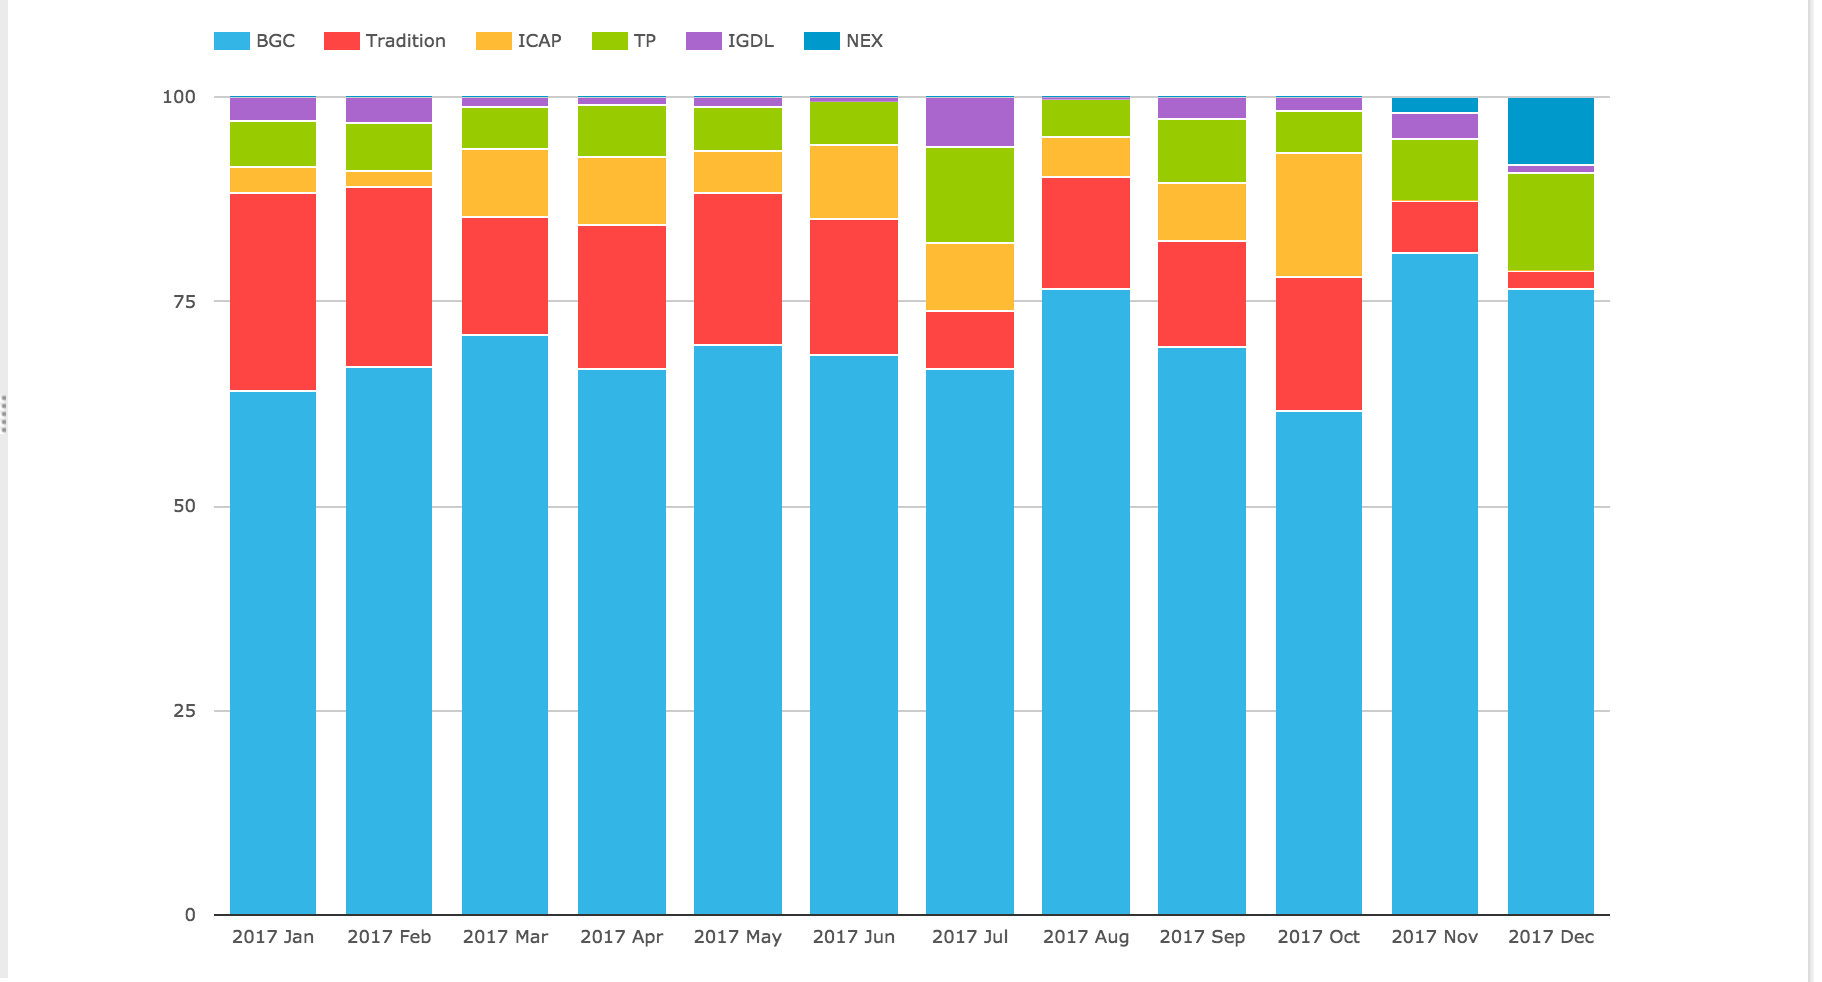
- BGC with 70% share (2016 was 58%)
- Tradition with 15% (2016 was 20%)
- ICAP + Tullet with 13%
- IGDL 2%
- NEX starting in Nov, with 8% of Dec volume
Thats it for IRD.
The End
Thats it, only 20 charts to summarise SEFs in 2017.
I hope you found ones useful to your interest.
If not, using SEFView you can create your own.
It will be interesting to see how 2018 market share develops.
MiFiD II is happening in Europe and will have global implications.
The market expects further rate rises in the US.
What will these mean for volume and market share?
Only time will tell.
We publish regular Swaps Review articles.