In this article I look at 2020 Swap Execution Facility (SEF) market share for Credit, Foreign Exchange and Interest Rate Derivative asset classes, in a similar format to my 2019 SEF Market Share Statistics.
Summary:
- CRD
- Index, Option and Tranche products
- Volume in USD up 17% and in EUR up 12%
- March 2020 a huge month
- Bloomberg dominates with 72% share
- FXD
- FX NDF and FX Options
- NDF volumes flat and FXO down 4%
- FX NDF, TWD now the second largest currency
- FX NDF, D2D for LatAm is led by TP with 63% share
- FX NDF, D2D for Asia is led by BGC with 36% share
- FX NDF, D2C is led by Bloomberg with 50% share
- FX Opt, BGC is the largest in EURUSD, GBPUSD, USDBRL
- FX Opt, Tradition the largest in USDJPY, USDCAD and AUDJPY
- IRD
- Vanilla IRS volumes in major currencies are down
- FRA volumes down in recent quarters
- Vanilla IRS, D2D, Tradition, BGC, TP, IGDL closely clustered
- Vanilla IRS, D2C, Tradeweb on top
- OIS D2D, TP on top
- OIS D2C, Tradeweb on top
- Swaptions, BGC on top
- Basis Swap, TP on top
- Cross Currency Swaps, BGC on top
- CapFloors, Tradition on top
- Inflation, BGC on top
Clarus SEFView has daily volume data published by each SEF, which is filtered, normalised and aggregated to allow meaningful comparison of market share statistics.
Onto the charts, data and details.
CRD Volumes and Share
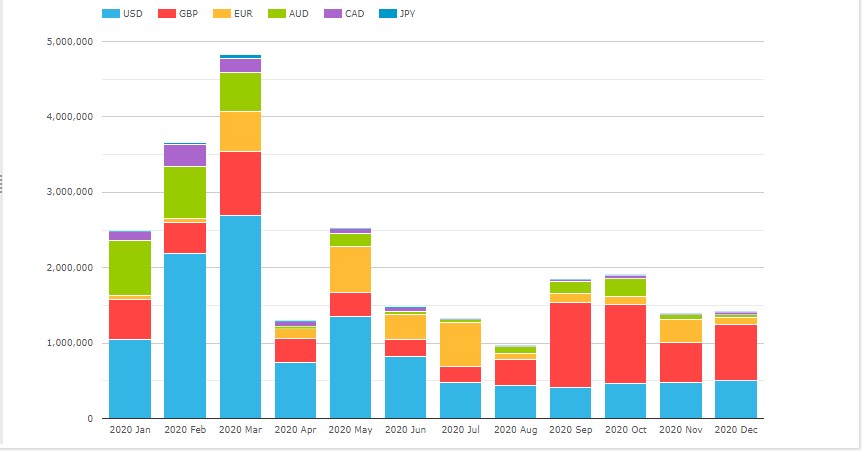
Starting with Credit volumes by currency for each month.

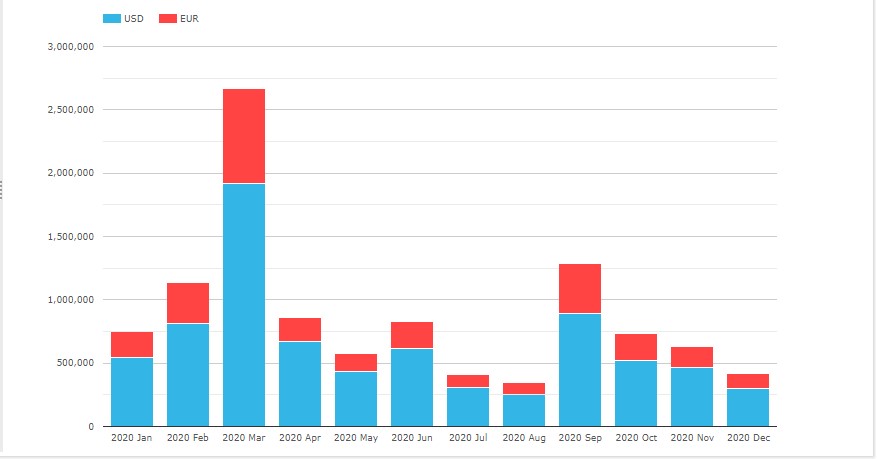
- USD is the largest (CDX.NA.IG, CDX.NA.HY, CDX.EM)
- EUR is next ( iTraxxEurope and iTraxxEuropeCrossOver)
- (Recall CFTC SEF rules govern CDS Index not Single-name, so the latter are not included)
- USD volume in 2020 was $7.7 trillion, up 17% from $6.6 trillion in 2019
- EUR volume in 2020 was $2.9 trillion, up 12% from $2.6 trillion in 2018
- March 2020 with both series rolls and much higher than average volumes from Covid-19 market volatility, was a record month with $1.9 trillion in USD and $750 billion in EUR indices, a combined $2.67 trillion gross notional
- September 2020 also with series roll volume
Next lets look at a chart of market share in percent by gross notional for SEFs.

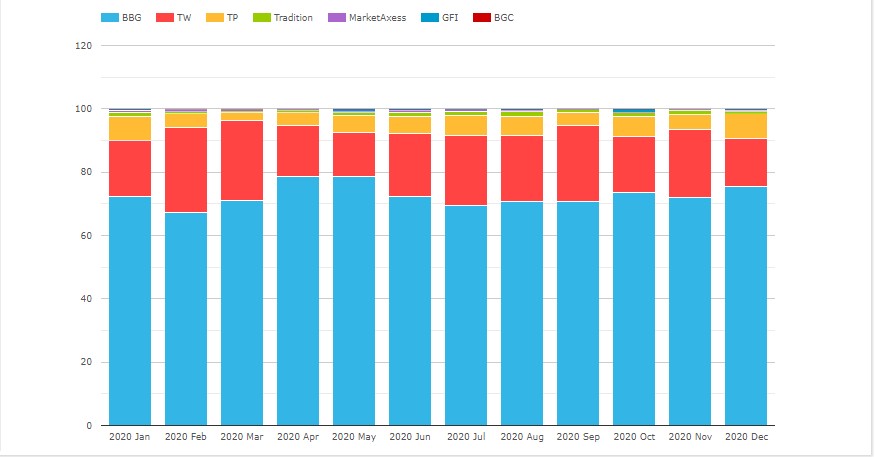
- Bloomberg with a commanding share of 72.2%
- Though this is down from 75.7% in 2019 and 80% in 2018
- Tradeweb is next with 21.5% up from 16.4% in 2019, and 14% in 2018
- Tullet with 4.7%, compared to 5.3% and 3.6% in prior years
- Tradition with 0.8%, compared to 1.1% and 0.7%
- MarketAxess with 0.4%, compared to 0.5%, 0.9%, 1.3% and 1.8%
- GFI with 0.3%, compared to 0.8%, 0.9%, 1.9% and 2.6%
- In USD, Bloomberg has 73.5% share and Tradeweb 18%
- In EUR, Bloomberg has 68.8% and Tradeweb 30.7%
- In EUR, Tradeweb achieving a 9.8% gain from it’s 20.9% in 2019
Next a chart of Currency and Product Type for 2020.

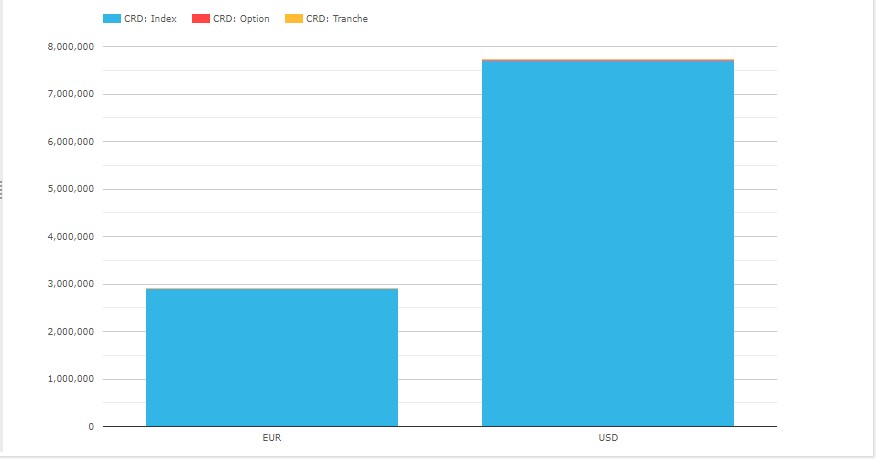
- EUR Index volume is $2.9 trillion, Option is $8.6 billion and Tranche is $720 million, compared to 2019 volumes of $2.5 trillion, $42 billion and $270 million respectively
- USD Index volume is $7.7 trillion, Option is $31 billion and Tranche is $1.9 billion, compared to 2019 volumes of $6.6 trillion, $19 billion and $410 million respectively
And finally for Credit a chart of volume by Index for the current on the run series.

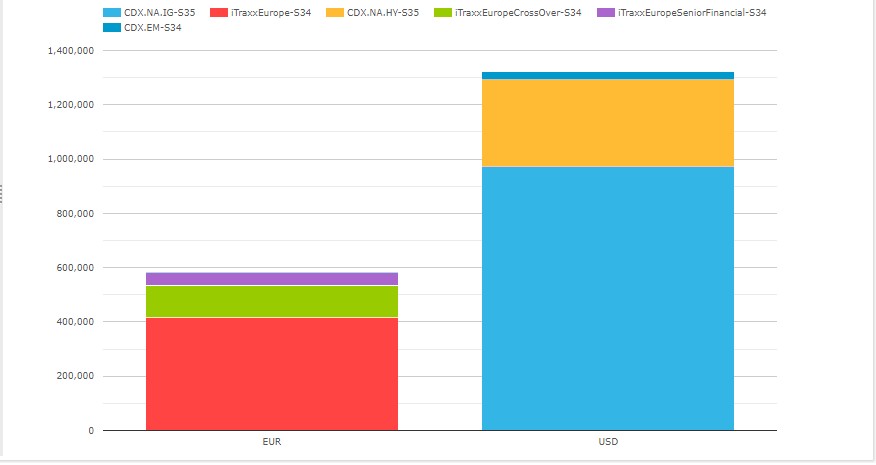
- CDX NA IG S35 is by far the largest with $1 trillion in 2020, same as 2019 but down 35% from $1.55 trillion in 2018 from the then current series
- iTraxx Europe S34 with $418 billion, compared to $375 billion in 2019
- CDX NA HY S35 with $320 billion, compared to $306 billion in 2019
- iTraxx EuropeCrossOver S34 with $117 billion, compared to $103 billion
- iTraxx EuropeSeniorFinancial S34 with $47 billion, compared to $54 billion
- CDX EM S34 with $32 billion, compared to $27 billion
That’s it for CRD.
FXD Volumes and Share
Lets now look at FXD volumes.

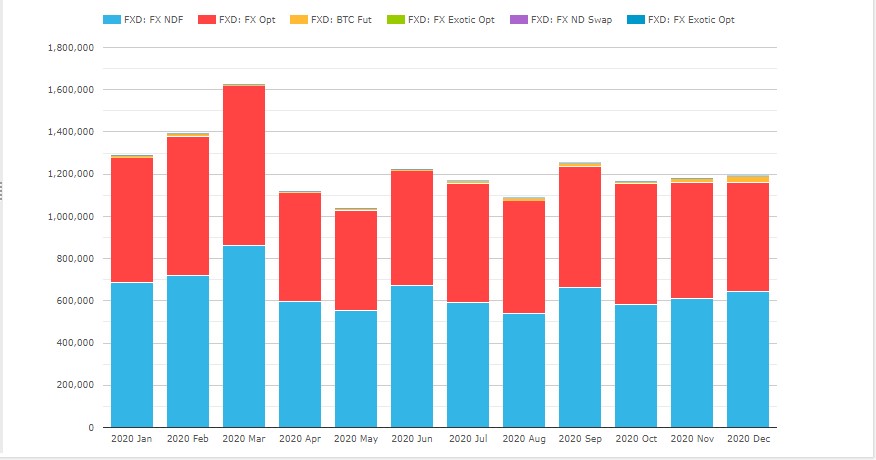
- Non-Deliverable Forwards (NDF) is the largest product with $7.7 trillion, similar to the $7.8 trillion in 2019 and up from $7.4 trillion and $6 trillion in 2018 and 2017
- FX Options close with $6.9 trillion, down 4% from $7.2 trillion in 2019, $7.4 trillion in 2018 and far higher than the $4.8 trillion in 2017
- Others are comparatively insignificant e.g. Bitcoin Futures $142 billion and Exotic Options $10 billion
- March 2020 as expected, the highest volume month
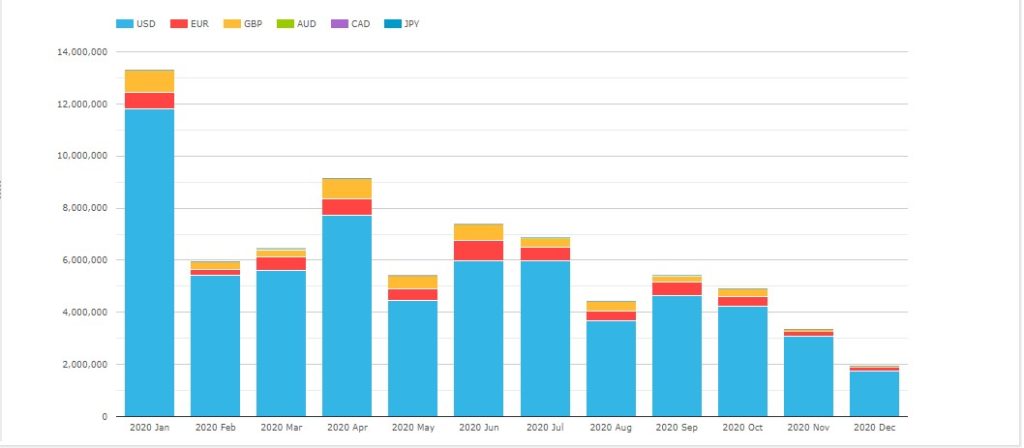
Next FX NDF volumes by currency pair.

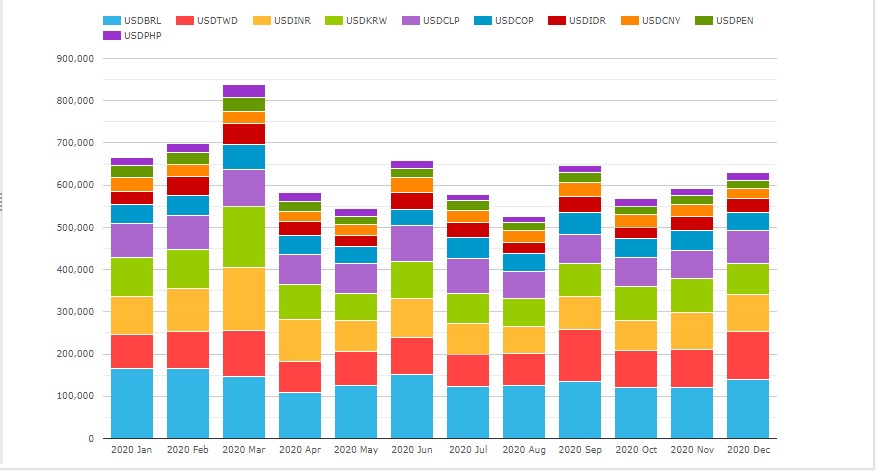
- The largest 10 currencies are BRL, TWD, INR, KRW, CLP, COP, IDR, CNY, PEN, PHP
- The only change in order from 2019 is that TWD has moved from fifth to second
- These 10 currency pairs with $7.5 trillion out of the total $7.7 trillion
- BRL by far the largest with $1.6 trillion, down 27% from $2.2 trillion in 2019
- TWD next with $1.1 trillion, up 28% from $860 billion
- INR with $1.06 trillion, up from $1 trillion in 2019
- KRW with $1.01 trillion, up from $974 billion
- CLP with $910 billion, up from $860 billion
- Then a big gap to COP with $560 billion and IRD with $414 billion
Also of interest and not shown in the chart is that in 2020, there was $2 billion in FX NDF in EURUSD, a deliverable currency pair, compared to $4 billion in 2019. (We have commented on this before as resulting from the need to delta-hedge FX Options and have the hedge included under Uncleared margin).
NDF volume in the 10 largest currencies is dominated by D2D SEFs with 92% vs 8% for D2C, exactly the same split as it was in 2019 and 2018.
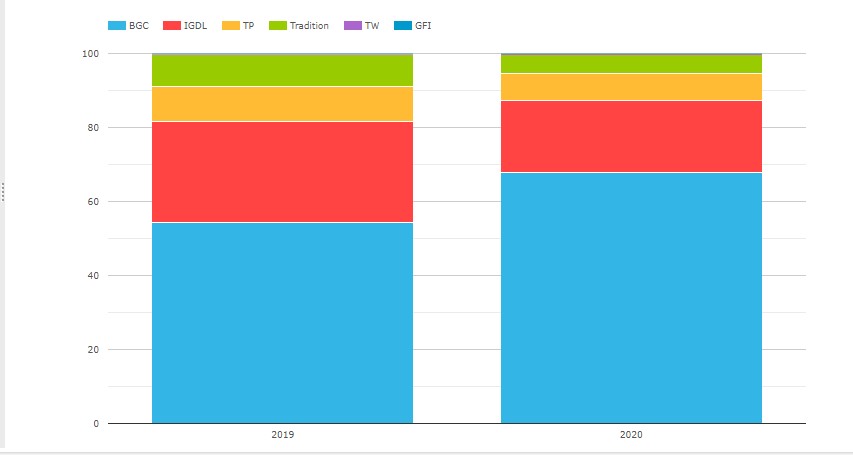
So lets chart NDF percent market share for D2D SEFs by month and first for LatAm currency pairs (BRL, CLP, COP, PEN).

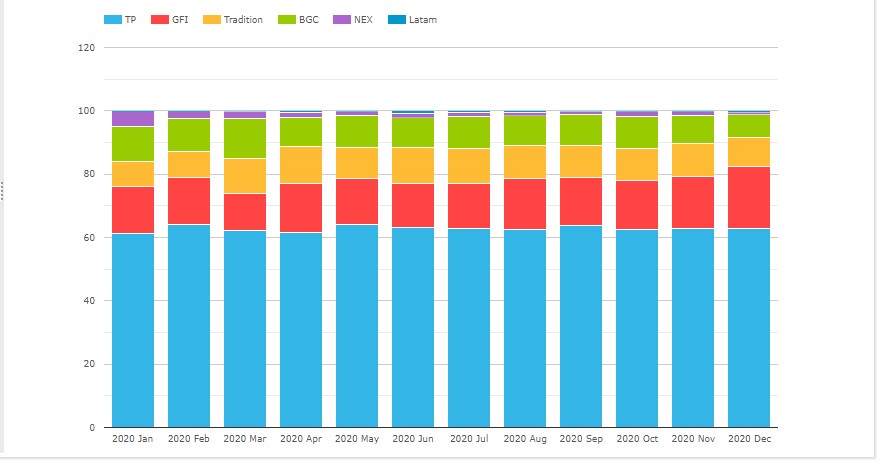
- TP the largest with 62.8%, up from 62% in 2019
- GFI next with 15.1%, similar to the 15.2% in 2019
- Tradition with 10.1%, up from 6.7%
- BGC with 9.9%, down from 13.2%
- NEX with %1.7%, down from 2.3%
- Latam with 0.4%, down from 0.6%
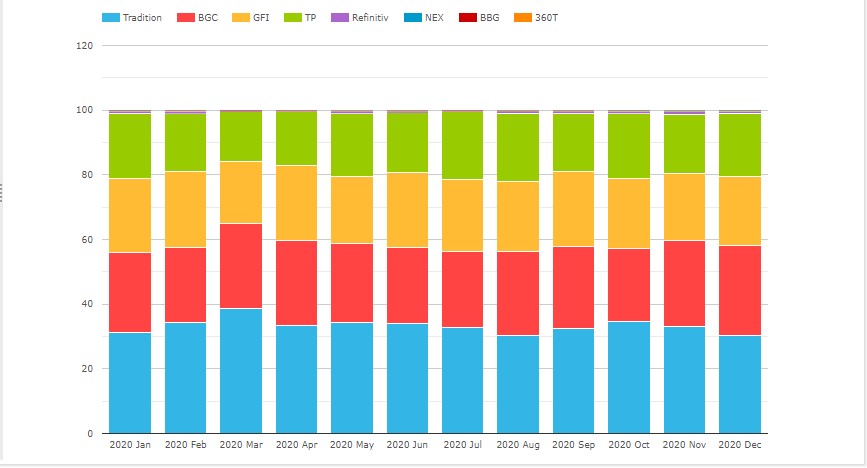
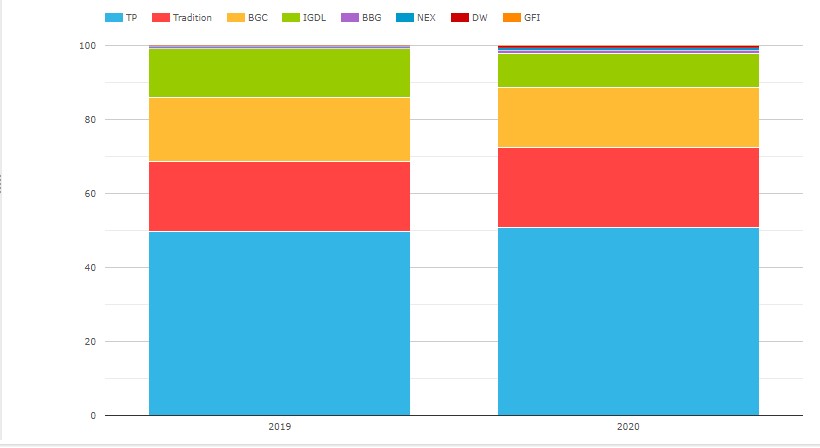
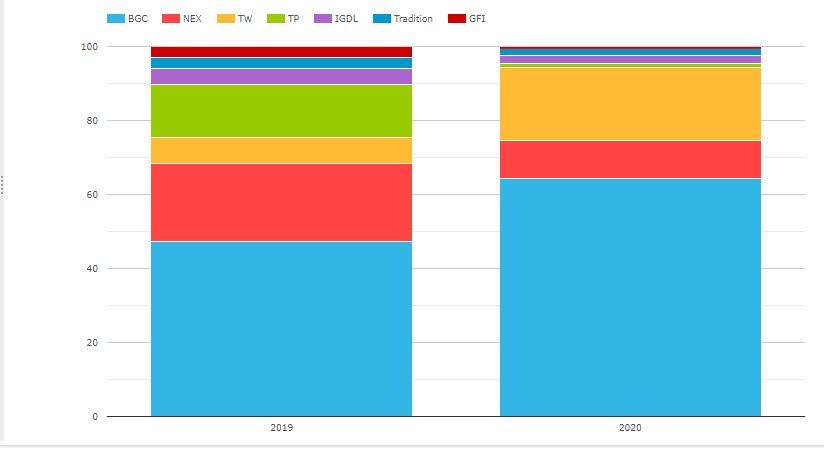
Next D2D SEF Asian currency pairs (CNY, IDR, INR, KRW, PHP, TWD)
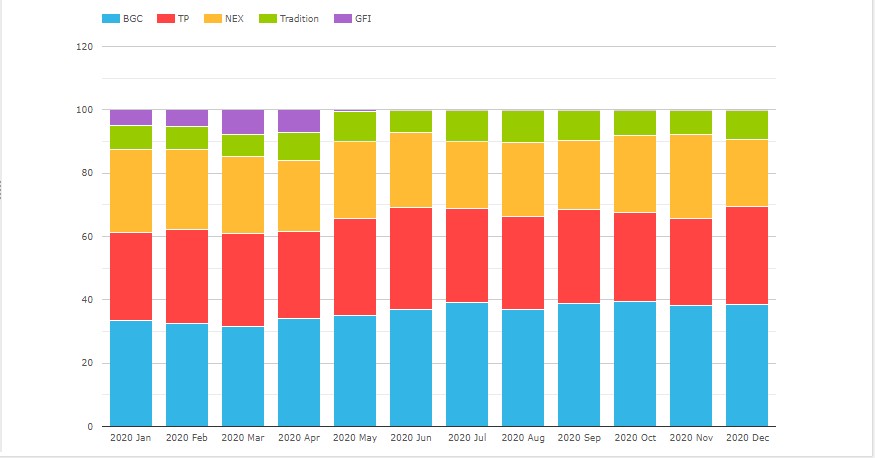
- BGC the largest with 35.9%, up from 29.6% in 2019
- TP next with 29.4%, up from 26.8%
- NEX with 23.8%, down from 31%
- Tradition with 8.3%, up from 6.7%
- GFI with 2.6%, down from 6%
Next the D2C SEFs (the 10 largest ccy pairs).

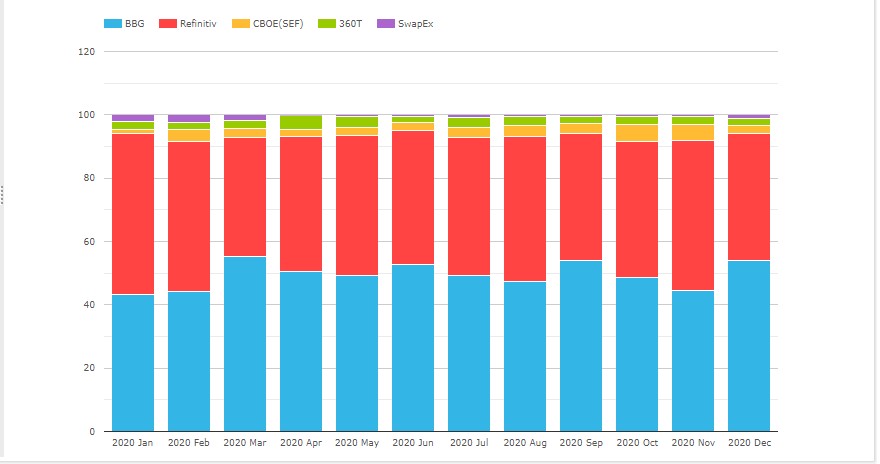
- Bloomberg the largest with 49.6%, up from 27.9% in 2019 and 46.5% in 2018
- Refinitiv close with 43.6%, down from 66.5% in 2019 and 49.5% in 2018
- CBOE with 3.2%, up from 0.5% in 2019 and tiny volume in 2018
- 360T with 2.6%, compared to 2.9% and 2.6% in prior years
- SwapEx with 1%, down from 2.2% and 1.4% in prior years
Next FX Option volumes by currency pair.

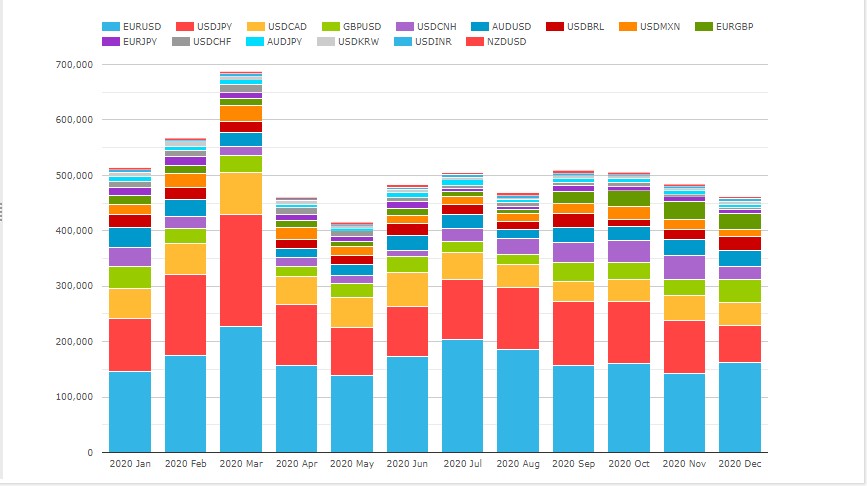
- The largest 15 currency pairs are shown above (in order top left to bottom right)
- EURUSD by far the largest with $2 trillion, up from $1.8 trillion in 2019 and down from $2.3 trillion in 2018
- USDJPY next with $1.34 trillion, similar to $1.35 trillion in 2019 and up from $1.2 trillion in 2018
- USDCAD with $610 billion is up from $470 billion
- GBPUSD with $335 billion is down from $595 billion
- AUDUSD with $304 billion down from $340 billion
- USDBRL with $230 billion is down from $380 billion
FXO volumes are dominated by D2D SEFs with 99.3% v 0.7% for D2C, similar to 2019.

- EURUSD with BGC 27%, Tradition 26.8%, GFI 25.5% Tradition, TP 19.6% compared to 2019 with BGC 27%, Tradition 25.7%, GFI 26.2%, TP 19%
- USDJPY with Tradition 44%, BGC 20.8%, TP 20.7%, GFI 13.7% compared to 2109 with Tradition 43.5%, BGC 21.9%, TP 18.4%, GFI 15.3%
- GBPUSD, BGC and Tradition the largest
- USDCAD, Tradition the largest
- USDBRL, BGC the largest
- AUDJPY Tradition the largest
Thats it for FXD.
IRD Volumes and Share
Lets now turn to IRD, starting with Vanilla Interest Rate Swap volumes.

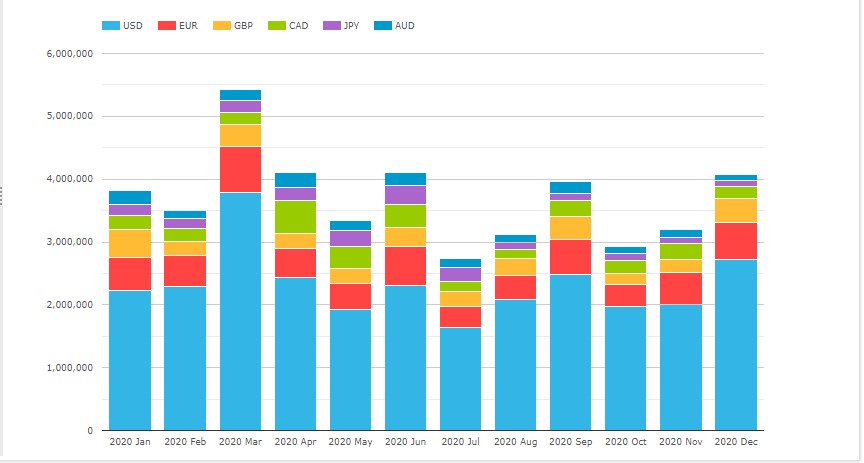
- USD by far the largest with $27.9 trillion, down from $33.3 trillion in 2019
- EUR next with $5.9 trillion, down from $7 trillion in 2019
- GBP with $3.46 trillion, up from $3.2 trillion
- CAD with $3.1 trillion, up from $2.6 trillion,
- JPY with $2 trillion, down from $2.4 trillion
- AUD with $1.9 trillion, up from $1.1 trillion
- An overall $44 trillion, is down 12% from $50 trillion in 2019
- March the highest month with $5.4 trillion (March 2019 was $5.5 trillion)
- July 2020 the lowest month with $ 2.7 trillion
Next Overnight Index Swaps.

- USD by far the largest with $11.6 trillion, down from $24 trillion in 2019
- GBP next with $6.7 trillion, up from $2 trillion in 2019
- Most of the decrease in USD and increase in GBP at Tradeweb
- EUR next with $3 trillion, down from $3.5 trillion
- AUD with $2.8 trillion, down from $3.5 trillion
- CAD with $895 billion, down from $1.3 trillion
- JPY with $161 billion, up from $122 billion
- March by far the highest month with $4.8 trillion
- August the lowest with $970 billion
Next FRAs.

- USD by far the largest with $64.4 trillion, down from $70.7 trillion in 2019
- EUR next with $5.3 trillion, up from $4.3 trillion
- GBP next with $4.7 trillion, up from $2.5 trillion
- AUD with $153 billion, down from $251 billion
- CAD with $895 billion, down from $1.3 trillion
And the last 3 years by quarter shows a pronounced downward trend over the course of each year.

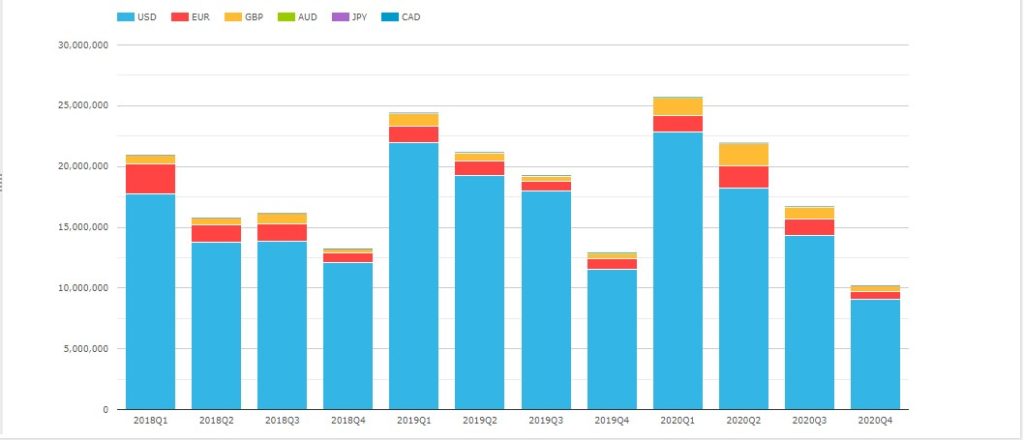
Which must be a characteristic of the portfolio maintenance activity run by NEX Reset, TP ICAP Matchbook and others to manage Swap portfolio risk.
Given the upcoming demise of new Swaps referencing Libor after Dec 2021, we expect to start seeing less and less of this FRA activity, as it is not required for daily averaging SOFR, SONIA and €STR Swaps.
And other IRD product types (except for FRAs).

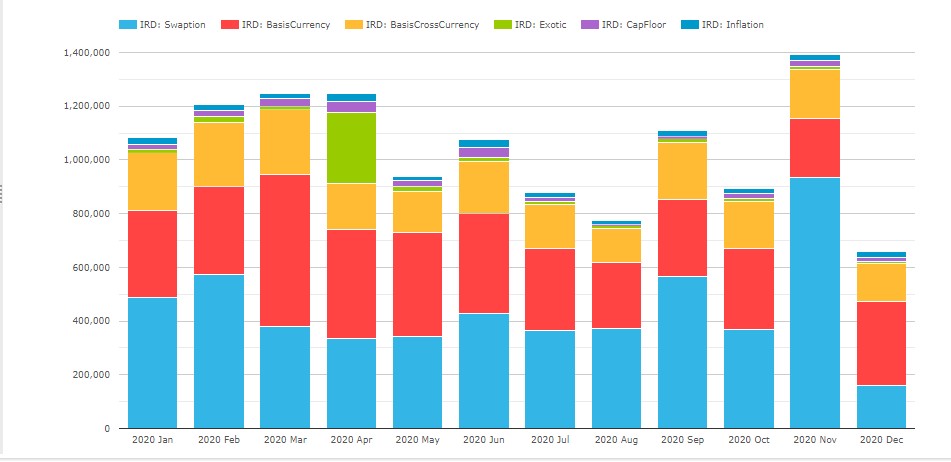
- These products averaged $1.04 trillion a month, similar to 2019 and 2018
- Swaptions are the highest averaging $440 billion a month, compared to $470 billion, $350 billion and $260 billion a month in prior years
- Swaptions in November with a high of $930 billion, over twice the average
- Basis (Single) Currency next, averaging $338 billion a month, compared to $360 billion and 450 billion in prior years
- Basis Currency in March with a high of $570 billion
- A lot Basis Swaps volume is Libor tenor basis and much of this will vanish after 2021, leaving fewer Basis e.g. FF vs SOFR or AONIA vs BBSW.
- Basis Cross Currency averaging $184 billion a month, compared to $190 billion in 2019 and 2018
- Basis Cross Currency with $240 billion in March
- Inflation Swaps averaging $21 billion a month, compared to $16 billion and $19 billion
- CapFloors averaging $21 billion a month, compared to $28 billion and $32 billion
- Exotics averaging $34 billion a month, up from $10 billion and $12 billion in prior years
Next market share for selected product types.
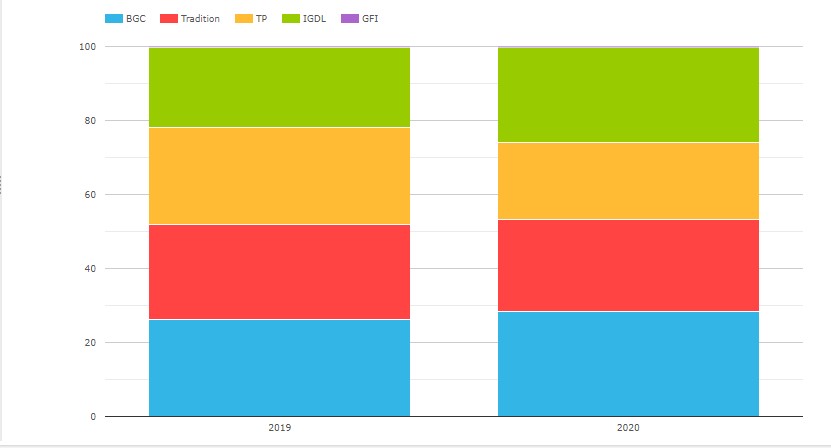
Vanilla IRS
First for D2D SEFs, all currencies and using a DV01 percentage share.

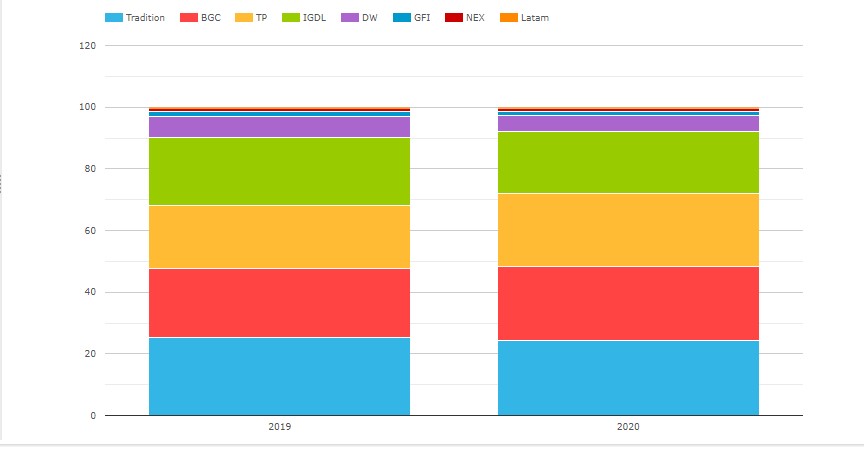
- Tradition top with 24.2% (was 25.2% in 2019)
- BGC with 24% (was 22.5%)
- TP with 23.7% (was 20.4%)
- IGDL with 20.1% (was 22.1%)
- DW with 5.3% (was 6.6%)
- GFI with 1.3% (was 1.8%)
- NEX with 0.8% (was 0.7%)
(While using DV01 instead of notional adjusts for tenor and gives a better indication of brokerage revenue share, SEF data does not allow us to identify packages (curve, spreads, flys) and for those SEFs that do a higher proportion of these than others, the revenue share will be slightly inflated, which given how close the top 4 are could easily mix up the rankings).
Next for D2C SEFs, all currencies and using a DV01 percentage share.

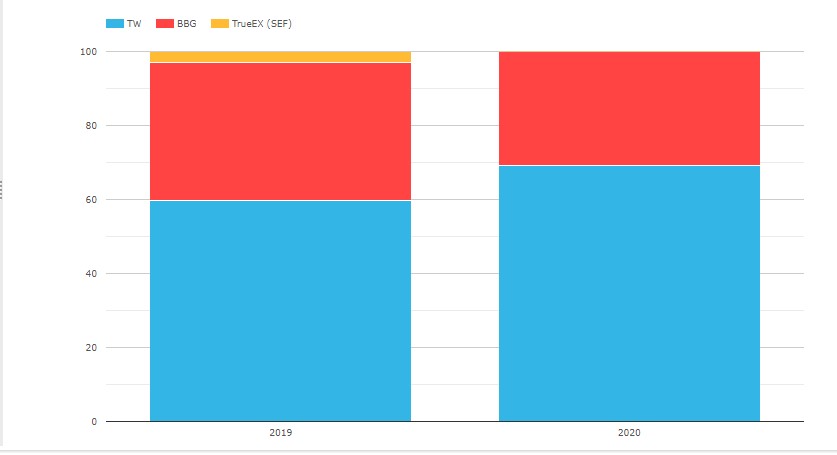
- Tradeweb with 69.2%, compared to 59.7% in 2019
- Bloomberg with 30.8%, compared to 37.2%
- TrueEx is no longer operating and had 3.1% in 2019
OIS
First for D2C SEFs.

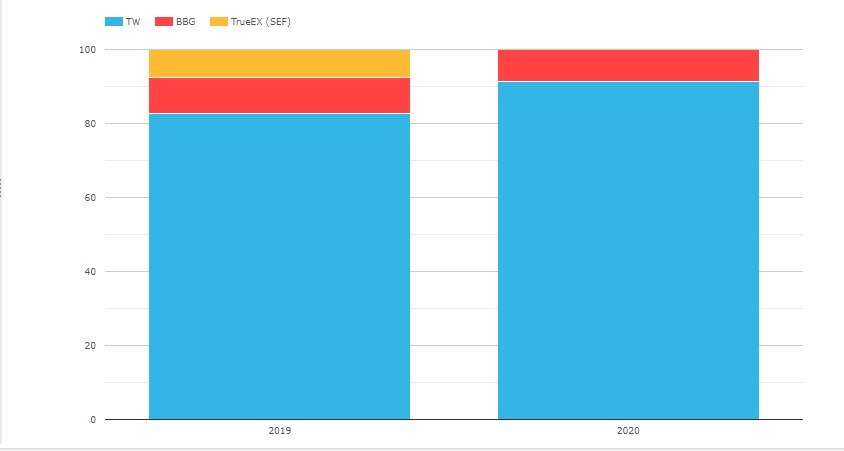
- TrueEx not operating in 2020
- Tradeweb with 91.4% share, up from 82.8%
- Bloomberg with 8.6% share, down from 9.6%
Next D2D SEFs.

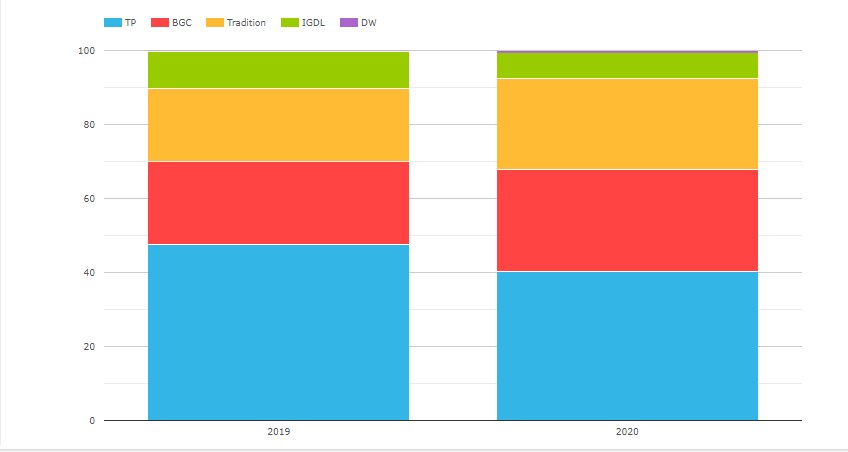
- TP the largest with 40.3% (was 47.5% in 2019)
- BGC with 27.7% (was 22.6%)
- Tradition with 24.6% (was 19.7%)
- IGDL with 6.9% (was 10%)
- DW with 0.7% (was 0.2%)
Swaptions

- BGC the largest with 67.8%, up from 54.3% and 42.4% in prior years
- (BGC growth primarily from compression at CapitalLab)
- IGDL next with 19.5%, down from 27.4% and 32.8%
- TP with 7.4%, down from 9.5% and 12.2%
- Tradition with 5%, down from 8.5% and 11.4%
- Tradeweb with 0.4%, up from 0.3%
Basis (Single) Currency Swaps

- TP the largest with 50.8% (was 49.9% in 2019)
- Tradition with 21.6% (was 18.7%)
- BGC with 16.4% (was 17.4%)
- IGDL with 9.2% (was 13.3%)
- BBG with 0.8% (was 0.5%)
- DW with 0.6% (was 0.1%)
Basis Cross Currency Swaps

- BGC the largest with 28.3% (was 26.2% in 2019)
- IGDL with 25.7% (was 21.6%)
- Tradition with 25% (was 25.5%)
- TP with 20.7% (was 26.5%)
- GFI with 0.3% (was 0.2%)
CapsFloors

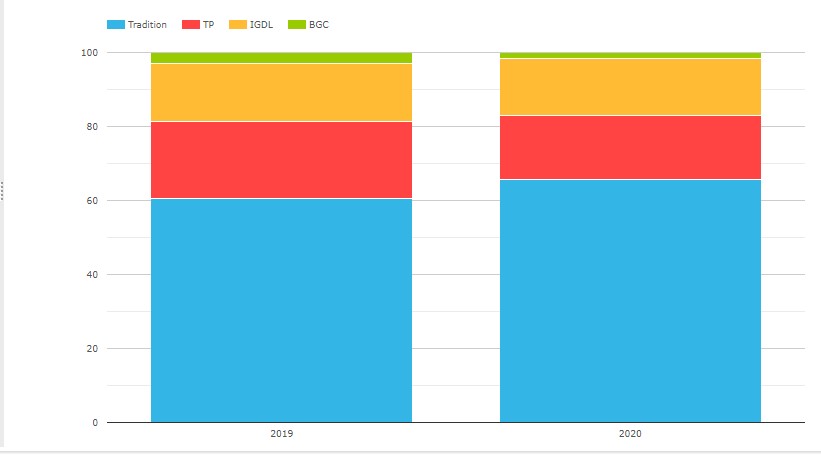
- Tradition the largest with 65.7% (was 60.4% in 2019)
- TP with 17.4% (was 21%)
- IGDL with 15.3% (was 15.5%)
- BGC with 1.7% (was 3.1%)
Inflation Swaps

- BGC the largest with 64.5% (was 47.2% in 2019)
- Tradeweb with 19.6% (was 7.2%)
- NEX with 10.2% (was 21.1%)
- IGDL with 2.3% (was 4.4%)
- Tradition with 1.7% (was 2.9%)
- TP with 1.1% (was 14.1%)
- GFI with 0.6% (was 3.1%)
That’s it for IRD.
The End
That’s it, 25 charts to summarise SEF statistics in 2020.
There are many more I could have created.
I hope you found ones useful to your interest.
If not, using SEFView you can create your own.
Please contact us for a subscription if you don’t have one.
It will be interesting to see how 2021 market share develops.
As the Covid-10 vaccine roll-out gathers steam and
As Governments continue with massive debt issuance.
What will this mean for volume and market share?
Only time will tell.
We publish regular Swaps Review articles.