Clarus CCPView has daily volume and open interest data published by each CCP, which is filtered, normalised and aggregated to allow meaningful comparisons of volumes.
Today we look at 2Q23 Volume and market share in IRD for:
- USD Swaps (LIBOR, SOFR, FF)
- EUR Swaps (EURIBOR, €STR)
- GBP Swaps (SONIA)
- JPY Swaps (TONA)
- AUD Swaps (BBSW, AONIA)
- CAD Swaps (CDOR, CORRA)
- EMEA Swaps
- AsiaPac Swaps
- LatAm Swaps
- Cross Currency Swaps
Onto the charts, data and details.
Volumes and Market Share
For major currencies and regions, vanilla swaps referencing IBORs and OIS Swaps referencing RFRs, using single-sided gross notional volume over a period; either a month, quarter or year.
USD Swaps (Libor)

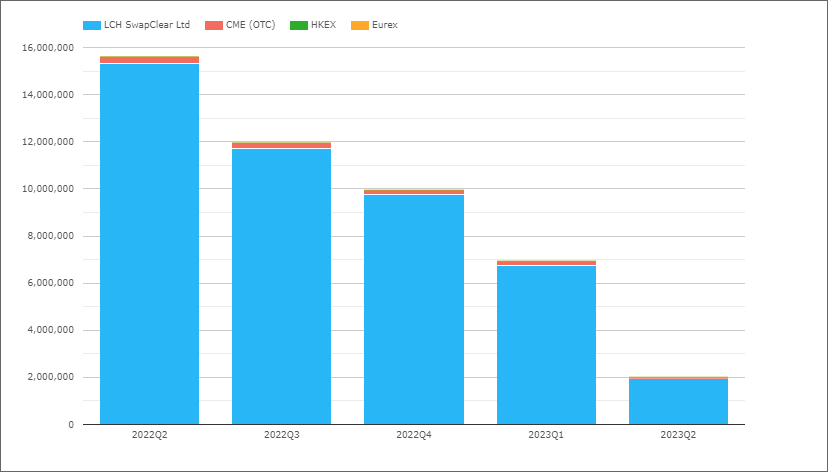
- The trend we would expect as USD Libor came to an end on 30 June 2023
- $15.6 trillion in 2022Q2 down to just $2 trillion in 2023Q2
- If you have not done so already, I encourage you to read Chris’s blog; Bollinger, Greenspan and The Millenium Bug: LIBOR is now dead
- The end of an era indeed
USD OIS (All)
Referencing Fed Funds and SOFR.
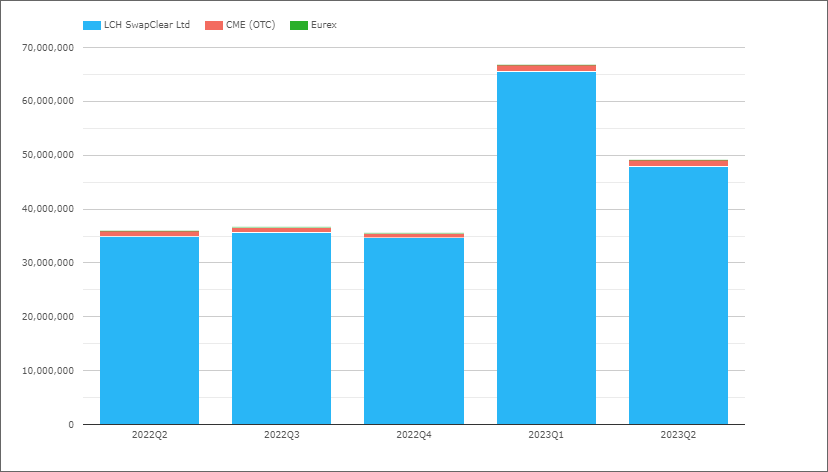
- 2023Q2 with $49.1 trillion compared to $36.7 trillion in 2022Q2
- Down from the high in 2023Q1, but well above prior quarters
- LCH SwapClear with $47.9 trillion in 2023Q2 and $35.6 trillion in 2022Q2
- CME OTC with $1.2 trillion in 2023Q2 and $1 trillion in 2022Q2
- 2023Q2 Share is LCH 97.5% and CME 2.5%, compared to 97.1% v 2.9% in 2022Q2
USD Swaps (SOFR)
Next I usually isolate Swaps that reference SOFR, however at the time of writing I do not have June volumes for SOFR, so will skip this section.
[Note: I may update this next week or cover the data in a future blog].
That’s all for USD for today.
With Libor conversions behind us, 3Q23 and 4Q23 volumes, will tell us where the steady state CCP market share in USD ends up between LCH and CME.
EUR Swaps (Euribor)
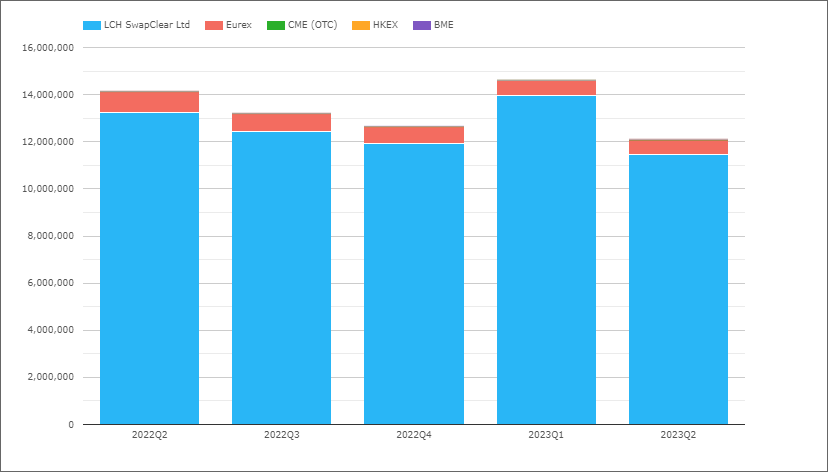
- 2023Q2 with €12.1 trillion compared to €14.1 trillion in 2022Q2
- LCH SwapClear with €11.5 trillion in 2023Q2 and €13.2 trillion in 2022Q2
- Eurex with €0.62 trillion in 2023Q2 and €0.89 trillion in 2022Q2
- 2023Q2 market share is LCH 94.9%, Eurex 5.1%
- While 2022Q2 share was 93.7% and 6.3% respectively
EUR OIS (All)
Referencing either EONIA or €STR, though in recent quarters all will be €STR.
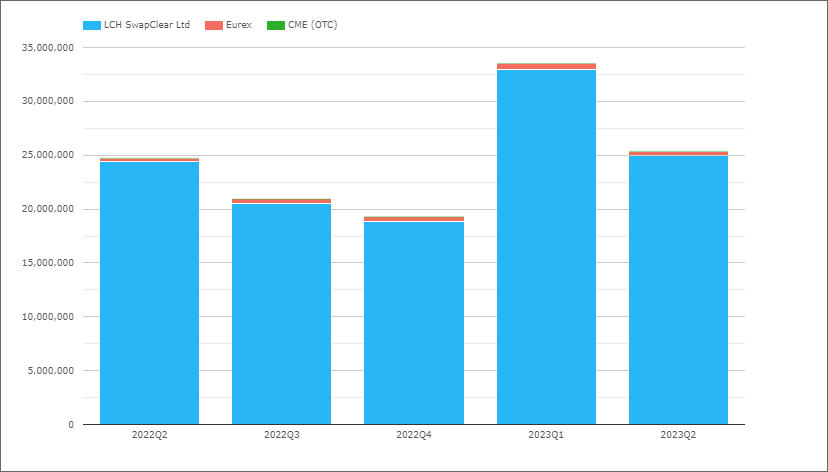
- 2023Q2 with €25.4 trillion compared to €24.7 trillion in 2022Q2
- LCH SwapClear with €25 trillion in 2023Q2 and €24.5 trillion in 2022Q2
- Eurex with €0.42 trillion in 2023Q2 and €0.28 trillion in 2022Q2
- 2023Q2 market share is LCH 98.4%, Eurex 1.7%
- While 2022Q2 share was 98.9% and 1.1% respectively
Combined share for EUR IRS and OIS, showing LCH SwapClear with 97.2% in 2023Q2 and Eurex with 2.8%, similar to the share in 2022Q2 of 97% and 3% respectively.
That’s all for EUR.
GBP OIS (SONIA)
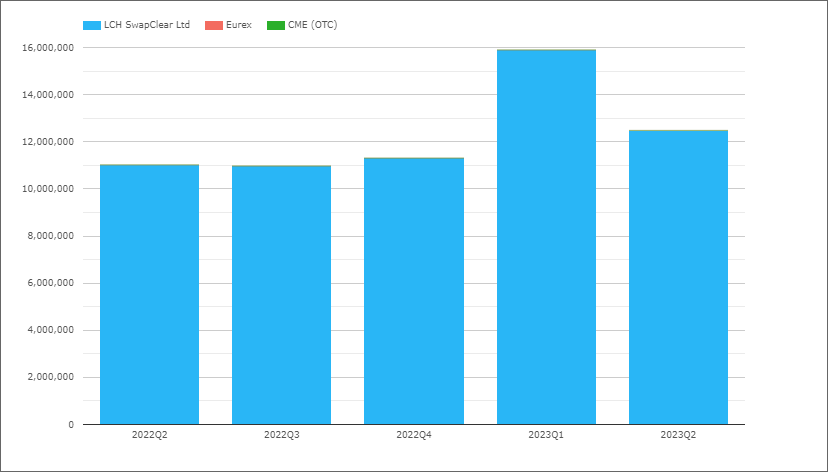
- 2023Q2 with £12.5 trillion compared to £11 trillion in 2022Q2
- LCH SwapClear with 99.9% share
JPY OIS (TONA)
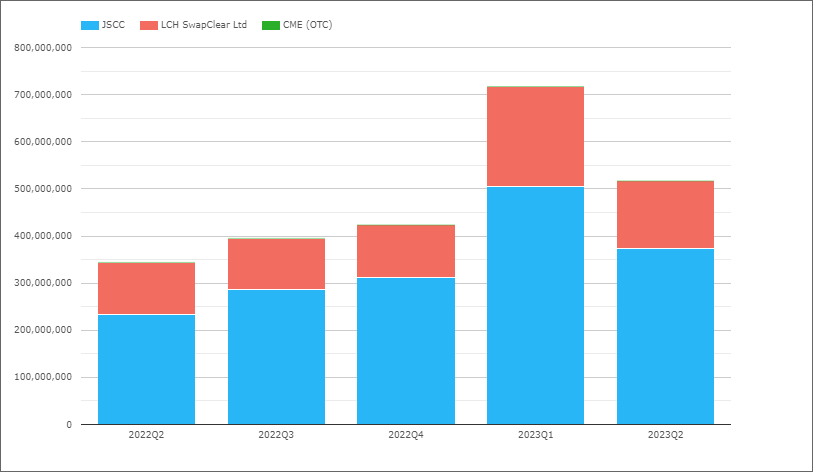
- 2023Q2 with Y517 trillion compared to Y344 trillion in 2022Q2
- JSCC with Y373 trillion in 2023Q2, compared to Y233 trillion in 2022Q2
- LCH SwapClear with Y144 trillion in 2023Q2, compared to Y111 trillion in 2022Q2
- 2023Q2 Share is JSCC 72.1%, LCH 27.9%, compared to 67.7% and 32.3% in 2022Q2
AUD Swaps
Referencing either AONIA or BBSW, so both OIS and IRS.
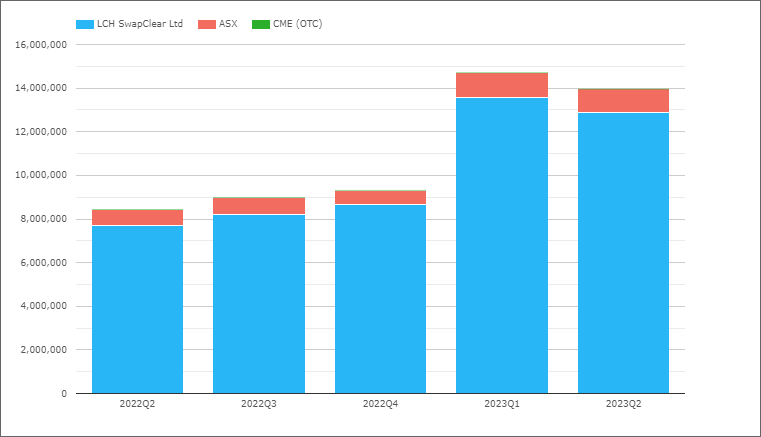
- 2023Q2 with A$14 trillion, compared to A$8.4 trillion in 2022Q2
- AUD, the only currency so far where Q2 volumes are not far off Q1
- LCH SwapClear with A$12.9 trillion in 2023Q2 and A$7.7 trillion in 2022Q2
- ASX with A$1.1 trillion in 2023Q2 and A$0.73 trillion in 2022Q2
- 2023Q2 Share is LCH 92.3% and ASX 7.7%, compared to 91.3% and 8.7% in 2022Q2
- [Upated figures from when first published, which had excluded ASX June volumes]
CAD Swaps
Referencing either CORRA or CDOR, so both OIS and IRS.
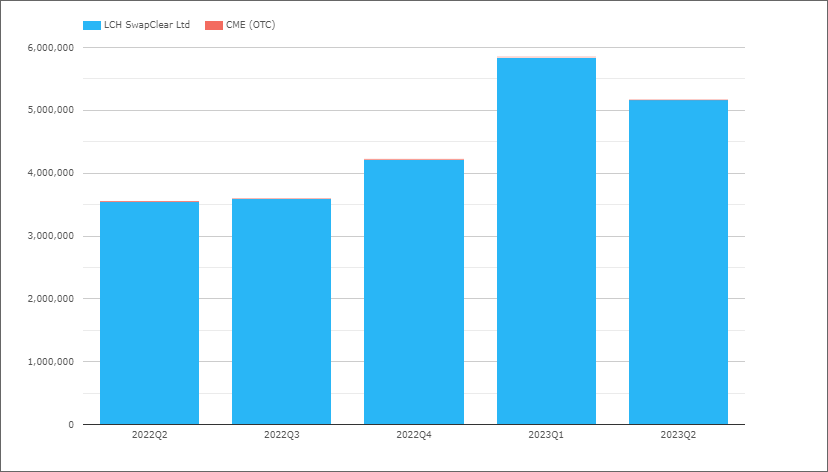
- 2023Q2 with C$5.2 trillion, compared to C$3.6 trillion in 2022Q2
- CAD Swaps, simialr to AUD in that Q2 volumes are not far off Q1
- LCH SwapClear with 99.9% of the volume
EMEA Swaps
Now let’s switch to EMEA Swaps (all types) and volumes by currency.
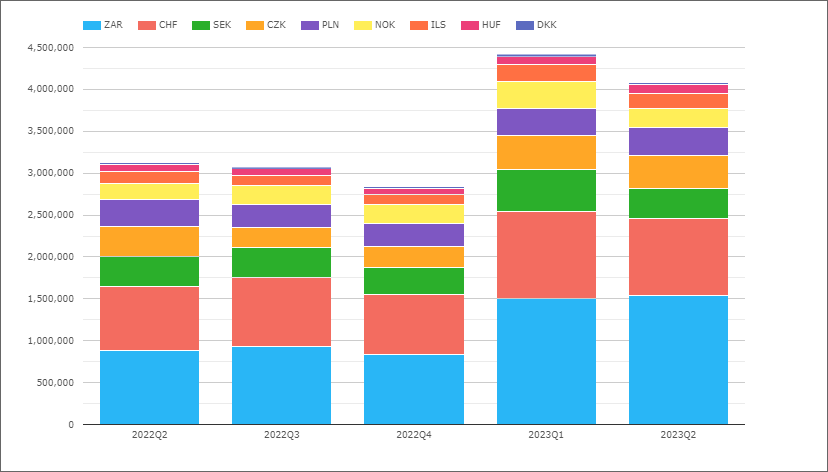
- 2023Q2 with $4.1 trillion, up from $3.1 trillion in 2022Q2
- ZAR the largest in 2023Q2 with $1.5 trillion, up from $0.87 trillion in 2022Q2
- CHF next with $0.9 trillion, up from $0.77 trillion in 2022Q2
- CZK with $387 billion, up from $351 billion a year earlier
- SEK with $368 billion, up from $360 billion
- PLN with $334 billion, up from $330 billion
- NOK with $235 billion, up from $182 billion
- ILS with $177 billion, up from $148 billion
- HUF with $101 billion, up from $79 billion
- DKK with $22 billion, down from $26 billion
Volumes up in all currencies from a year earlier, except for DKK.
Not shown in the chart is market share by CCP, where LCH has >97.5% share for the whole period in every currency except for:
- PLN, LCH with 95.2%, KDPW 2.5%, CME 2.3%
- HUF, LCH with 95.6%, CME with 4.4%
AsiaPac Swaps
Now let’s switch to AsiaPac Swaps (all types) and volumes by currency.
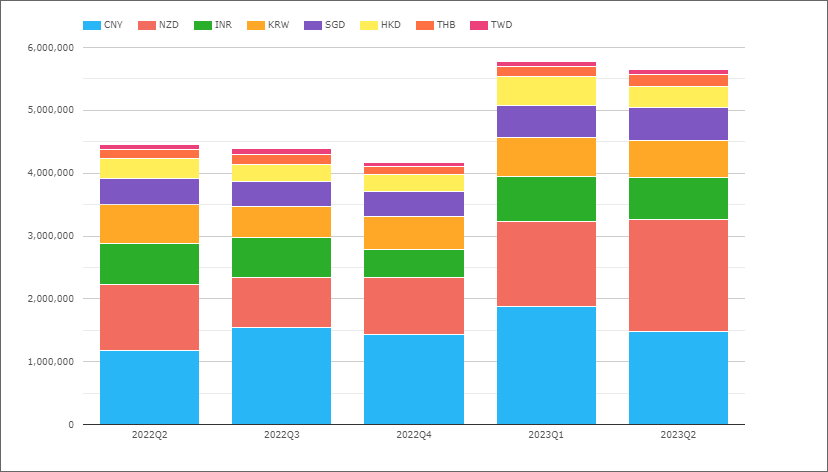
- 2023Q2 with $5.6 trillion, up from the $4.5 trillon level in 2022Q2
- So materially larger than the $4.1 trillion for EMEA
- NZD the largest in 2023Q2 with $1.8 trillion, up from $1.1 trillion in 2022Q2
- CNY next with $1.5 trillion, up from $1.17 trillion a year earlier
- INR with $667 billion, up from $653 billion
- KRW with $584 billion, down from $612 billion
- SGD with $518 billion, up from $417 billion
- HKD with $345 billion, up from $319 billion
- THB with $179 billion, up from $136 billion
- TWD with $85 billion, down from $91 billion
Not shown in the chart is market share by CCP, where LCH has >99% share for the whole period in every currency except for:
- CNY, Shanghai with 59.7%, LCH with 40.1%, HKEX 0.2%
- INR, LCH with 64.1%, CCIL with 35.9%
- HKD, LCH with 98%, HKEX 1.5%, CME 0.5%
LatAm Swaps
Next lets look at LatAm Swaps.
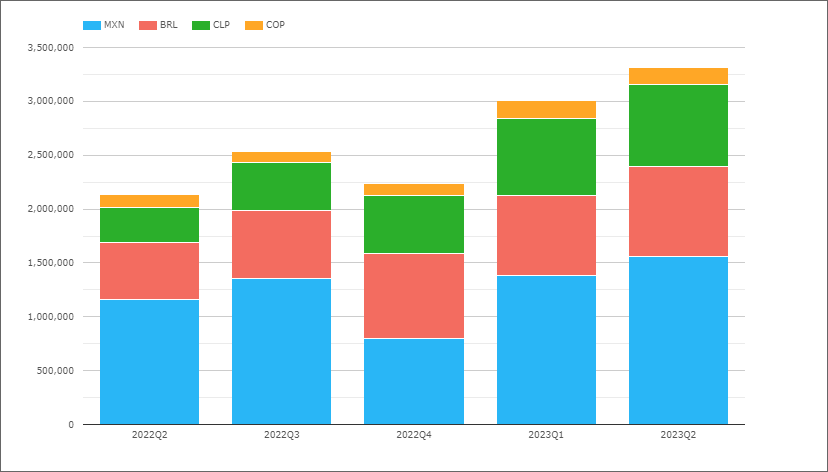
- 2023Q2 with $3.3 trillion, up from $2.1 trillion in 2022Q2
- LatAm the only region (major ccy) that is higher in Q2 than Q1
- MXN the largest in 2023Q2 with $1.56 trillion, up from $1.16 trillion in 2022Q2
- BRL next with $830 billion, up from $530 billion
- CLP with $765 billion, up from $331 billion
- COP with $155 billion, up from $219 billion
Not shown in the chart is market share by CCP, where CME has > 98% except for:
- MXN, CME with 86.9%, Asigna/Mexder 11.1%, LCH 2%
Cross Currency Swaps
HKEX the only CCP with cleared Cross Currency Swap volumes.
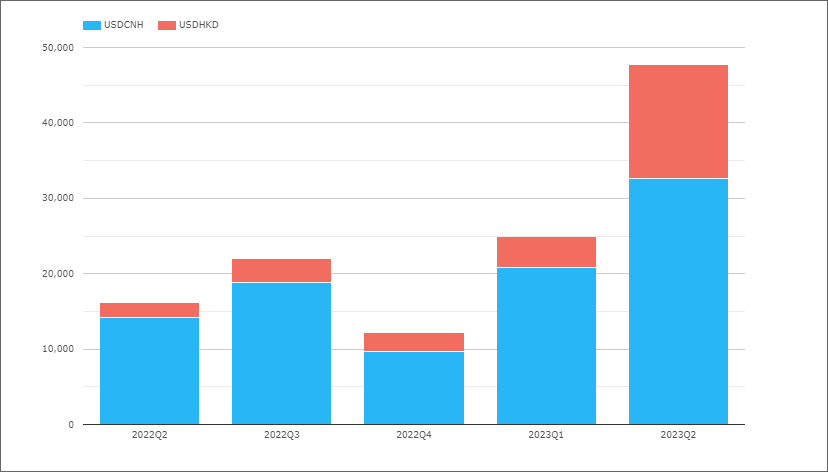
- 2023Q2 with $48 billion, significantly up from the $25 billion in 2023Q1
- Most volume in USDCNH, while USDHKD with a record quarter in 2023Q2
LCH SwapAgent does not clear XCCY Swaps, but offers processing, margining and settlement of bi-lateral trades for this product. Volumes are not available regularily, but we know from a LCH press release that SwapAgent registered record volumes of $2.7 trillion (double-sided) notional in 2022.
That’s It
12 Charts for an overview.
Still a lot more data to look at
Volume, DV01 and Open Interest by currency.
IR Futures in all the major currencies and US Treasury volumes.
Credit Derivatives and FX Derivatives.
For more details, please contact us for a CCPView demonstration.