USD LIBOR is no more:
I will likely never type US0003M into my Bloomberg ever again. I doubt many will shed a tear at the ultimate demise of LIBOR because:
- Most markets transitioned to RFRs well before Friday June 30th 2023.
- Managing daily fixings versus LIBOR was quite a different job to trading Eurodollar futures. For most swaps traders, it would be considered a “chore” – albeit a relatively technical one.
- Traders will continue to have some noise associated with LIBOR fallbacks. Fallenback trades are not exactly fungible versus vanilla RFR trades, which is likely to cause some frictions when considering terminations/novations/amendments on the ever-decreasing stock of “fallenback” LIBOR trades.
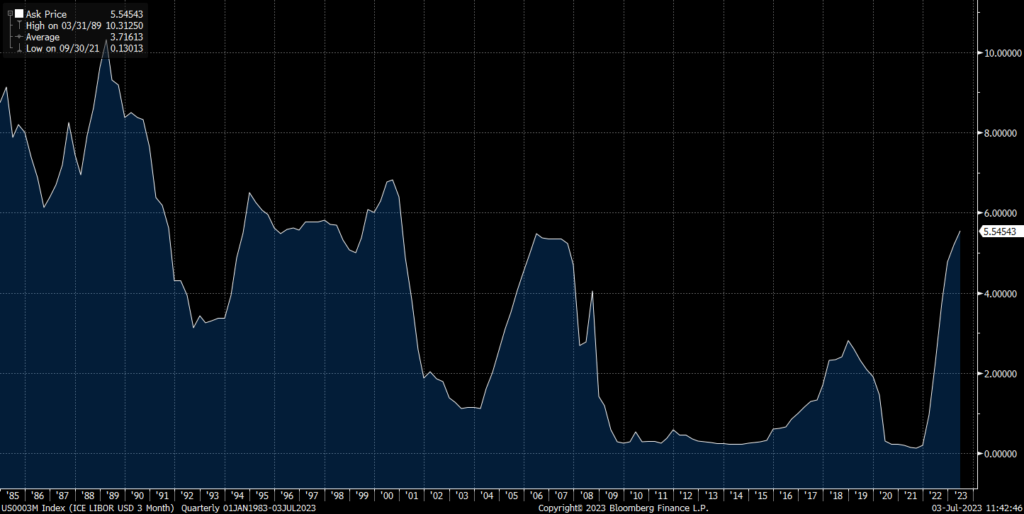
LIBOR – The Numbers
This is as good a time as any to therefore pause and consider some of the things we saw in USD LIBOR – historic data up to about 2020 can be found here: 3 Month LIBOR Rate – 30 Year Historical Chart
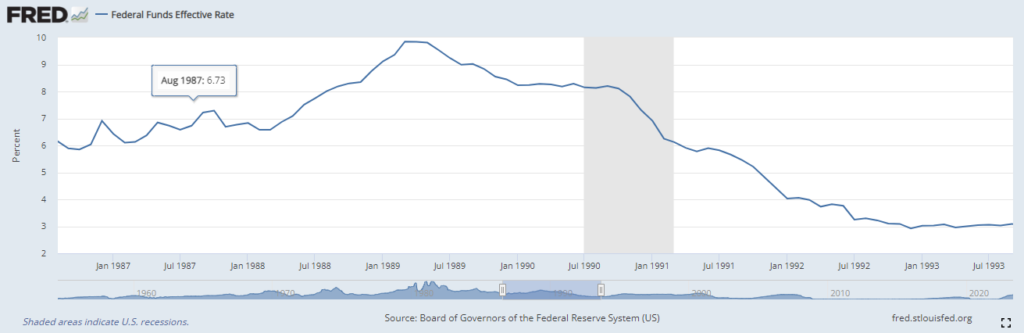
- The all time high of 3 month USD LIBOR was 10.63% on 21st March 1989.
- It is well worth reading about the economic/political backdrop to these rate rises as Greenspan fought to overcome inflation, seemingly to the displeasure of the Bush administration, and amid “doubt[s over] the central bank’s anti-inflation commitment“. The rate rise in February of that year resulted in both stocks and bonds dropping.
- Interesting to note the reference to the “battered savings and loans industry” in that article. Replace with “regional banks” and the similarities to 2023 are uncanny….
- Inflation at that time was running at 4%, albeit peaking the following year at over 6.5%. (June 2023 CPI just decreased to 4%). However, the Fed had started hiking with Fed Funds already at 6% in 1989, rather than at a post-COVID 0% this time around.
- March 1989 would prove to be the final rate hike in the cycle, as the economy headed for recession in 1990:
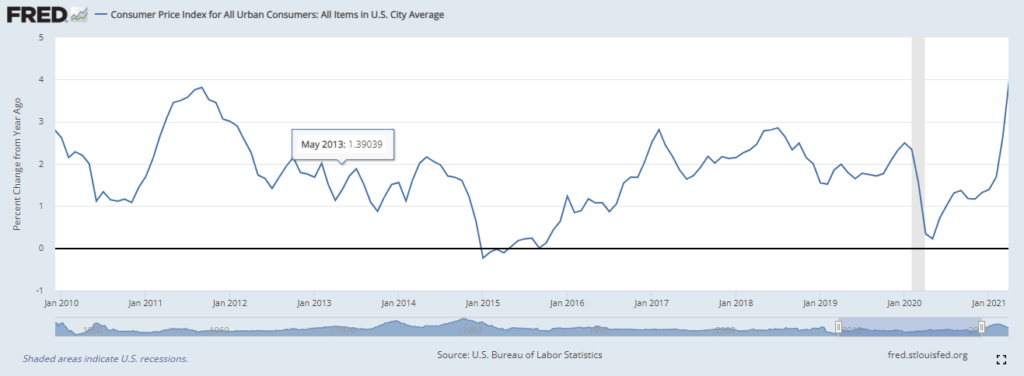
- The all time low in USD LIBOR was much more recent: 0.2229% on 1st May 2014.
- The deflationary backdrop in 2014 did not seem too terrible to me, with May 2014 CPI hitting 2.1%.
- But monetary policy works with such a delay that this CPI print was really just signaling that inflation was hitting a high before decreasing every month for the next year, finally heading into negative territory early in 2015:
- Whilst outright levels of LIBOR are interesting from a historical perspective, it was the daily changes in the rate that always grabbed traders attention.
- The largest ever daily increase in 3m USD LIBOR was on 29th September 1999, when it increased by a huge 57 basis points.
- Yup, the largest daily change ever seen was not due to the GFC, European Debt Crisis or any “crisis” per se.
- Students of history will also note that it wasn’t due to any change in financial policy or even “Fed speak” hinting at more rate rises to come.
- It wasn’t even related to LTCM (1998), the associated Asian Financial Crisis or the Dot-Com boom/bust (2000).
- Nope, it was the “Millennium Bug“. Seriously!
- 29th September 1999 marked the date that 3 month USD LIBOR went “over the turn”, meaning that banks were lending USD that would mature after 1st January 2000.
- Humans had such little faith in technology/coding was so bad back then/banking infrastructure was so old and underinvested that no one wanted to lend money over the year-end in case the computerised portion of the world blew up in January 2000.
- It is pretty incredible to think now. Equally it is quite nice from a Clarus blog point of view that it was actually Fintech that caused the biggest ever move in USD LIBOR in its entire history 😛
- The largest ever daily decrease in 3m USD LIBOR was on 21st October 1987, when it decreased by 69 basis points.
- This move lower was as a result of “Black Monday” on October 19th 1987 as fears of a “Great Depression” ripped through markets.
- Interestingly, it looks like it was a single line issued by the Fed that instigated the drop:
- “The Federal Reserve, consistent with its responsibilities as the Nation’s central bank, affirmed today its readiness to serve as a source of liquidity to support the economic and financial system.“
- Reading a quick history here and here, it is pretty incredible that on the day the credit-worthiness of CME was being called into question, LIBOR could drop by so much!
- The effects of Quantitative Easing, which is what the Fed had really announced, were felt much more keenly the first time it was ever done than during subsequent “crises”.
What Made LIBOR Famous
Viewed entirely through the lens of record highs and lows and unusually volatile daily changes, readers may be surprised to note that we haven’t mentioned anything about fixings scandals, rate rigging or quoted a single line of IB chat yet (“Done…for you big boy” and of course “Dude, I owe you big time! Come over one day after work and I’m opening a bottle of Bollinger“).
I still find the underlying story of the LIBOR scandal and how it unfolded quite incredible. It is always worth reviewing the Reuters LIBOR timeline to understand the simple facts:
- Banks didn’t submit LIBOR quotes that said “there are no prices to borrow, aaaarrrrggghhhhh“…
- ..then got a bit uneasy about the fact…
- …but completely forgot to mention that they had been “changing” their submissions for some of their nicer swaps traders long before the GFC.
No one mentions the difference in magnitude between the two different reasons for “misrepresentative” LIBOR fixings because at the end of the day, wrong is wrong and regulations are regulations. As far as I know, no-one ever said “it is okay to submit LIBOR 0.25bp either way, but don’t get it wrong by 200 basis points please“. Perhaps if they did we would still have some term fixings out there 😛
It is the period from 2007-2009 that really changed the impact of LIBOR on the day-to-day lives of all finance professionals. Long before the actual “scandal” and the prosecutions, everyone in Fixed Income trading would come into the office and ask where 3 month USD LIBOR was expected to fix that day (even before saying “hello” to anyone!).
The below chart is helpful in understanding why that was:
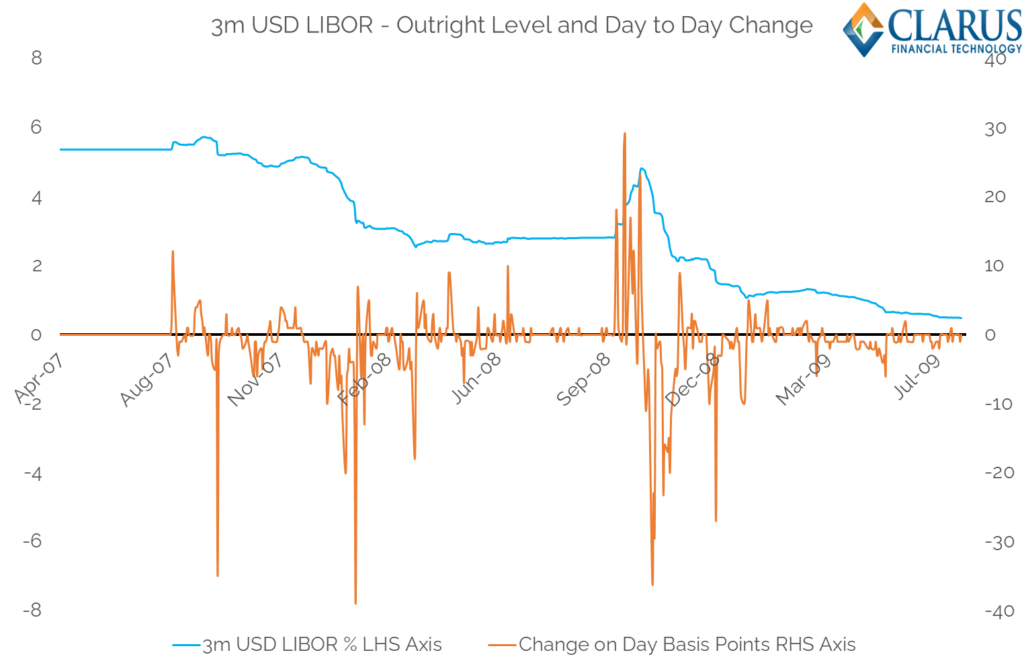
It is the areas on the left hand side and right hand side that give the context here:
- Before August 2007 (Northern Rock...) 3m USD LIBOR recorded 83 days in a row when it fixed at 5.36%. That is over four months!
- In the space of three fixings it then shot up to 5.58%. The (swaps) world was never the same again.
- Remember this was absent any Fed action, this was purely due to tightening in credit conditions as a “credit crunch” began to unfold.
- The daily volatility in the fixings began to overshadow most other risks on swap books.
- This was, of course, replicated in other tenors – 6m and 1m LIBORs were possibly even more volatile – and helped tenor basis (particularly 3s6s) start trading like never before.
- It wasn’t until well into the Summer of July 2009, two years later, that this daily volatility in fixings seemed to abate somewhat.
- In this period (~480 LIBOR fixings), almost 20% of fixings moved (either up or down) by 5 basis points or more.
- Trust me, seeing a 5 basis point move in fixings, once a week, for two years, is absolutely nuts. And even more so when coming out of a period when LIBOR was so freakishly stable.
That period of time served to revolutionise risk management in swaps markets. Many more risks in swap markets are now understood (from OIS discounting, to funding adjustments and cross gammas) by more people in the market. It resulted in our much vaunted transparency and each crisis since (namely the Eurozone debt crisis and the COVID Pandemic) have resulted in financial markets reacting in a recognisable way.
And it can all be seen through a LIBOR lens. Maybe I will miss daily LIBOR fixings afterall!
The king is dead, long live the king!
SO true !
Talking of tenor basis, I always point younger colleagues to the chart of 3s6s USD basis: plot, say 1y from 1993-2013. It was ~0.5 everyday right up to late 2007, then spiked up to 50+ by 2009.
Similar story with XC basis, try cable that was a 3/8-1/2 market for literally years…
The historical context was a real bonus. Thanks! The EUR/USD three-month cross currency basis swaps spread (based on LIBOR) was used to monitor USD funding stresses. For instance, the ESRB use to publish it in their Risk Dashboard. Bloomberg’s XCCY function publishes the EUR/USD cross currency basis spread based on €STR/SOFR, but the minimum tenor is 1yr. What is the benchmark used to monitor USD funding stresses in the market now? Is 1yr the new benchmark? Thanks again.
Good question. With LIBOR-OIS gone, you really only have SOFR vs €STR spreads to monitor. 5y bank CDS is another favourite of course…
So true. The risk is that we think we know where all the basis is now. Until things like CCP Basis suddenly crop up. There will always be things we don’t know that we don’t know….