Clarus CCPView has daily volume and open interest data published by each CCP, which is filtered, normalised and aggregated to allow meaningful comparisons of volumes.
Today we look at 1Q24 volume and market share in IRD for:
- USD Swaps (SOFR, FF)
- EUR Swaps (EURIBOR, €STR)
- GBP Swaps (SONIA)
- JPY Swaps (TONA)
- AUD Swaps (BBSW, AONIA)
- CAD Swaps (CDOR, CORRA)
- EMEA Swaps
- AsiaPac Swaps
- LatAm Swaps
Onto the charts, data and details, before we do a short summary generated by Google Gemini:
This is an article about CCP volumes and market share in the IRD. It discusses volumes for major currencies and regions. It also details CCP market share. USD OIS swaps are the highest on record. EUR OIS volumes are also at a record high. The combined EUR IRS and OIS volume is almost equal to the USD OIS volume. AUD swaps are down from a year earlier. CCP market share is dominated by LCH with some exceptions.
Volumes and Market Share
For major currencies and regions, vanilla swaps referencing IBORs and OIS Swaps referencing RFRs, using single-sided gross notional volume over a period; either a month, quarter or year.
USD OIS
Swaps referencing either Fed Funds or SOFR indices.
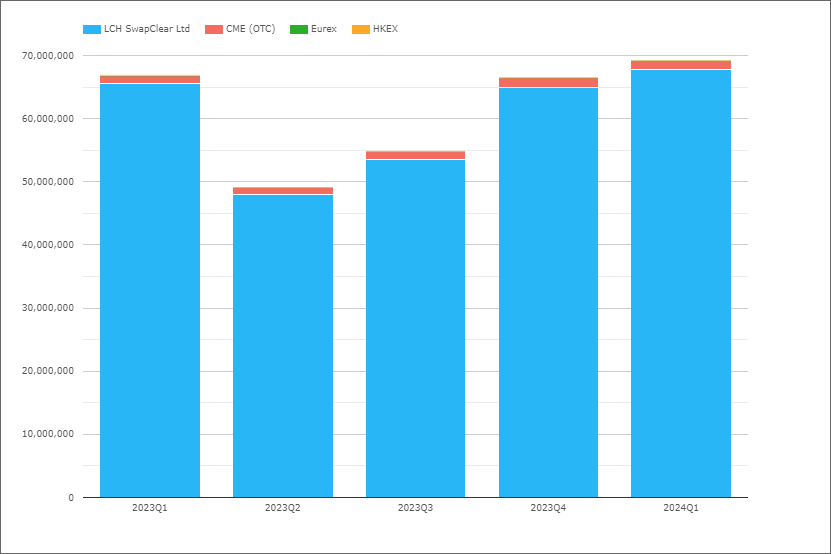
- 2024Q1 with $69.2 trillion is up 4%, compared to $66.8 trillion in 2023Q1
- LCH SwapClear with $67.75 trillion in 2024Q1 and $65.6 trillion in 2023Q1
- CME OTC with $1.45 trillion in 2024Q1 and $1.15 trillion in 2023Q1
- 2024Q1 Share is LCH 97.9% and CME 2.1%, compared to 98.3% v 1.7% in 2023Q1
2024Q1 is the highest volume on record, while 2023Q3 was also close to the prior high in 2023Q1.
EUR Swaps (Euribor)

- 2024Q1 with €17 trillion is up 16% compared to €14.6 trillion in 2023Q1
- LCH SwapClear with €16.3 trillion in 2024Q1 and €14 trillion in 2023Q1
- Eurex with €0.73 trillion in 2024Q1 and €0.66 trillion in 2023Q1
- 2024Q1 market share is LCH 95.7%, Eurex 4.3%
- While 2024Q1 share was 95.4% and 4.5% respectively
2024Q1 is the highest volume on record, with 2023Q1 the prior high.
EUR OIS
Referencing either EONIA or €STR, though in recent quarters all will be €STR.

- 2024Q1 with €44.1 trillion is up 32%, compared to €33.5 trillion in 2023Q1
- LCH SwapClear with €43.5 trillion in 2024Q1 and €33 trillion in 2023Q1
- Eurex with €0.64 trillion in 2024Q1 and €0.56 trillion in 2022Q1
- 2024Q1 market share is LCH 98.5%, Eurex 1.5%, similar to a year earlier
2024Q1 is again the highest volume on record, with 2023Q1 the prior high.
The combined EUR IRS and OIS volume of €61 trillion in 2024Q1 at an fx rate of 1.06 is eqivalent to $64.5 trillion, so almost equal to the USD OIS volume of $69 trillion. Though we know from the RFR Adoption Indicator that when using DV01 instead of notional, the continutation of Euribor resulted in the EUR IRD market (Swaps and Futures) exceeding the size of the USD IRD market in 2023.
GBP OIS (SONIA)

- 2024Q1 with £17.5 trillion is up 10% compared to £15.9 trillion in 2023Q1
- LCH SwapClear with 99.9% share
2024Q1 volume just below the record high of £18.4 trillion in 2020Q1.
JPY OIS (TONA)
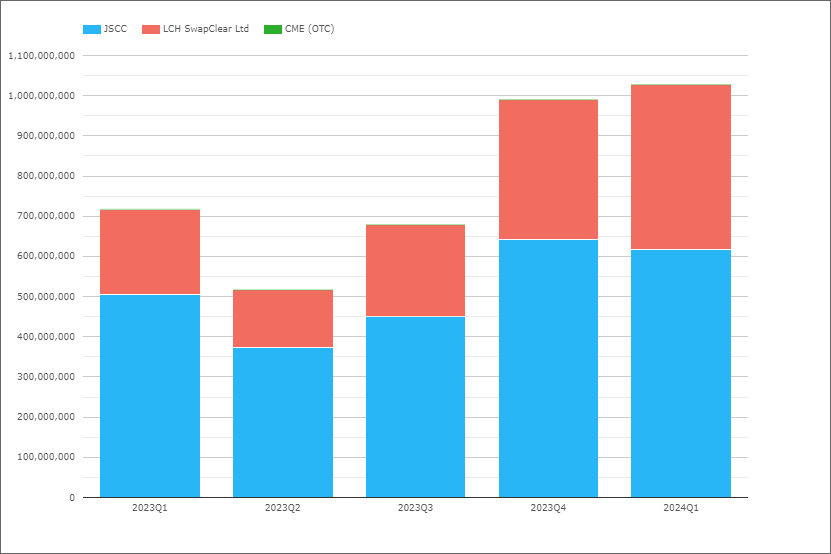
- 2024Q1 with Y1,028 trillion is up 43% compared to Y718 trillion in 2023Q1
- JSCC with Y616 trillion in 2024Q1, compared to Y504 trillion in 2023Q1
- LCH SwapClear with Y412 trillion in 2024Q1, compared to Y213 trillion in 2023Q1
- 2024Q1 Share is JSCC 59.9%, LCH 40.1%, compared to 70.3% and 29.7% in 2023Q1
2024Q1 volumes a record high, above 2023Q4 and 2023Q1 the prior highs.
At an FX rate of 154, the Y,1028 trillion is equivalent to USD 6.7 trillion.
AUD Swaps
Referencing either AONIA or BBSW, so both OIS and IRS.
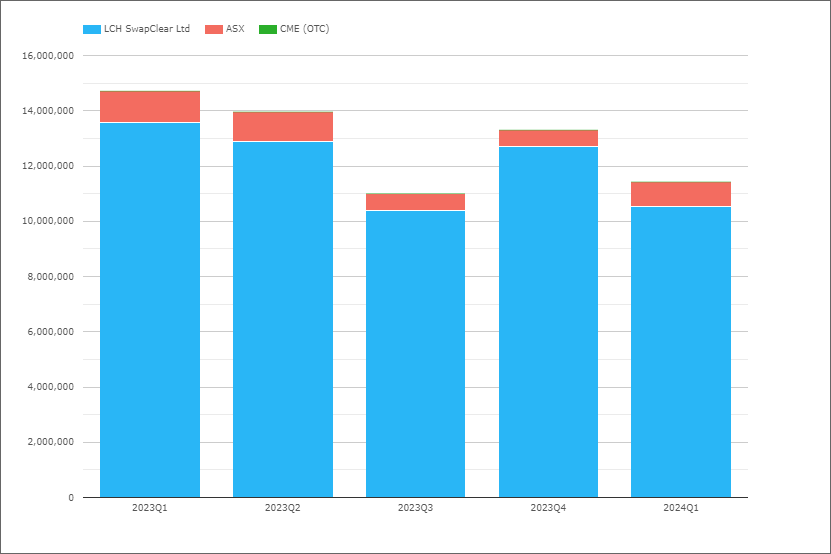
- 2024Q1 with A$11.4 trillion is down 22% compared to A$14.7 trillion in 2023Q1
- LCH SwapClear with A$10.5 trillion in 2024Q1 and A$13.6 trillion in 2023Q1
- ASX with A$0.9 trillion in 2024Q1 and A$1.1 trillion in 2023Q1
- 2024Q1 Share is LCH 92.2% and ASX 7.8%, the same as it was in 2023Q1
AUD the only currency so far that is down from a year earlier and well-off its record high in 2020Q1 of A$22.8 trillion.
CAD Swaps
Referencing either CORRA or CDOR, so both OIS and IRS.

- 2024Q1 with C$5.1 trillion, compared to C$5.85 trillion in 2023Q1
- IRS down to C$414 billion from C$1.96 trillion, as the move to CORRA nears completion
- LCH SwapClear with 99.8% of the volume
EMEA Swaps
Now let’s switch to EMEA Swaps (all types) and volumes by currency.
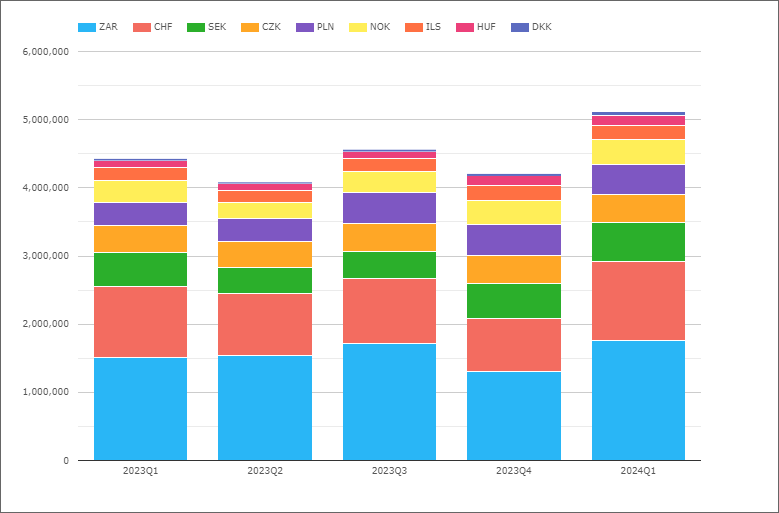
- 2024Q1 with $5.1 trillion is up 16% from $4.4 trillion in 2023Q1
- ZAR the largest in 2024Q1 with $1.76 trillion, up from $1.5 trillion in 2023Q1
- CHF next with $1.2 trillion, up from $1 trillion in 2023Q1
- SEK with $566 billion, up from $504 billion
- PLN with $437 billion, up from $327 billion
- CZK with $420 billion, up from $397 billion
- NOK with $371 billion, up from $326 billion
- ILS with $196 billion, flat from a year earlier
- HUF with $158 billion, up from $98 billion
- DKK with $47 billion, up from $29 billion
Volumes up in all currencies from a year earlier, except for ILS.
Not shown in the chart is market share by CCP, where LCH has >98.5% share for 2024Q1 in every currency except for:
- PLN, LCH with 97.6%, CME 1.4%, KDPW 1%
- HUF, LCH with 98.2%, CME with 1.8%
AsiaPac Swaps
Now let’s switch to AsiaPac Swaps (all types) and volumes by currency.

- 2024Q1 with $6.9 trillion is up 19% from the $5.8 trillon level in 2023Q1
- So materially larger than the $5.1 trillion for EMEA
- NZD the largest with $2 trillion in 2024Q1, signifciantly up from $1.4 trillion in 2023Q1
- CNY next with with $1.9 trillion, same as a year earlier
- KRW with $850 billion, up from $614 billion
- INR with $774 billion, up from $716 billion
- SGD with $567 billion, up from $518 billion
- HKD with $387 billion, down from $474 billion
- THB with $314 billion, up from $158 billion
- TWD with $140 billion, down from $84 billion
Except for CNY & HKD, every currency is higher than 2024Q1 than a year earlier, with NZD, KRW, TNB & TWD each with large increases in volume.
Not shown in the chart is market share by CCP, where LCH has >99.7% share for 2024Q1 in every currency except for:
- CNY, Shanghai with 61.6%, LCH with 38.3%, HKEX 0.1%
- INR, LCH with 69.7%, CCIL with 30.3%
- HKD, LCH with 98.3%, HKEX 1.1%, CME 0.4%
LatAm Swaps
Next lets look at LatAm Swaps.
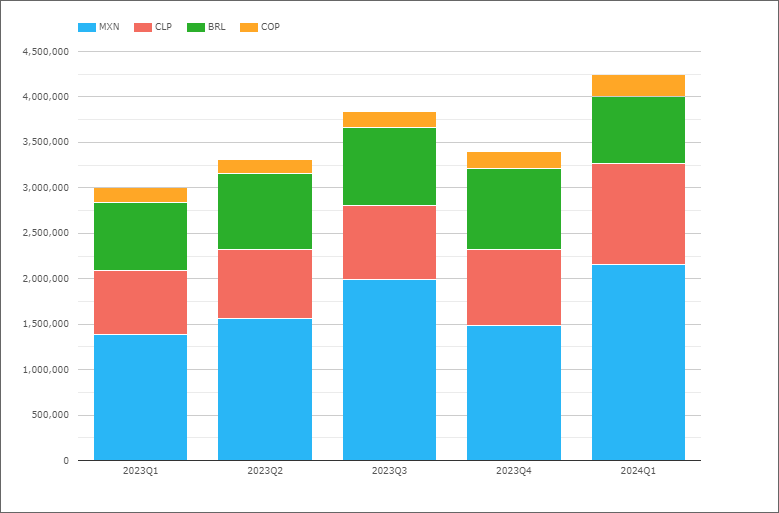
- 2024Q1 with $4.25 trillion is up 42% from $3 trillion in 2023Q1
- MXN the largest in 2024Q1 with $2.2 trillion, up from $1.38 trillion in 2023Q1
- CLP with $1.1 trillion, up from $710 billion
- BRL next with $745 billion, same as a year earlier
- COP with $243 billion, up from $167 billion
MXN and CLP with very signifciant increases.
Not shown in the chart is market share by CCP, where CME has > 98.5% for 2024Q1 except for:
- MXN, CME with 90.6%, Asigna/Mexder 7.1%, LCH 2.3%
That’s It
10 Charts for an overview.
Still a lot more data to look at
Volume in DV01 terms and Open Interest by currency.
IR Futures in all the major currencies and US Treasury volumes.
For more details, please contact us for a CCPView demonstration.