- January 2018 saw all time notional volume records in Cross Currency Swaps.
- Some of this volume was in short-dated USDJPY products.
- BGC captured a large portion of the uptick in volumes, seeing a 40% market share for on-SEF products.
- We need to be able to see European volumes to improve our understanding of this important market.
The Customer is always right
I had a good reminder this week that my clients are better informed than I. Out of the blue, I was asked to update my October blog on Cross Currency volumes. Why I wondered? Then I ran the numbers.
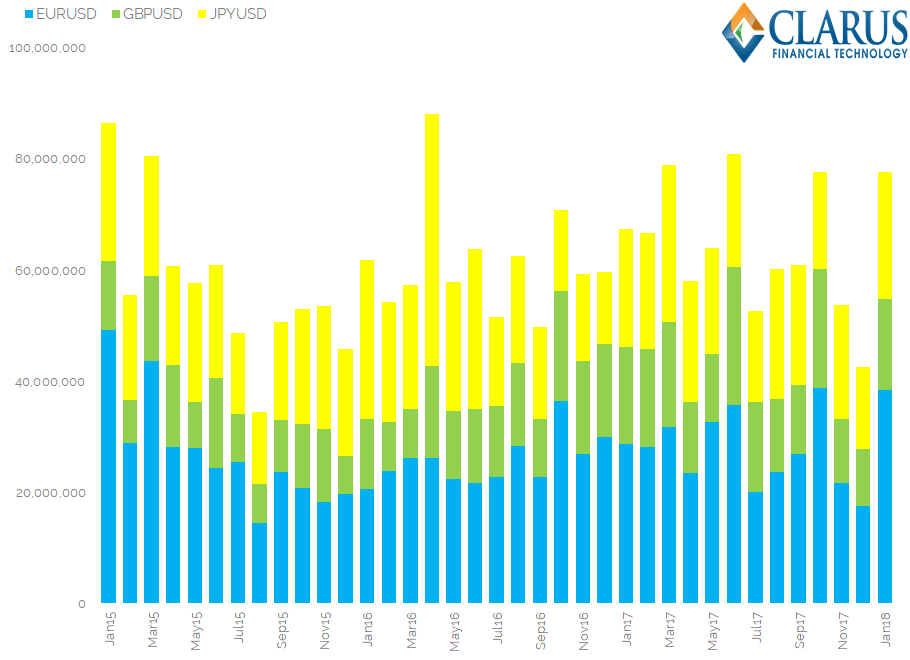
January 2018 looks like a record month for Cross Currency Swap volumes reported to the US SDRs:
Showing;
- Notional amounts of EURUSD, GBPUSD and USDJPY reported to US SDRs. This is for basis swaps only (floating ‘Ibor in one currency exchanged for floating ‘Ibor in another). We assume most of these are resettable.
- USDJPY saw a particularly lack-lustre month for volumes in December 2017 but this rebounded with a vengeance in January 2018.
- In January 2018, $250bn of USDJPY traded, compared to a monthly average in 2017 of just $138bn (i.e. 80% higher than usual).
- EURUSD volumes were 65% higher than monthly averages in 2017 (Jan 2018 $166bn vs a $101bn average).
- GBPUSD volumes were 27% higher at $66bn (vs a $52bn average).
To put this into perspective, it is a good idea to have an idea of global volumes. Due to the lack of public MIFID II data, we need to turn to BIS statistics. In April 2016, there was an Average Daily Volume of $82bn reported in Cross Currency swaps. This was a significant increase in volumes since the previous survey in April 2013 ($54bn):
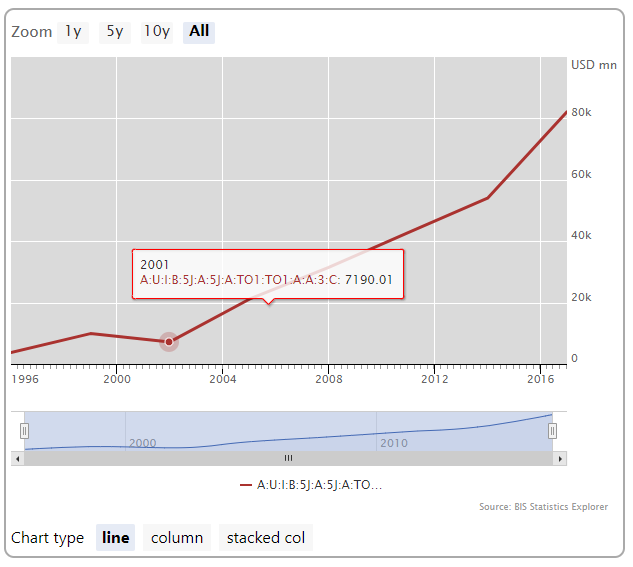
Comparing like-for-like April 2016 data, BIS data suggests that SDR data covers around 25% of the global cross currency market.
Assuming that ratio still holds, then global Cross Currency Swap volumes in January 2018 could have been $2.6trn.
It seems like my old colleagues are therefore enjoying bumper volumes. Given January is known as “issuance season“, there is a good chance that a lot of these volumes were tied to bond issuance. So I wanted to dig deeper and take a look at where these volumes were trading and in which maturities.
SEF Trading
Before I get onto the maturity profile of these volumes, I also want to take a look at how trading has developed across platforms for this product. Remember there is no clearing obligation and no execution mandate for these swaps. And yet, SEF trading is pretty successful.
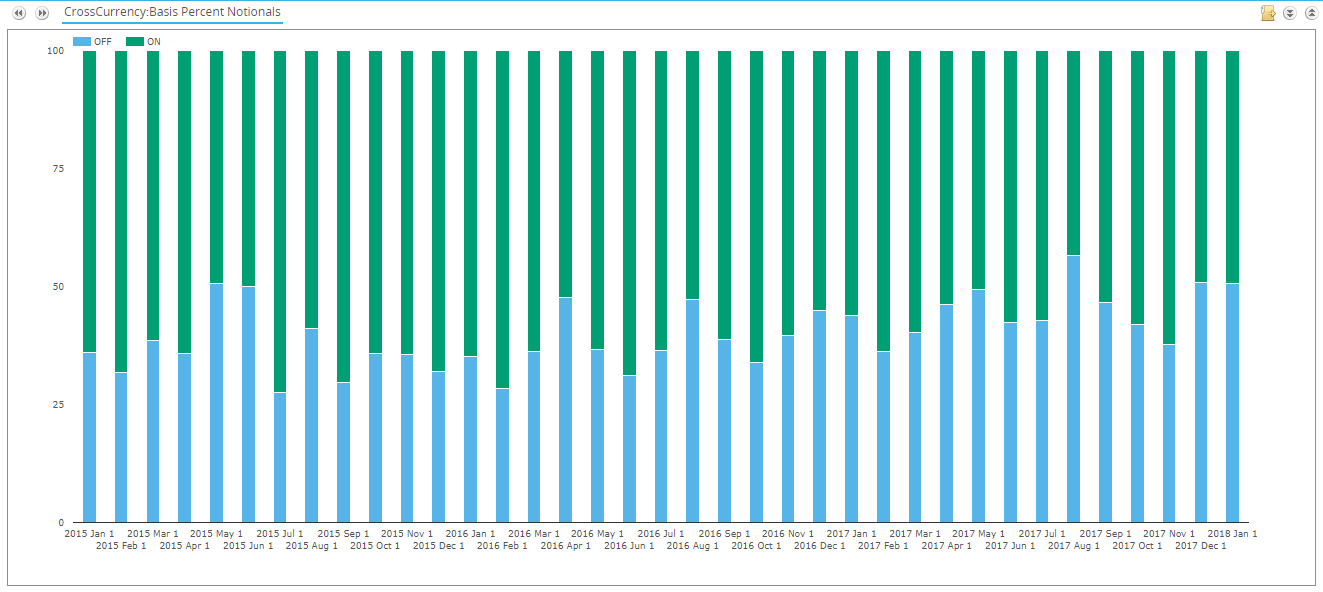
Showing;
- In a record month such as January 2018, 50% of notional reported to SDRs traded on-SEF (this is down from 2016 highs of 62% on-SEF).
- For the global market, this suggests that 12.5% of the total market was traded on-SEF last month.
- I wonder how MTFs and OTFs are doing in Europe? We still don’t have good enough data to say.
How much risk traded?
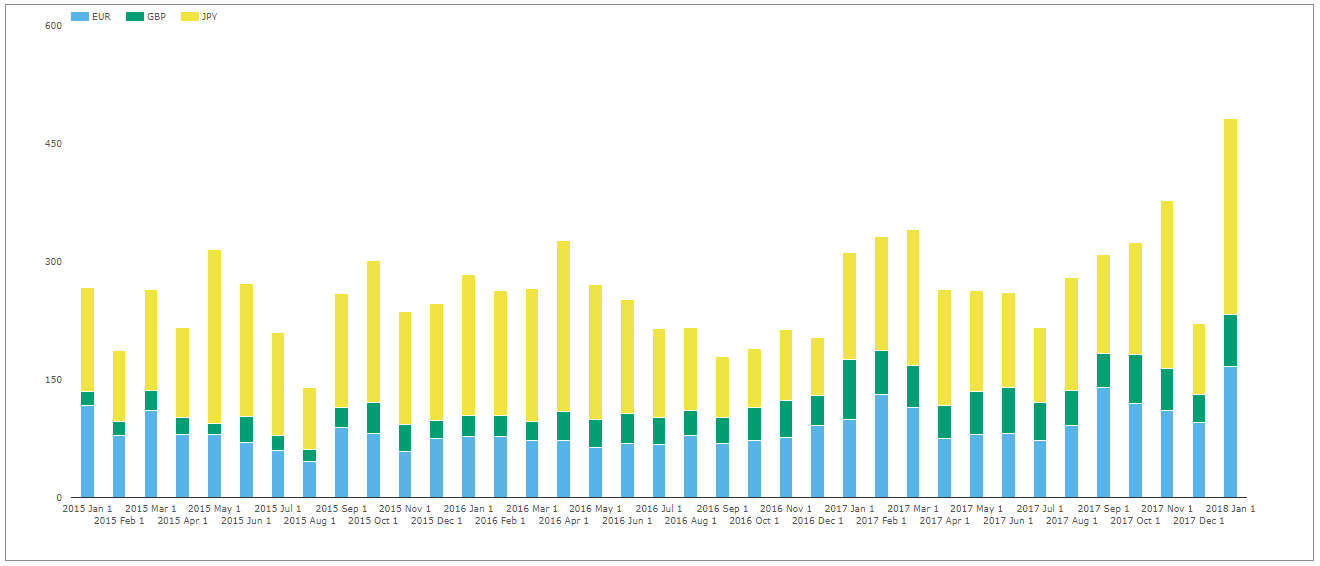
The first chart in this blog shows that there was a spike in USDJPY notional traded. We have previously seen that USDJPY is a short-term market. So I wanted to check how much DV01 traded recently. Using SDRView Res and our Microservices, I was able to translate the tenor into a DV01 measure for SDR trades. The results are not quite so exciting:
Showing;
- January 2018 saw $78m of DV01 trade across EURUSD, GBPUSD and JPYUSD. This was not a record month.
- The highest amount of risk that has been traded was $88m, back in April 2016.
- The average month in 2017 saw $65m DV01 trade – so January 2018 was 22% above normal. Pretty good, and some $10m higher than January 2017.
- Overall, it suggests that January 2018 was a good month but not a stellar month.
Which SEF saw large volumes?
I repeated this exercise for our data in SEFView to see which SEF platforms won or lost market share in January 2018. Just bear in mind that this is only a portion (~12.5%) of the overall market. MIFID II data should provide better data eventually.
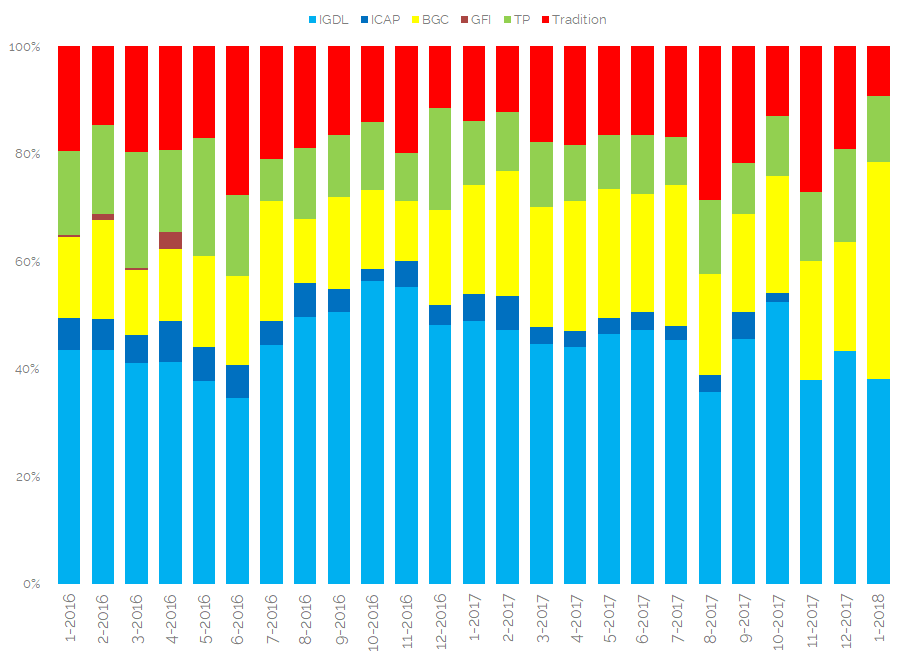
Showing;
- Volumes of Cross Currency Basis across each SEF on a DV01 measure in EURUSD, GBPUSD and JPYUSD.
- BGC were the big gainer in January 2018.
- BGC’s market share improved from an average of 22% to nearly 40% in January 2018.
- This put them neck and neck with ICAP who have always been the number 1 desk.
- Our latest data for February, however, has BGC back down at ~25% market share. Was January a “blip”?
One day that does stand out at BGC is 10th Jan, when a lot of 5y, 7y and 10y EURUSD traded ($1.4m DV01, accounting for ~7% of monthly volumes). It is frustrating that we don’t have more details about what traded off-venue via MIFID II data. One day….
In Summary
- January 2018 was a record month for Cross Currency Basis volumes reported to US SDRs, but not for the amount of risk traded.
- SDR data covers about 25% of the global cross currency swaps market.
- BGC had a market share of 40% for on-SEF traded cross currency products in January 2018.